
Diabetes patients, especially those diagnosed for the first time, often need to check their pancreatic function through blood tests. The main methods for checking pancreatic function are the insulin and C-peptide release tests, which are very important for diagnosing diabetes, determining its type and prognosis, and guiding treatment. In this issue, we will discuss how to interpret the results of the insulin and C-peptide release tests. Under normal circumstances, insulin
C-peptide release test results
Normal fasting plasma insulin levels in healthy individuals are about 5-20 mIU/L, and C-peptide levels are about 0.3-1.3 nmol/L. After oral glucose intake, blood sugar rises rapidly, and insulin and C-peptide levels also increase quickly, with peak values usually occurring between 0.5-1 hour post-glucose intake. The peak insulin level can reach 5-10 times the fasting value; the peak C-peptide level can reach 5-8 times the fasting value, gradually decreasing after reaching the peak, returning to fasting levels within 2-3 hours.Three Key Points: Points, Lines, and Peaks
Analyzing Test Results
The determination of insulin and C-peptide release test results needs to be combined with the blood sugar values measured at the same time points (i.e., glucose tolerance test). Evaluating pancreatic function without considering blood sugar is not practically meaningful.
For clarity, we often plot the blood sugar values and insulin and C-peptide values at each time point (with the fasting coordinate as 0) into a curve graph, namely the glucose tolerance curve and the insulin and C-peptide release curve. By analyzing these, we can understand the reserve function and degree of exhaustion of the pancreatic beta cells in the patient.
- By examining the ratio of insulin (or C-peptide) values at each time point to the simultaneously measured blood sugar levels, we can determine whether there is relative hyperinsulinemia and insulin resistance.
- By observing the timing of peak occurrence, we can determine whether there is a delayed peak, which is characteristic of type 2 diabetes.
- By observing whether the release curve is flat, and combining it with medical history and results from diabetes autoantibody tests, we can analyze and determine the type of diabetes: type 1 diabetes, latent autoimmune diabetes in adults (LADA), or type 2 diabetes.
If type 2 diabetes is suspected, further analysis should consider the patient’s clinical characteristics (such as duration of illness, presence of stress factors, efficacy of hypoglycemic drugs, daily blood sugar control status, etc.) to further analyze whether hyperglycemic toxicity suppresses pancreatic beta cell function, or whether it is due to prolonged course leading to beta cell function failure (if it is the former, with active treatment, pancreatic function is expected to improve).
It is particularly important to note that for patients who have already been treated with insulin, antibodies to insulin may develop, and measuring blood insulin levels cannot evaluate the patient’s own pancreatic function. The pancreatic beta cell function should be based on the results of the C-peptide release test.
Three Common Types of Abnormalities in Glucose Metabolism
Insulin and C-Peptide Release Test Results
-
Decreased Insulin Secretion Type
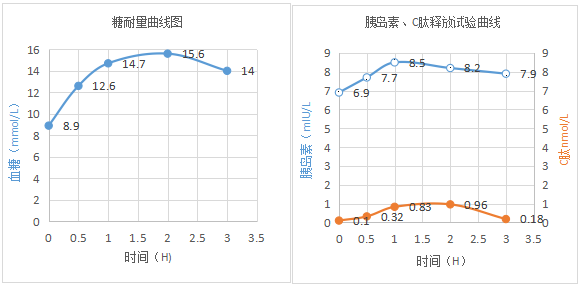 Interpretation: The patient’s glucose tolerance test indicates typical clinical diabetes; fasting serum insulin and C-peptide levels are below normal. Following the oral intake of 100 grams of steamed bread or 75 grams of sugar water, as blood sugar levels rise, there is no significant increase in insulin and C-peptide levels, no peak appears, and a flat curve is observed, indicating absolute insufficiency of insulin secretion, or even failure of beta cell function, commonly seen in type 1 diabetes, LADA, or patients with a long course of type 2 diabetes; at this point, the efficacy of oral hypoglycemic drugs is poor, indicating that insulin treatment must be applied.
- Increased Insulin Secretion Type
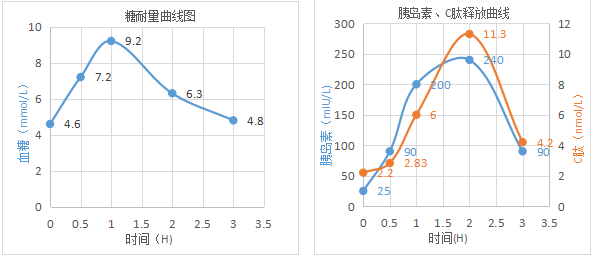 Interpretation: The glucose tolerance test is normal; fasting serum insulin and C-peptide levels are elevated, and peak values are normal but delayed (peaks appear after 2 or 3 hours). This indicates that the patient has relatively insufficient insulin secretion, with pancreatic function primarily characterized by insulin resistance. Such patients are prone to pre-meal hypoglycemia; although glucose tolerance is normal, they belong to a high-risk group for diabetes, commonly seen in overweight individuals and early-stage type 2 diabetes. Treatment should focus on lifestyle interventions, dietary and exercise guidance, and actively reducing weight; insulin sensitizers should be added as necessary.
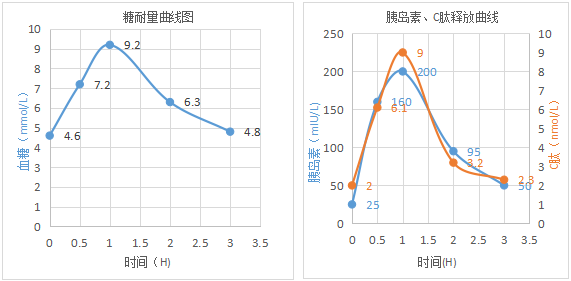 Interpretation: The glucose tolerance test is normal; fasting insulin and C-peptide are elevated, peak values and peak timing are normal, indicating fasting insulin resistance, commonly seen in overweight and obese individuals. Treatment should focus on lifestyle interventions, dietary and exercise guidance, and actively reducing weight.
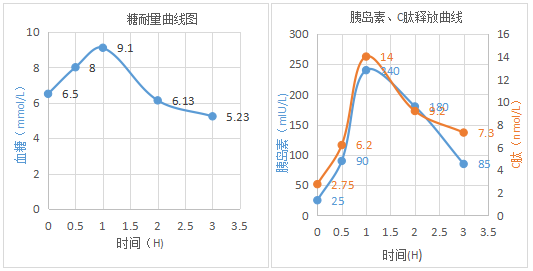 Interpretation: The glucose tolerance test indicates impaired fasting blood glucose; fasting insulin and C-peptide levels are elevated, peak values and peak timing are normal, but after 3 hours, the levels remain high and do not return to fasting levels, indicating insulin resistance. This is prediabetes; if not actively intervened, it may gradually progress to clinical diabetes.
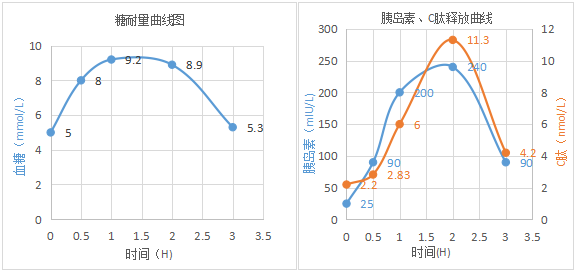 Interpretation: Glucose tolerance is reduced, with 2-hour blood sugar levels greater than or equal to 7.8 mmol/L but less than 11.1 mmol/L; fasting insulin and C-peptide levels are elevated, peak values are normal but peak timing is delayed, and after 3 hours, levels remain high and do not return to fasting levels, indicating insulin resistance. This is also prediabetes; if not actively intervened, it may gradually progress to clinical diabetes.
 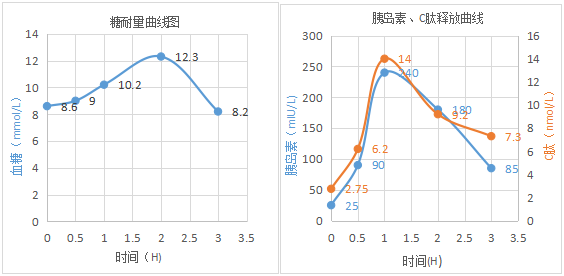 Interpretation: Fasting insulin and C-peptide levels are elevated, and after oral glucose intake, peak values and peak timing are normal, indicating that the pancreas is still sensitive; however, 2-hour blood sugar levels exceed 11.1 mmol/L, indicating type 2 diabetes, with pancreatic function still normal. Patients of this type respond well to treatment with sulfonylureas and other insulin secretagogues.
- Insulin Release Impairment Type
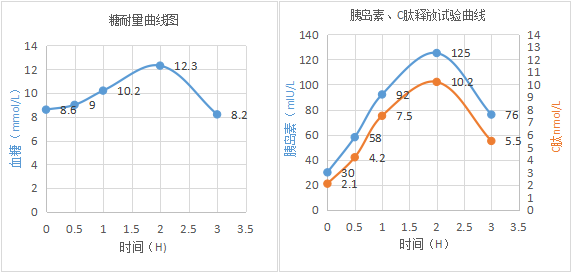 Interpretation: Fasting insulin and C-peptide levels can be normal, elevated, or lowered; after glucose intake, the release curve rises slowly, with delayed peaks that are below normal, and the release curve after 3 hours still does not return to fasting levels, indicating that the glucose tolerance test is indicative of clinical diabetes. This type of patient responds well to treatment with sulfonylureas and other insulin secretagogues, but as the disease progresses, their fasting insulin and C-peptide levels gradually decrease, the postprandial release curve rises more slowly, and the peak shifts more significantly, with peak values increasingly lower than those of normal individuals. The function of pancreatic beta cells will gradually decline, eventually rendering treatment with sulfonylureas and other secretagogues ineffective, which is characteristic of typical type 2 diabetes.
To facilitate communication among laboratory professionals across the country, we have specially established a national communication group for laboratory medicine. You are welcome to join us, to converse with experts and share experiences and insights!Due to the limitation of WeChat groups to 200 members,everyone can add the editor’s personal WeChat, and the editor will invite you to join the group.
Goodies are here! Click the bottom left “Read Original” to participate in the prize survey; we will randomly select lucky readers to receive exquisite gifts!

Click the card below for more information on laboratory medicine and in vitro diagnostics↓↓↓
Source:Medical Community Endocrinology ChannelEditor: yeah Review: Xiao Ran