Aging Kinetics Modeling of Cylindrical Lithium-Ion Batteries Due to the Evolution of the Solid Electrolyte Interphase (SEI) Layer
Abstract
w
The solid electrolyte interphase (SEI) layer plays a critical role in the aging and degradation processes of lithium-ion batteries (LIB), directly affecting the performance and lifespan of the battery. This paper proposes a physics-based model that quantitatively characterizes the growth process of the SEI layer in cylindrical LIBs by using ion current density as a control parameter. The method captures the local dynamic changes of the SEI layer by coupling state space equations (SSE) within a convex optimization framework. The model considers both the uniform growth phase and the nonlinear growth phase of the SEI layer, predicting capacity decay and impedance evolution during cycling aging. Validation against experimental charge-discharge curves, electrochemical impedance spectroscopy (EIS) characterization, and equivalent circuit modeling (ECM) results shows that the model has high accuracy in tracking SEI-related degradation processes. The proposed framework provides a robust, interpretable, and computationally efficient tool for battery diagnostics and lifespan prediction.
Method
w
The core mechanism for achieving charge-discharge cycles in lithium-ion batteries (LIB) is the migration of lithium ions (Li⁺) between electrodes. Figure 1 shows the physical structure of a typical wound (jelly-roll) LIB, which mainly consists of a cathode, an anode, and a separator (a porous membrane that allows Li⁺ to flow but blocks electrons). The electrolyte is composed of solvent and dissolved electrolyte salts, serving as the medium for Li⁺ migration. Ideally, the electrolyte should only facilitate ionic transport without reacting with the electrode materials to ensure that the Li⁺ concentration and potential gradient remain stable over time. However, when voltage is applied, the electrolyte is not chemically inert: during charging, the electrolyte undergoes reduction decomposition at the anode; conversely, during discharging, the electrolyte is prone to oxidation decomposition at the cathode [10-12]. In this case, the SEI layer forms at the interface between the electrode and the electrolyte. An et al. pointed out in reference [13] that the SEI layer is crucial for preventing direct contact between the electrode and the electrolyte—if they come into direct contact, harmful side reactions such as lithium plating, gas generation, and electrolyte decomposition may occur. However, as the thickness of the SEI layer increases, the available Li⁺ in the electrolyte decreases, leading to a decline in battery capacity; furthermore, the expansion of the SEI layer may adversely affect the efficiency and safety of the battery [14].
A key parameter for tracking the growth of the SEI layer during aging is the ion current density J, which describes the rate of flow of Li⁺ in the electrolyte. In the traditional Doyle-Fuller-Newman (DFN) model framework, this variable can be quantified using the Nernst-Planck equation (NPE), but it does not consider the growth of the SEI layer [8]. To appropriately modify the Nernst-Planck equation, it is necessary to determine the growth rate of the SEI layer, which is the core challenge of quantifying the thickness of the SEI layer (denoted as d_SEI).
Reviewing non-aging modeling methods [1,2,15], the growth of the SEI layer during a single charge-discharge process is often negligible. Therefore, to simplify the model and improve computational efficiency, it is assumed that the SEI layer grows uniformly on the electrode surface, adopting a “layered modeling” approach rather than a “particle-based modeling” approach. This assumption is widely accepted by multiphysics modeling tools such as COMSOL and Ansys, as layered analysis can simplify the optimization process into low-order linear calculations at a lower cost. However, as the SEI layer thickens to a certain extent, the electrode surface becomes increasingly rough (as shown in Figure 1); this roughness increases the number of nucleation sites on the electrode surface, further exacerbating particle agglomeration (such as lithium oxide or ethylene carbonate carbides), thereby catalyzing the non-uniform formation of the SEI layer [14,16-20].
In the proposed model, the formation of the SEI layer follows a two-stage evolution process:
1. Initial uniform accumulation phase: The SEI layer begins to form from the first charge-discharge cycle and grows relatively uniformly on the electrode surface;
2. Nonlinear maturation phase: Due to particle agglomeration and differences in local reaction intensity, the growth rate of the SEI layer exhibits spatial dependence.
The uniform accumulation phase is characterized by a constant growth coefficient SEI_α, assuming that the thickness of the SEI layer grows proportionally over time. This assumption is well-supported in the early stages of aging—at this point, the electrode surface remains relatively smooth, and the diffusion process of Li⁺ is nearly uniform. As the SEI layer thickens, morphological changes such as surface roughness and the formation of secondary reaction sites begin to dominate, causing the growth of the SEI layer to deviate from linearity.
To quantitatively capture the transition from “uniform growth” to “nonlinear growth,” the thickness of the SEI layer is described by equation (1):
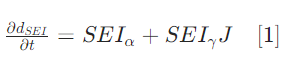
Where SEI_γ is the growth rate coefficient related to the ion current density, used to describe the dynamic coupling between ion current density J and the evolution of the SEI layer. It should be noted that the unit of SEI_γ is m³/(A・s), indicating that this growth rate is directly proportional to the amount of flow per unit time per unit ampere of current. As the SEI layer enters the maturation phase, particle agglomeration alters the electrochemical distribution by forming high ion flux regions, leading to non-uniform thickening of the SEI layer; this effect is incorporated into the optimization framework by dynamically updating the state space equation (SSE) controlling d_SEI.
Differentiating between the “accumulation phase” and the “maturation phase” is crucial for accurately predicting battery aging, and determining the transition moment between the two phases is the core task. Experimental evidence shows that when the growth rate of the SEI layer deviates from the initial linear trend, its growth kinetics change—this transition is associated with increased impedance and thickening of the SEI layer. Previous studies have observed that this transition occurs when the thickness of the SEI layer exceeds a critical value or when the charge transfer resistance increases to a threshold [4,14,22,23]; correspondingly, the slope of the Nyquist plot may reflect this change, suggesting that the growth of the SEI layer may transition from a uniform state to a non-uniform state influenced by local ion flux and surface roughness.
The proposed model can simulate the EIS spectrum of each cycle based on the inherent physical characteristics of the battery and actively track the slope of the Nyquist plot. When a significant deviation in slope is detected, the model updates the battery aging state (reflecting the SEI layer entering the maturation phase) to achieve the transition of growth phases.
Visual Overview
w
Figure 1: Cross-sectional view of a wound LIB (including SEI formation)
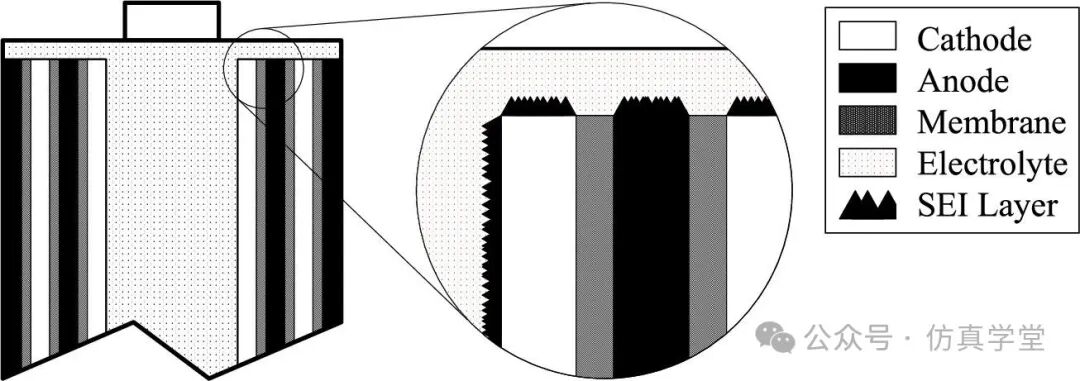 The cross-sectional structure of a wound lithium-ion battery clearly labels the five core components: cathode, anode, membrane, SEI layer, and electrolyte. Among them, the separator is a porous structure, whose core function is to “allow Li⁺ to pass but block electrons,” ensuring the separation of ionic conduction and electronic insulation; the electrolyte is composed of solvent and dissolved electrolyte salts, serving as the medium for Li⁺ migration between the positive and negative electrodes. The figure emphasizes the formation scenario of the SEI layer: when voltage is applied to the battery, the electrolyte undergoes oxidation/reduction decomposition at the positive and negative electrodes, respectively, leading to the generation of the SEI layer at the electrode-electrolyte interface; simultaneously, the figure also suggests the chain effects after the thickening of the SEI layer—surface roughness increases → more nucleation sites → exacerbated particle agglomeration → non-uniform growth of the SEI layer, providing structural support for the subsequent model’s “two-stage growth” assumption.
Figure 2: Flowchart of the SEI layer growth model (considering thickness evolution in the modified NPE)
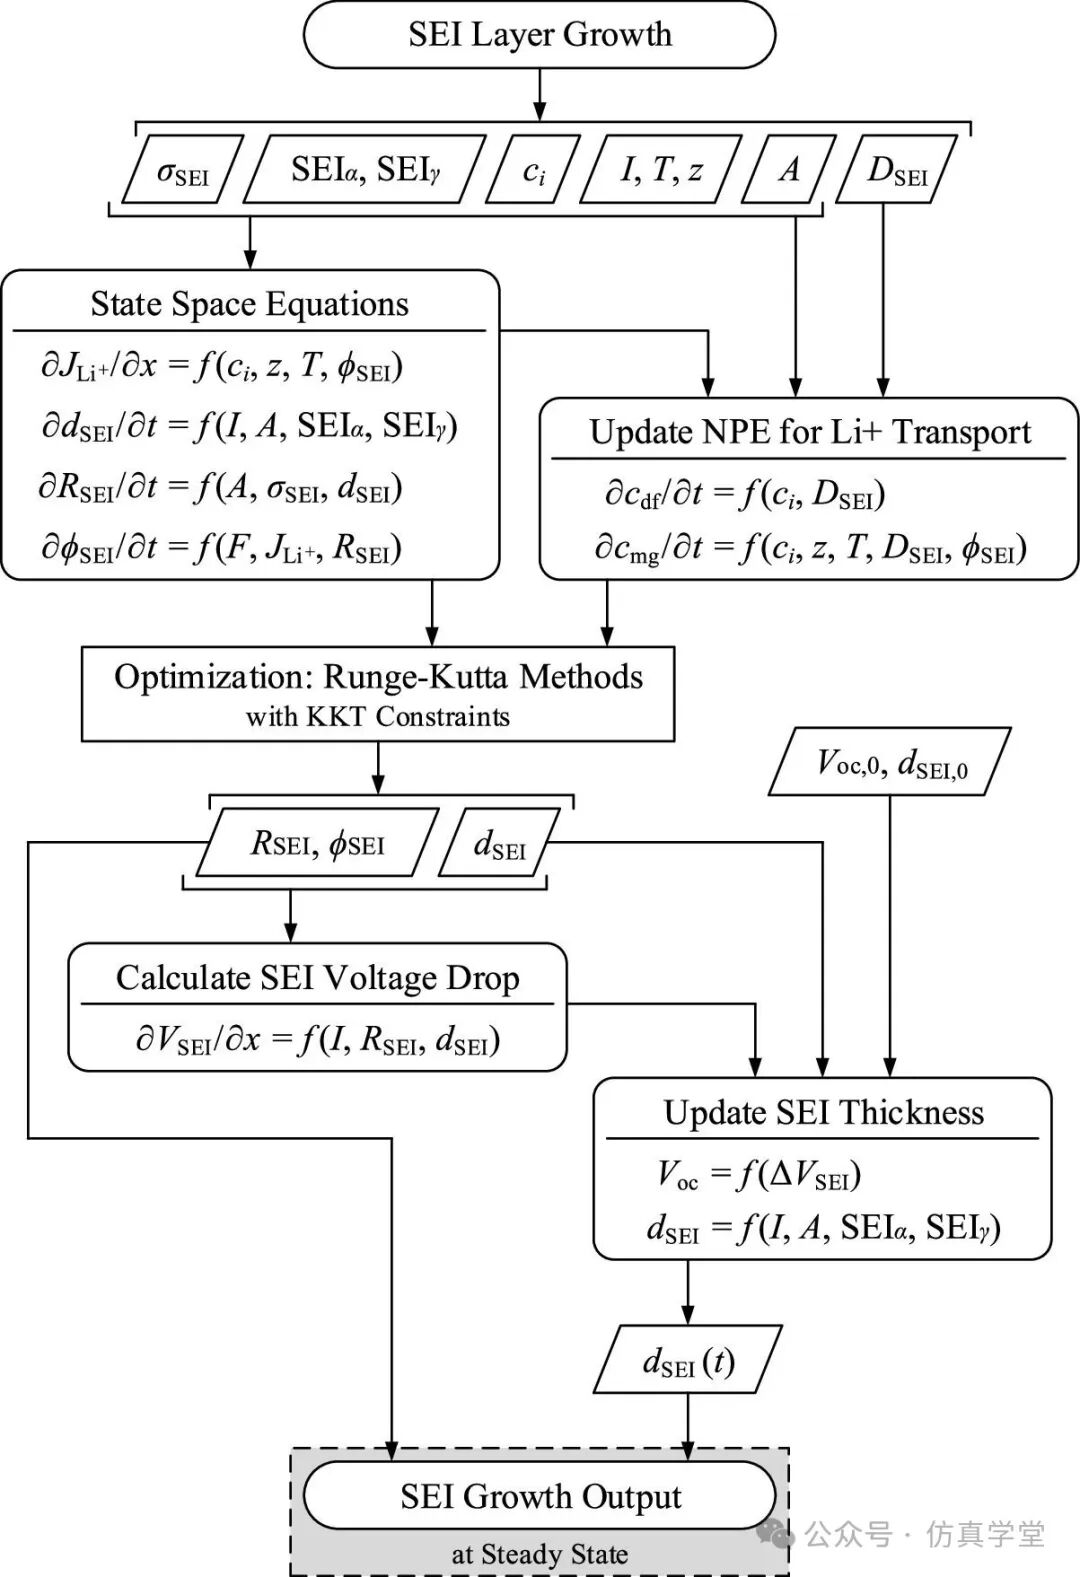 The core logic and computational link of the SEI layer growth model, centered around the “modified Nernst-Planck equation (NPE),” connects four major steps: “parameter input – equation calculation – optimization validation – result output.” Specifically, the model first inputs initial parameters (such as initial open-circuit voltage V_OC,0, initial SEI thickness d_SEI,0) to quantify the rate of change of key variables such as Li⁺ concentration (c_Li⁺), SEI resistance (R_SEI), and SEI conductivity (σ_SEI) through the state space equation; then, optimization is performed based on the Runge-Kutta method and Karush-Kuhn-Tucker (KKT) constraints to ensure that the predicted results comply with physical laws; subsequently, the SEI voltage drop calculation (based on Ohm’s law) is used to backtrack the update of SEI thickness; finally, the steady-state SEI growth results are output. The entire process achieves a closed loop of “physical parameters → mathematical equations → optimization validation → dynamic updates,” reflecting the model’s core characteristics of being “physics-based and quantitatively controllable.”
Figure 3: Validation of charging voltage curve for LG INR-18650 MJ1 battery (compared with UHL experimental data)
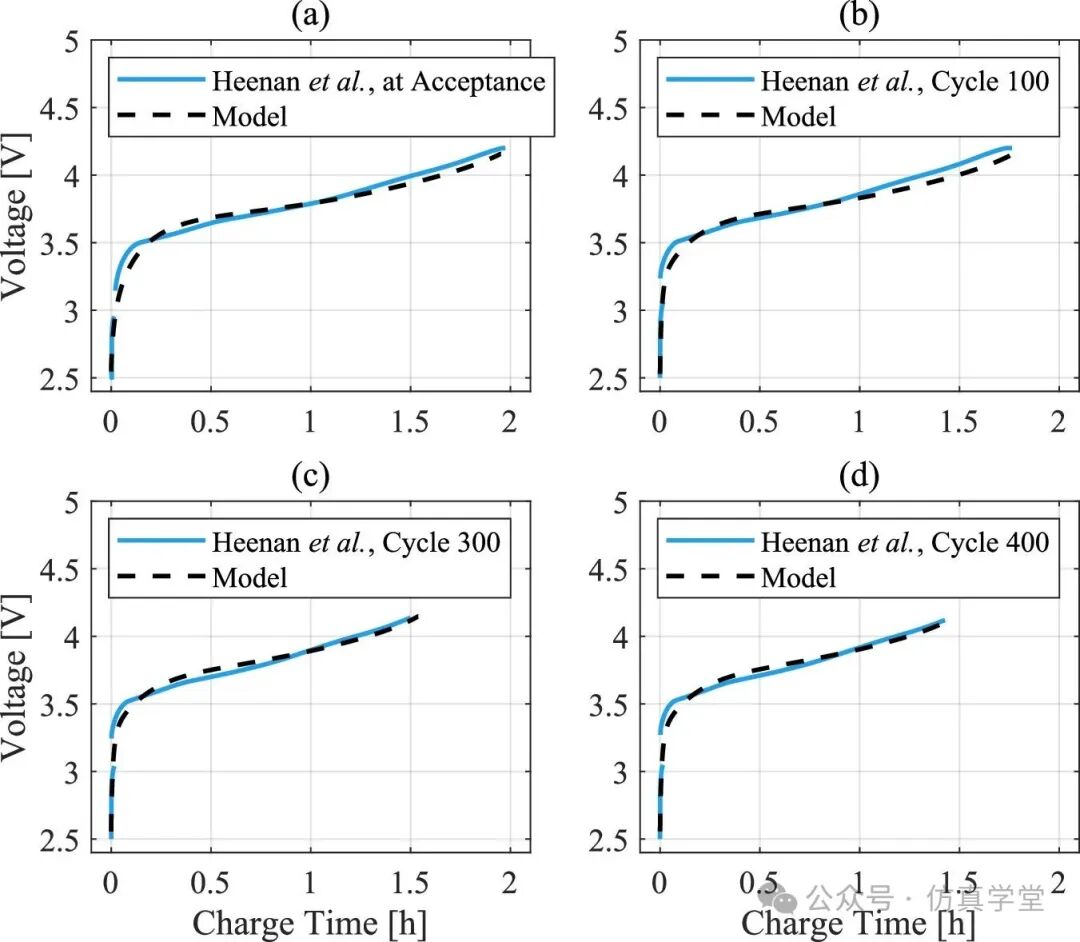 Four sub-figures (at acceptance, 100 cycles, 300 cycles, 400 cycles) compare the charging voltage curves simulated by the model for the LG INR-18650 MJ1 battery with publicly available experimental data from Heenan et al. (UHL team) [29,33]. The experiment used a constant current constant voltage (CCCV) charging scheme (1.5A current) at an ambient temperature of 24°C. The results show that the model curve matches the experimental curve very closely across the entire cycling range, especially the voltage plateau and slope changes during the charging phase, accurately capturing the characteristic of “gradually flattening charging voltage gradient” during aging (consistent with the conclusion in references [4,5] that “aging batteries have a flatter charging curve”). This figure directly validates the model’s accuracy in “predicting SEI-related voltage changes during the charging process.”Figure 4: Validation of discharge voltage curve for LG INR-18650 MJ1 battery (compared with UHL experimental data)
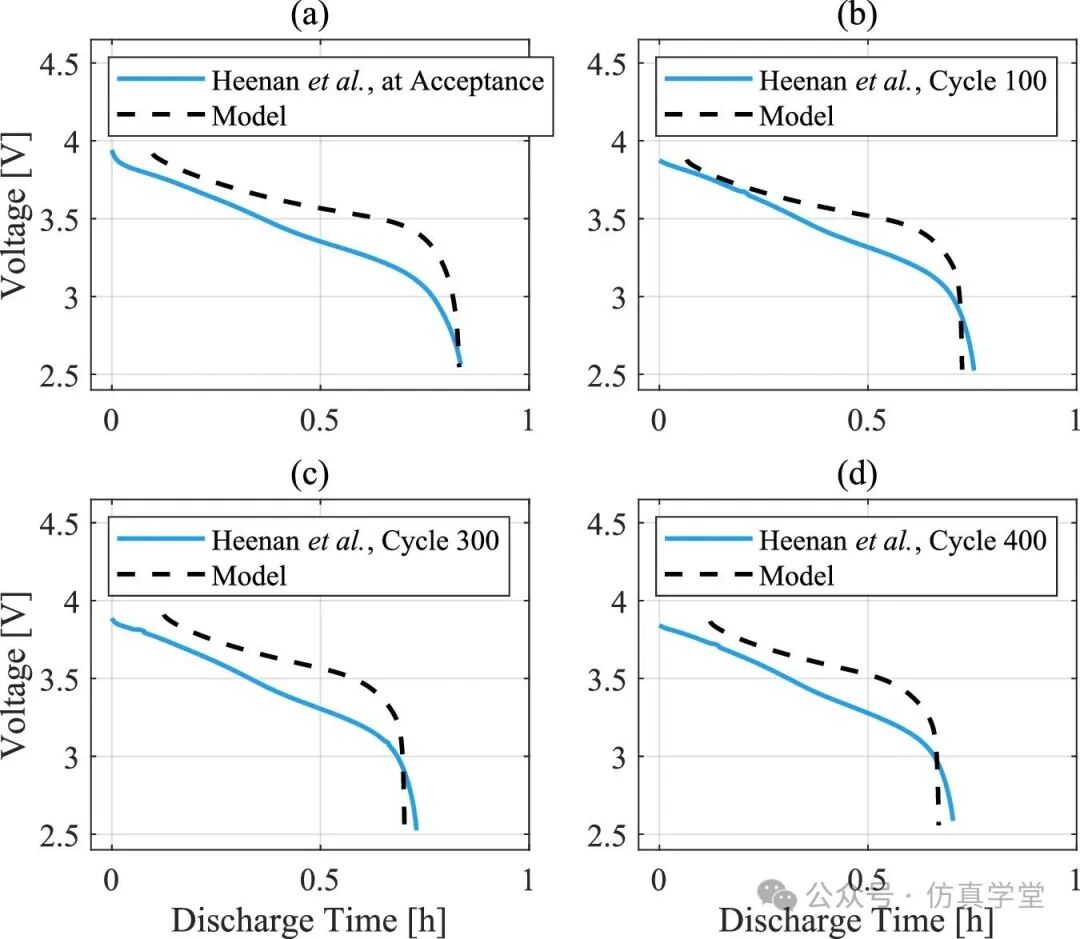 This figure corresponds to Figure 3, comparing the discharge voltage curves simulated by the model with experimental data (discharge current of 4A). The results show that despite some minor differences (due to two major effects at high discharge currents: ohmic heating (I²R) and uneven Li⁺ transport caused by rapid electrolyte consumption [43-45]), the overall trend of the model curve is completely consistent with the experimental curve, successfully capturing the core characteristics of “lower discharge voltage plateau and steeper discharge curve” during aging (consistent with the conclusion in references [4,5] that “aging batteries have a steeper discharge curve”). Additionally, the brief stable interval between charge and discharge in the experimental data was not explicitly simulated by the model, but this detail does not affect the long-term aging trend prediction, further proving the model’s practicality.Figure 5: Model prediction of aging behavior for LG INR-18650 MJ1 battery (capacity decay and charge-discharge curve differences)
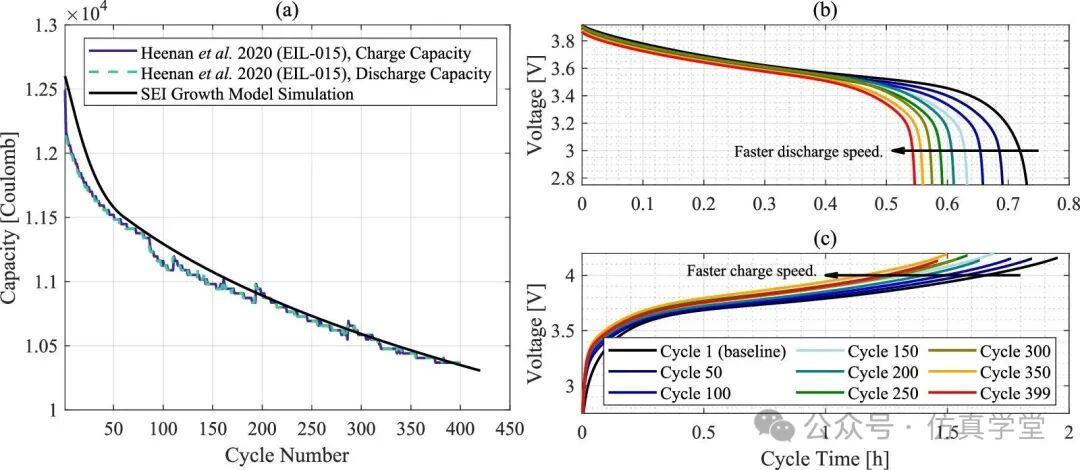 From the perspectives of “capacity decay” and “dynamic changes in charge-discharge curves,” the model’s predictive capability for battery aging behavior is demonstrated.
-
Sub-figure (a): Comparison of model predictions with experimental capacity decay curves (experimental data includes charging capacity and discharging capacity, both overlapping), showing that the battery state of health (SoH) drops to 82.45% after 400 cycles, with a high degree of agreement; only a slight difference exists in the first 1-2 cycles (the experiment showed a 2.5% nonlinear capacity drop that the model did not reflect), which is due to the randomness of the rapid formation of the SEI layer in the early stages of the experiment, but does not affect long-term predictions.
-
Sub-figures (b)(c): Record the charge-discharge curves every 50 cycles starting from cycle 1 (baseline), clearly showing key patterns during the aging process—accelerated discharge speed (figure b), accelerated charging speed (figure c), which completely aligns with the experimental conclusions in references [4,5,50-52], proving that the model can accurately capture the impact of SEI layer growth on the dynamic response of the battery.
Figure 6: Validation of EIS curves for LG INR-18650 MJ1 battery (compared with NASA experimental data)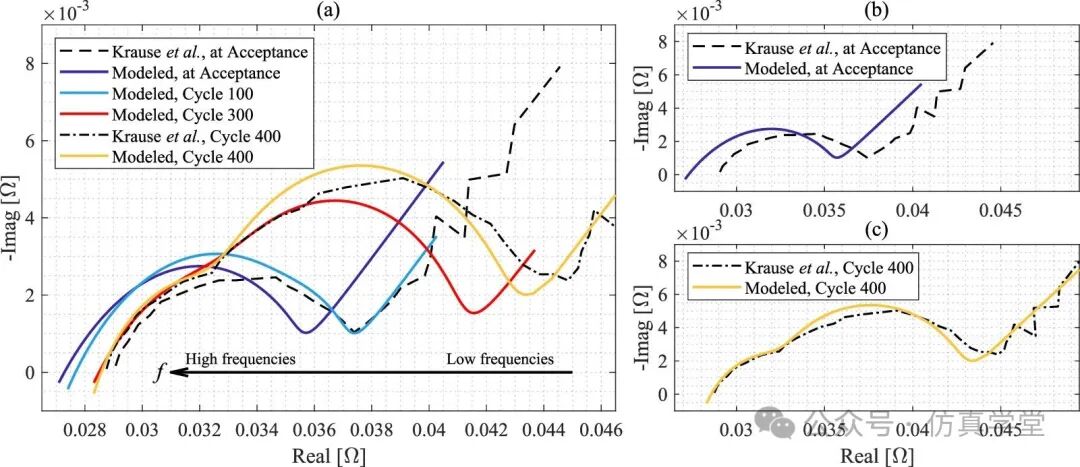 Through three sub-figures, the EIS curves characterized by the model are compared with publicly available NASA experimental data [34,35] (the experiment used C/50 charging and C/5 discharging, cycling over 900 times), which is the core validation of the model’s “electrochemical impedance prediction capability.”
-
Sub-figures (a)(b): EIS comparison at acceptance state, the model-predicted ohmic resistance R_ohmic is 23.0mΩ (consistent with battery specifications of ≤40mΩ [31]), while the experimental value is about 29.2mΩ, with the difference arising from different measurement methods (the R_ohmic range measured by different teams is 20-40mΩ [53-57]), but the shape and trend of the EIS arc are completely consistent.
-
Sub-figure (c): EIS comparison at 400 cycles, showing a very high degree of agreement with NASA data; simultaneously, the appearance of a “second arc” in the EIS after 300 cycles indicates a change in the charge transfer process [55,58], which is precisely captured by the model, reflecting the physical essence of “decreased ion transport efficiency and increased charge transfer resistance” after the SEI layer matures.
Overall, this figure demonstrates that the model can accurately predict key changes in EIS during aging (increased ohmic resistance, expanded EIS arc, appearance of secondary arc), providing a quantitative tool for the electrochemical characterization of SEI layer degradation.
Figure 7: Evolution of key components (C_SEI, R_SEI, R_ohmic) predicted by the model over cycles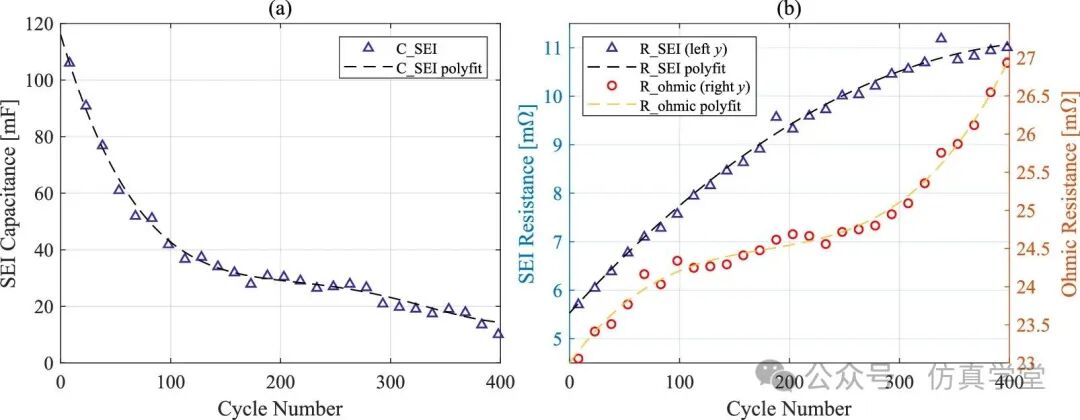 This figure extends Figure 6, quantifying the impact of SEI layer growth on battery parameters from the perspective of “equivalent circuit components,” including two sub-figures:
-
Sub-figure (a): Evolution of SEI capacitance (C_SEI) over cycles, showing a rapid decline in C_SEI during the early aging stage (first 100 cycles), followed by a gradual decrease in the slope. This is because the rapid formation and thickening of the SEI layer in the early stage significantly reduce the charge accumulation capacity at the electrode-electrolyte interface; in the later stage, the growth of the SEI layer stabilizes, and changes in C_SEI tend to flatten.
-
Sub-figure (b): Evolution of SEI resistance (R_SEI, left y-axis) and ohmic resistance (R_ohmic, right y-axis) over cycles, showing a rapid increase in early R_SEI (due to SEI layer thickening and electrode particle agglomeration, Li⁺ consumption), while R_ohmic increases slowly (due to electrode/electrolyte degradation); in the later stage, the slopes of both increase gradually, reflecting that the growth of the SEI layer enters a stable phase, and changes in the battery’s electrochemical characteristics tend to stabilize.
This figure reveals the dynamic rules of SEI layer growth from the dual dimensions of “capacitance-resistance,” providing direct parameter support for the quantitative assessment of battery state of health (SoH).
Conclusion
w
This paper, published in the Journal of The Electrochemical Society, Volume 172, Issue 030508 in 2025, focuses on the aging issues of cylindrical lithium-ion batteries (LIB) due to the evolution of the solid electrolyte interphase (SEI) layer, proposing a physics-based model based on a 2D Doyle-Fuller-Newman (DFN) framework. The core of the research lies in: using ion current density as a control parameter, coupling state space equations (SSE) into a convex optimization framework, and achieving the first quantitative modeling of the SEI layer’s “uniform accumulation phase” and “nonlinear maturation phase”; by modifying the Nernst-Planck equation (NPE) and considering the battery’s geometric structure (in-plane and out-of-plane directions), accurately capturing the non-uniform growth dynamics of the SEI layer.
To validate the model’s performance, the authors compared it with publicly available data from the LG INR-18650 MJ1 battery (400 cycles of charge-discharge curves, capacity decay data) and NASA’s EIS data, showing that the predicted charging and discharging voltage curves, capacity decay (SoH dropped to 82.45% after 400 cycles), and EIS curves (including the secondary arc in the later aging stage) closely match the experimental data; moreover, compared to machine learning models such as LSTM and GPR, this model does not require training data, has stronger physical interpretability (directly relating ion current density to SEI growth), and has moderate computational costs (supporting parallel computation).
Future work will further expand the model’s capabilities: incorporating temperature-dependent ion transport, thermal generation, and other thermodynamic factors; optimizing computational efficiency to support large-scale simulations; deepening aging modeling to the deep aging stage at a state of health (SoH) of 60%; and integrating thermal management modules to assess battery safety. This paper provides a “physically precise, experimentally verifiable” new tool for aging diagnostics and lifespan prediction of lithium-ion batteries, with significant application value in battery health management for electric vehicles, energy storage systems, and other fields.
Original Link
DOI 10.1149/1945-7111/adba91

Academic Exchange Group
Academic Exchange
