
Segger provides ST examples that are debugged using J-Link. But what if we only have the ST-Link emulator? In this article, we will introduce how to debug using ST-Link in Segger Embedded Studio.
Operating Environment
1. Embedded Studio for ARM v4.5
2. ST Nucleo-L476RG board
Setting Up ST-Link in Embedded Studio for ARM
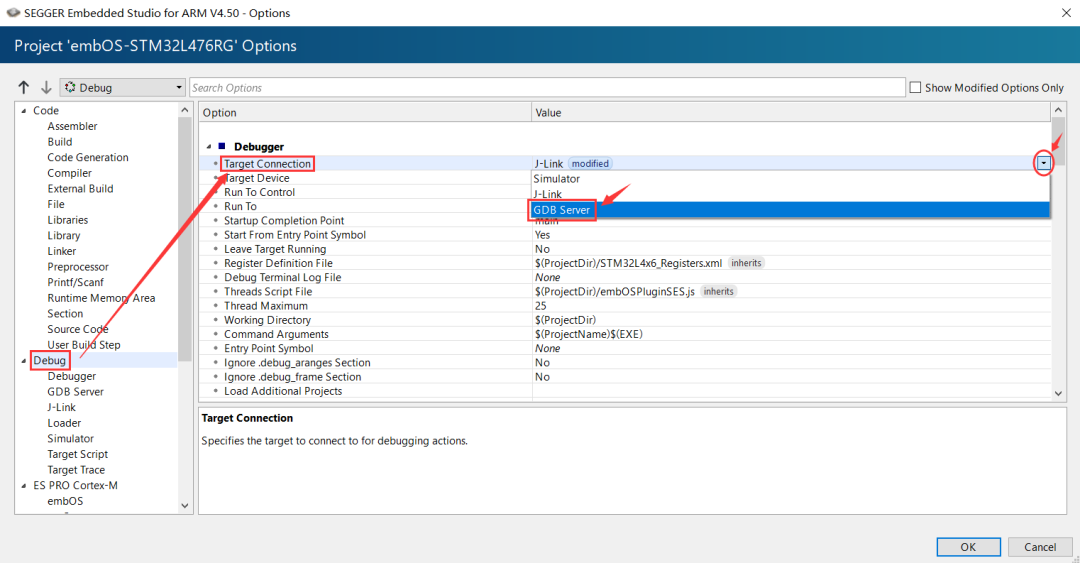
We are using the emBOS-STM32L476RG project provided by Segger.
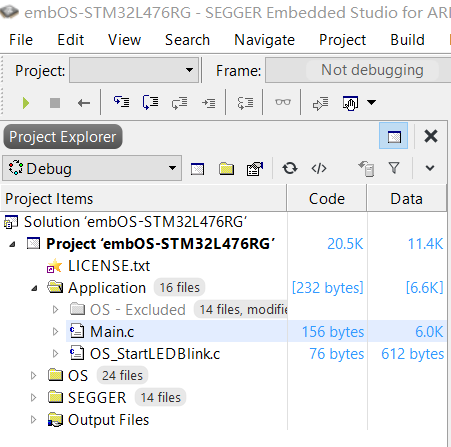
Right-click on the project and select Options.
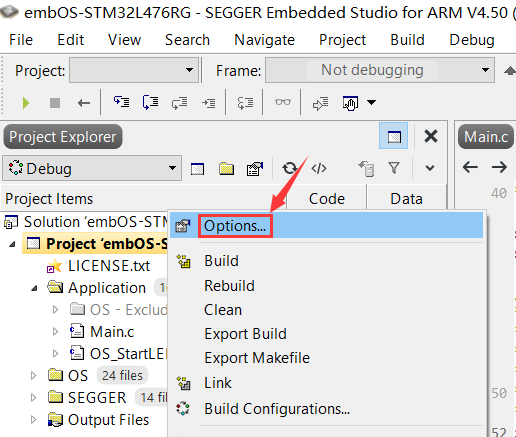
Select Debug->Debugger->Target Connection, click on the rightmost side to bring up a dropdown checkbox, select GDB Server.
Then on the left side, select GDB Server->Type, click on the rightmost side to bring up a dropdown checkbox, and select ST-Link.
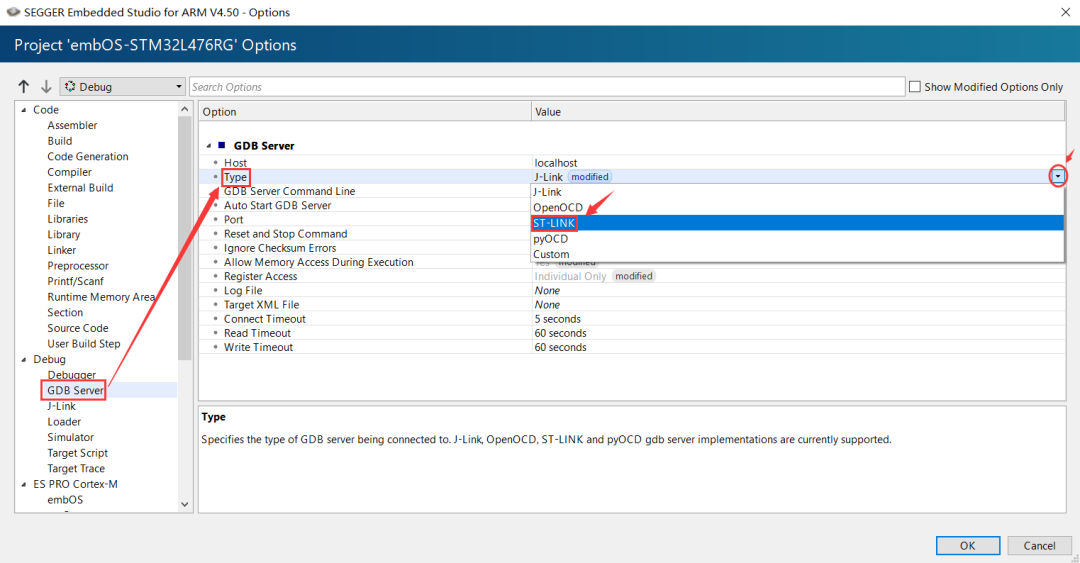
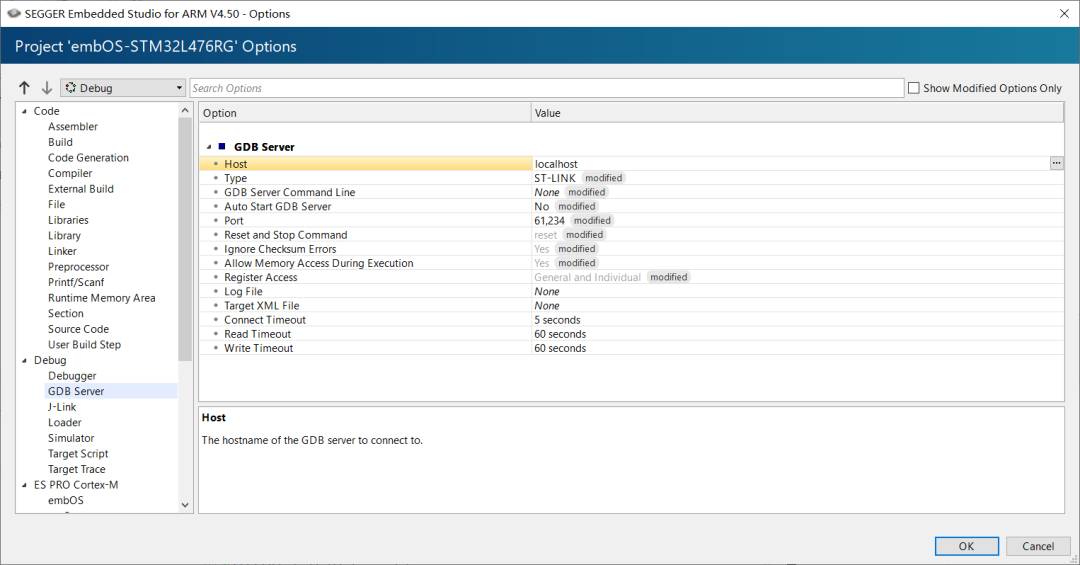
Other options can be left as default, click OK to save.
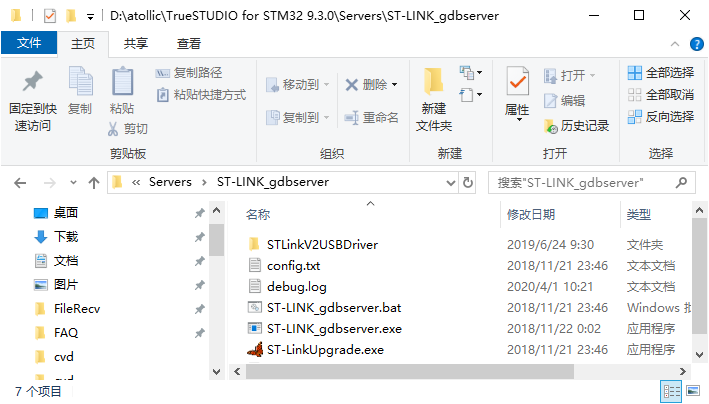
Start GDBserver, we are using the ST-Link GDB Server in TrueSTUDIO for STM32 9.3.0. Before debugging, run D:\atollic\TrueSTUDIO for STM32 9.3.0\Servers\ST-LINK_gdbserver\ ST-LINK_gdbserver.bat.
(Note:Atollic is a Swedish embedded software tool development company, which has been acquired by ST. Its embedded development environment is TrueSTUDIO. We need to use the gdbserver software that supports ST-Link, so we need to download and install TrueSTUDIO from the link https://atollic.com/truestudio.)
The running result is shown below:
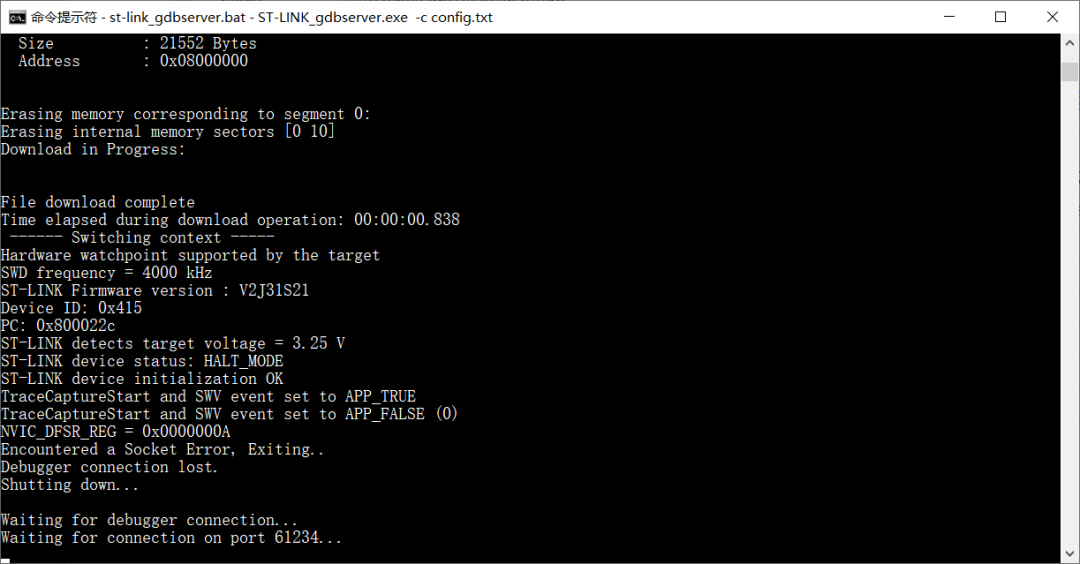
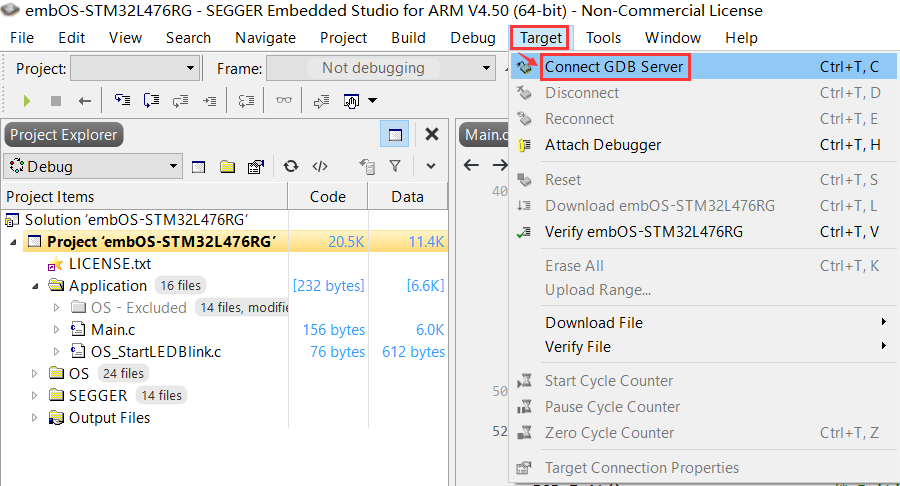
Now, select Target->Connect GDB Server from the main menu of Embedded Studio.
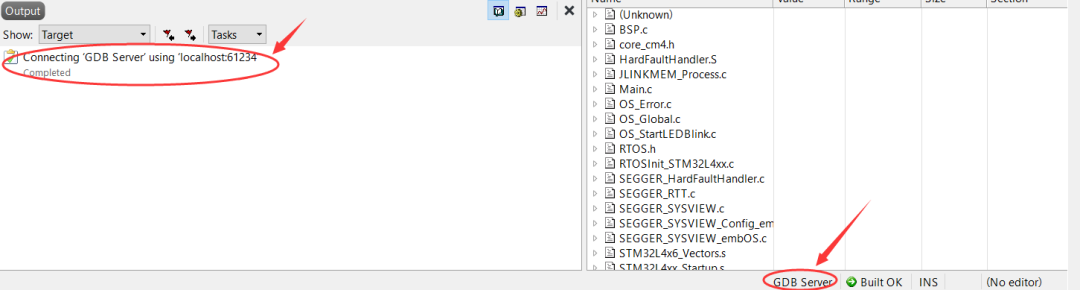
At this point, we can see in the OUTPUT window of the IDE that the GDB Server connection is complete, and a GDB Server is displayed on the bottom right prompt bar.
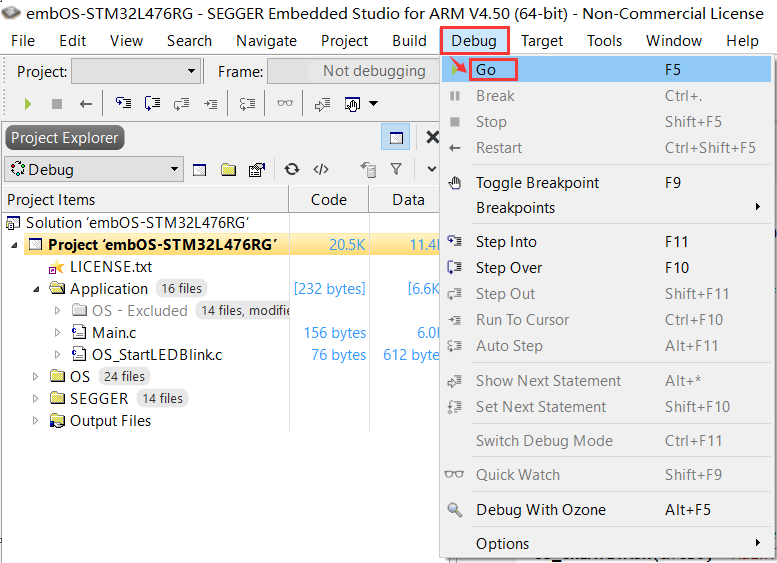
Now, select Debug->Go from the main menu.
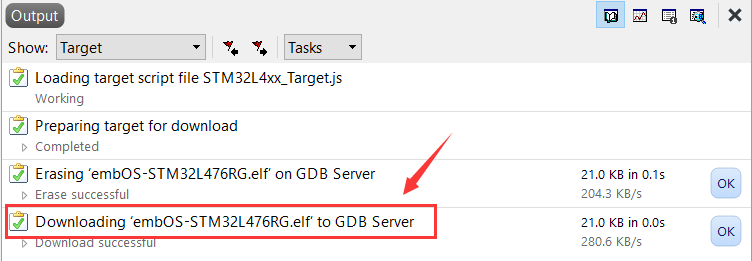
In the Output window, you can see the download information as shown below:
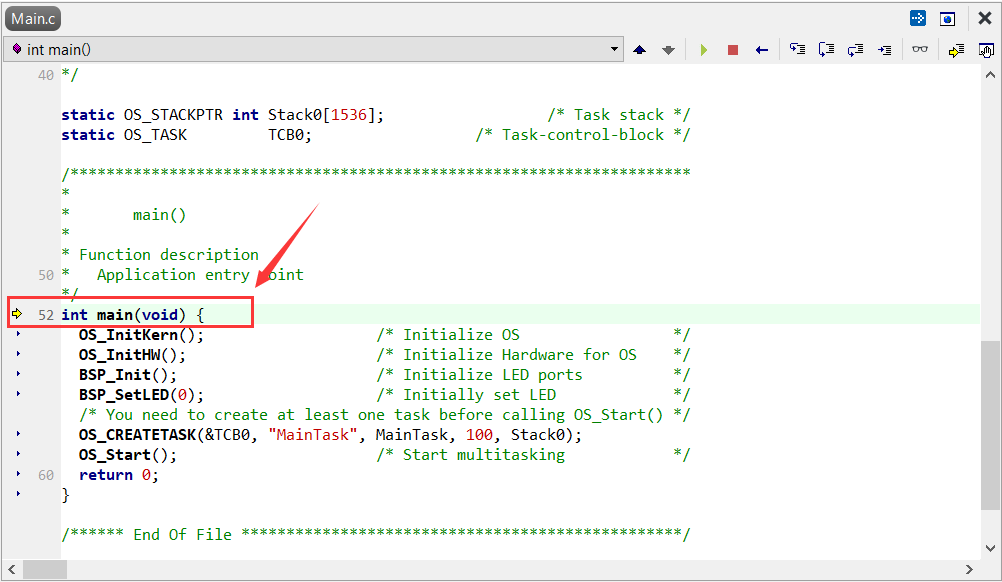
We see that the program stops at the Main function, and we can start debugging.
Conclusion
Many ST development boards do not provide JTAG or SWD interfaces, only providing onboard ST-Link. This method allows for easy ST-Link debugging in Segger Embedded Studio.
Product Consultation:
Beijing: 010-62975900
Shanghai: 021-62127690
Shenzhen: 0755-82977971


Share, View, and Like, at least I want to have one.