Website: bbs.21ic.com
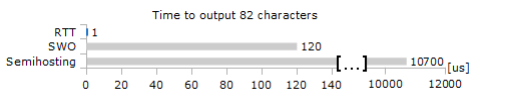 3> Communication via RTT can be accomplished through different applications, can be integrated into custom applications using SDK, and can be connected locally or remotely. Based on these three advantages, if you are still foolishly using USART for user interaction when debugging ARM chips, that is indeed very inefficient. 3. Preparation for using Jlink RTT 1> Jlink software packagehttps://www.segger.com/downloads/jlink/#J-LinkSoftwareAndDocumentationPack
 2> One Jlink emulator; I couldn’t find which version of the Jlink officially starts supporting RTT, but I saw online that V9 is supported. I am using Jlink V11 emulator here. HW: V11.00 dll: V6.98c 4. Porting RTT SDK code to MDK work 1> Find the RTT SDK package in the installation path of the Jlink software; I installed it on drive D. D:\Program Files (x86)\SEGGER\JLink\Samples\RTT\RTT
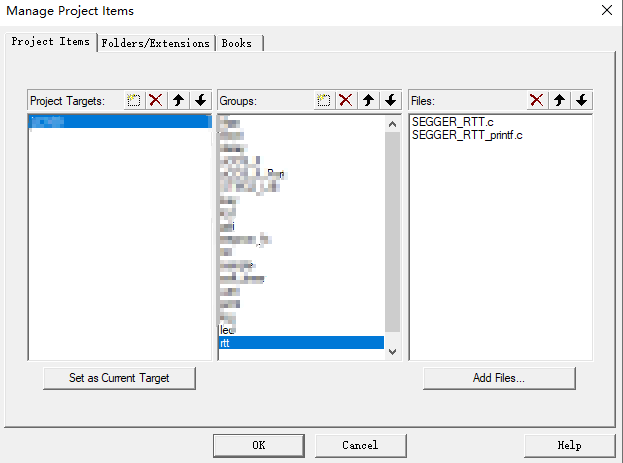
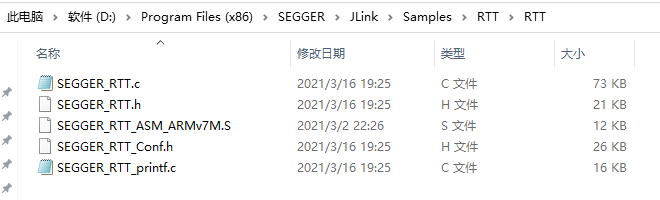 2> Create a new RTT folder under the MDK project, copy the following four files to the RTT directory, and add these files to the MDK project.
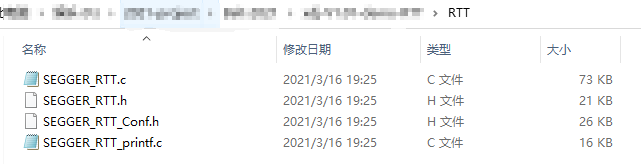 Add the code to the project
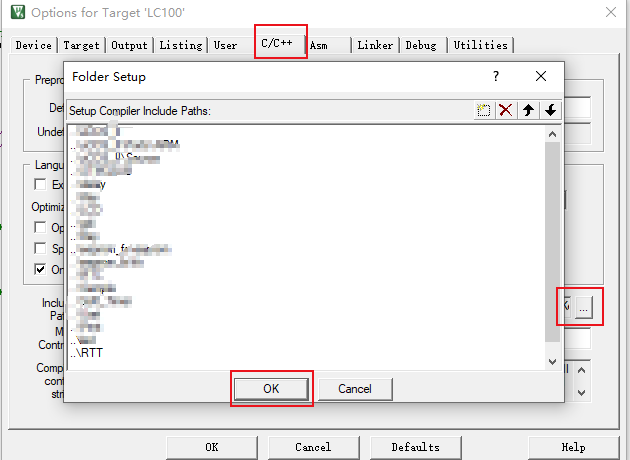
 Header file includes
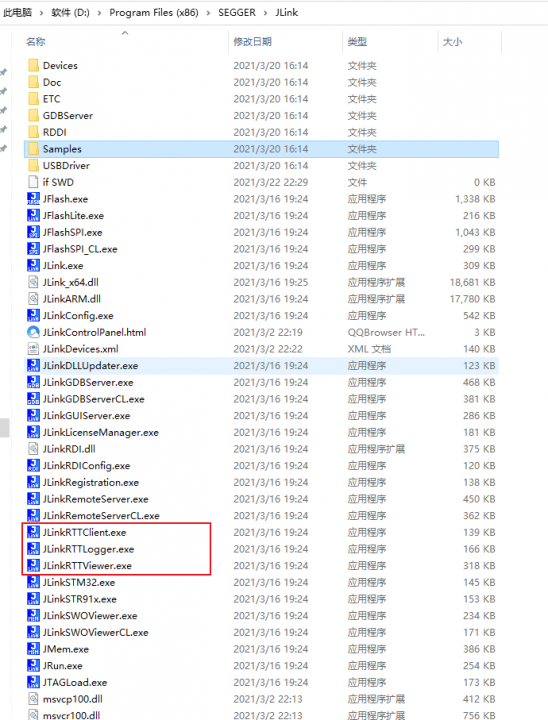
 5. Three software that support RTT Jlink provides three software: RTT Viewer, RTT Client, and RTT Logger. These three software can be found in the SEGGER directory:
 6. Some concepts to understand before using RTT. Using RTT requires understanding two concepts, namely channel and terminal. Here I have only provided an explanation based on my current understanding, which may not be appropriate. Since there is no detailed explanation of the internal operating mechanism of RTT, I understand channel and terminals as software concepts. The RTT SDK defaults to support 2 channels, namely 0 and 1. Each channel supports 16 terminals, respectively 0-F. Based on these two concepts, I have created a comparison table for the three software: RTT Viewer, RTT Client, and RTT Logger. Understanding the table below will help you better use and configure RTT.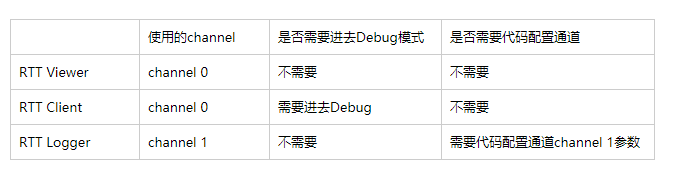
192066059fc21abc0a.png (19.17 KB, download times: 0)
Download attachment Save to album
Uploaded on 2021-3-23 22:33
7. Code writing in MDK 1> Header file reference #include “SEGGER_RTT.h” 2> RTT initialization function SEGGER_RTT_Init(); The above two items are common code, and below is the use of channel 0 to output a segment of debugging information using RTT Viewer and RTT Client.
/**********************************************************************************************************                                                Main program*********************************************************************************************************/int main (void)                                                                                 {

  FLASH_ReadOutProtection(DISABLE);                                   //Read protection

    SystemInit();                                                                            //CPU clock initialization    NVIC_PriorityGroupConfig(NVIC_PriorityGroup_4);        //Use priority group 4 (4:4 structure)
    SEGGER_RTT_Init();
    #ifdef DEBUG_MODE                                                        //Debug mode    SEGGER_RTT_printf(0,"Demo Init!\r\n");    #endif

while(1){        SEGGER_RTT_SetTerminal(0);             SEGGER_RTT_printf(0,"Demo Run Terminal 0!\r\n");           SEGGER_RTT_SetTerminal(1);             SEGGER_RTT_printf(0,"Demo Run Terminal 1!\r\n");         }


  return (0);}
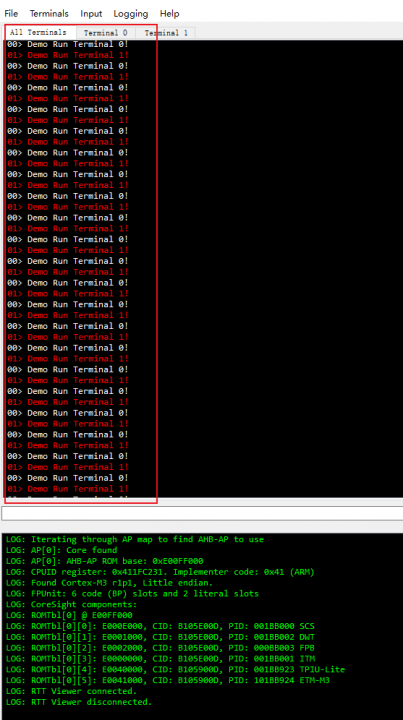
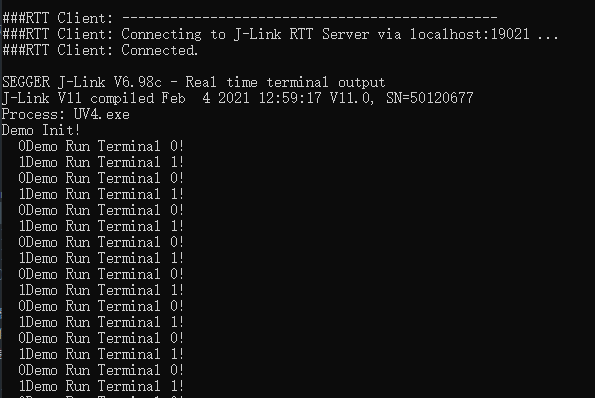
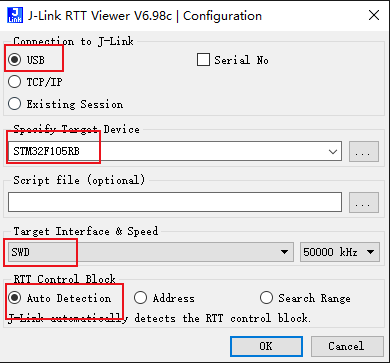 You can see that the control window has output debugging information. The number before > is the current terminal ID being used.
 After opening RTT Client, it displays as follows:
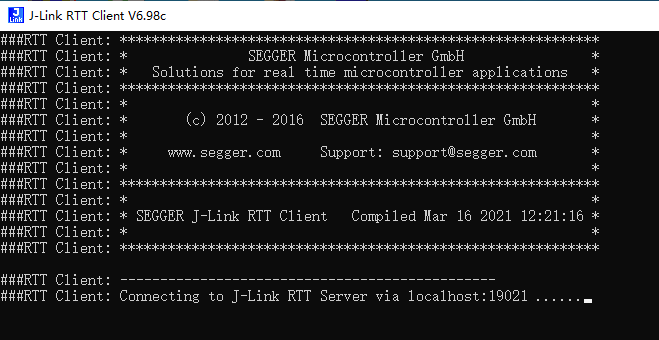 At this point, you will find that there is no data output. Don’t worry, the key point is coming. 1) First close RTT Client and click the Debug button in MDK to enter Debug mode.
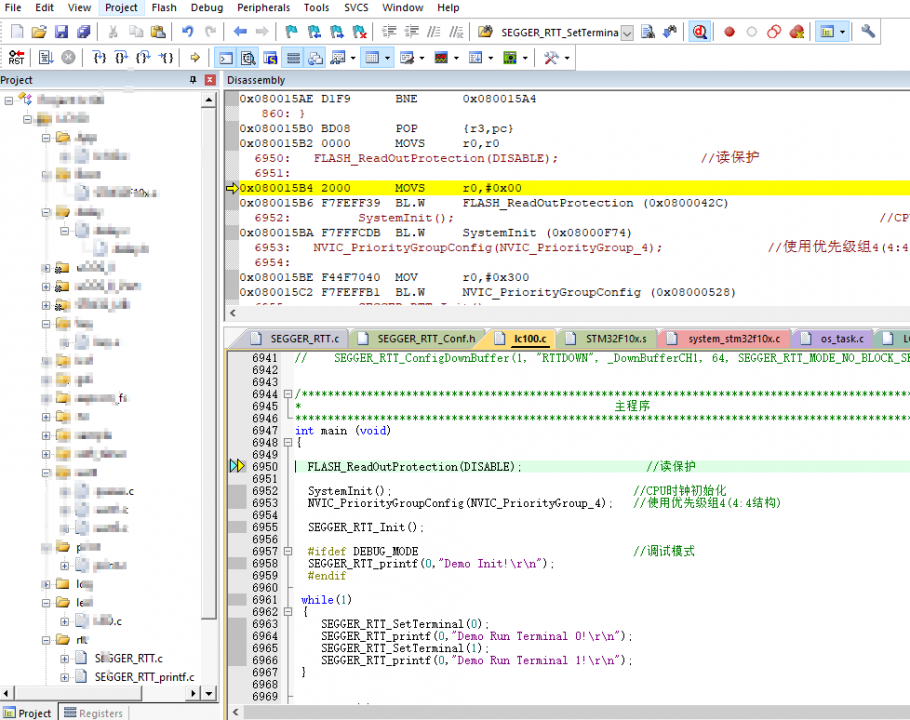 2) Reopen RTT Client, it displays as follows:
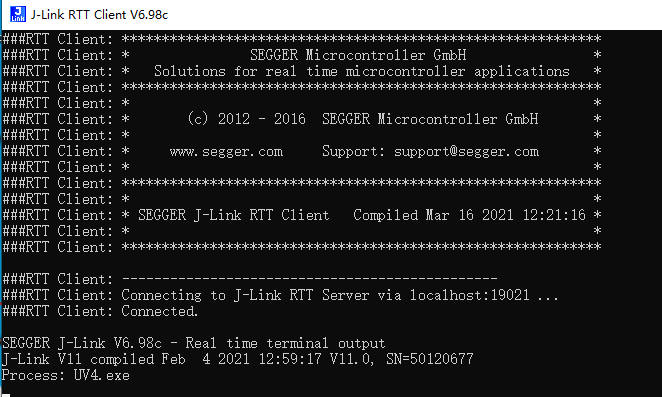 3) Click MDK’s Run to run at full speed. The console starts to output debugging information.
 Next, continue using channel 1 to output debugging information in the log file using RTT Logger. Since RTT Logger uses channel 1, the RTT SDK does not allocate a buffer and name for channel 1, and manual settings must be made. Also, note that channels 0 and 1 are parallel, and the output debugging information from both does not conflict. The code for using channel 1 is as follows:
uint8_t _UpBufferCH1[64] = {0};uint8_t _DownBufferCH1[64] = {0};
/********************************************************************************************************** Main program*********************************************************************************************************/int main (void) {
FLASH_ReadOutProtection(DISABLE); //Read protection
SystemInit(); //CPU clock initialization NVIC_PriorityGroupConfig(NVIC_PriorityGroup_4); //Use priority group 4 (4:4 structure)
SEGGER_RTT_Init();
/* Configure channel 1, uplink configuration (STM32->RTT Viewer software) */ SEGGER_RTT_ConfigUpBuffer(1, "RTTUP", _UpBufferCH1, 64, SEGGER_RTT_MODE_NO_BLOCK_SKIP);
/* Configure channel 1, downlink configuration (RTT Viewer software->STM32) */ SEGGER_RTT_ConfigDownBuffer(1, "RTTDOWN", _DownBufferCH1, 64, SEGGER_RTT_MODE_NO_BLOCK_SKIP);
#ifdef DEBUG_MODE //Debug mode SEGGER_RTT_printf(0,"Demo Init!\r\n"); #endif
while(1){ SEGGER_RTT_SetTerminal(0); SEGGER_RTT_printf(1,"Demo Run Terminal 0!\r\n"); SEGGER_RTT_SetTerminal(1); SEGGER_RTT_printf(1,"Demo Run Terminal 1!\r\n"); }
return (0);}
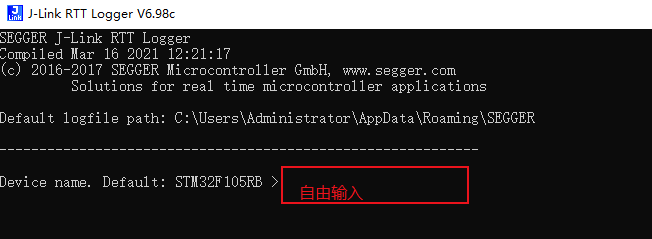 Here it should be noted that in RTT Logger, you can freely input the parameters indicated after > and confirm by pressing the Enter key. Without input, press the Enter key to skip.
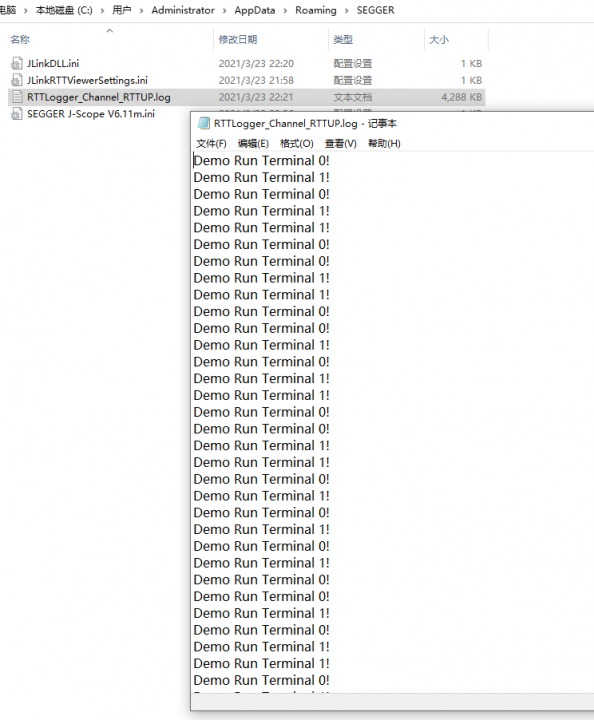
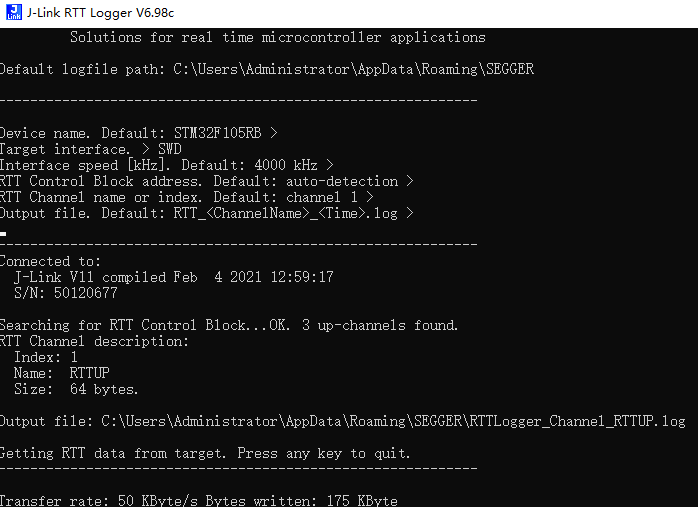 Open the .log file in the above path, and the content is as follows, which indicates that the log file has been successfully generated.
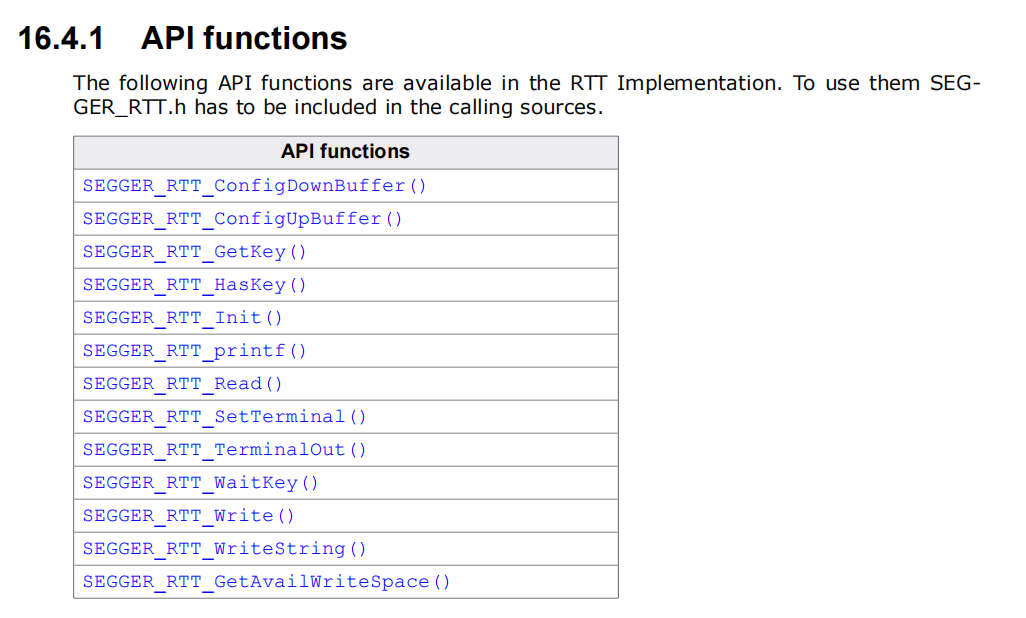
 As long as you understand the above content, you can smoothly use RTT to output debugging information. Generally, we only need to use the RTT Viewer software. It can also set display colors, format output, etc. The specific function descriptions can be found in the user manual in section 16.4.1 of the Jlink installation directory. The manual path is as follows: D:\Program Files (x86)\SEGGER\JLink\Doc\Manuals.