
About Reprint Authorization
This is a work from Big Data Digest. Individuals are welcome to share it in their social circles. Media and organizations must apply for authorization to reprint. Please leave a message with “Organization Name + Article Title + Reprint”. If you have already applied for authorization, there is no need to apply again, as long as you reprint according to the agreement. However, a QR code for Big Data Digest must be placed at the end of the article.
Compiled by: Xi Xiongfen
Proofread by: Huang Nian
Introduction
Recently, I learned some strategies from Sun Tzu (referring to “The Art of War” – translator’s note): speed and preparation.

Speed and Preparation
“The essence of military affairs is speed; take advantage of the enemy’s unpreparedness, attack where they are unguarded.” (“The Art of War, Chapter Nine”) Being unprepared is a major concern in warfare; being prepared is virtuous. (Haha, I wrote this sentence myself, I believe everyone can understand.)
What does this have to do with data science blogs? This is the key to winning competitions and programming marathons. If you are better prepared than your competitors, the faster you learn and iterate, the better your ranking and results will be.
Due to the increase in Python users in recent years and its inherent simplicity, this toolkit has become significant for Python experts in the data science world. This article will help you build your first predictive model faster and better. Most excellent data scientists and Kagglers build their first effective model and submit it quickly. This not only helps them lead the leaderboard but also provides a benchmark solution to the problem.

Decomposing the Predictive Model
I always focus on investing quality time in the initial stages of modeling, such as hypothesis generation, brainstorming, discussions, or understanding the possible range of outcomes. All these activities help me solve problems and ultimately allow me to design more robust business solutions. Why spend this time upfront? There are good reasons for it:
-
You have enough time to invest and you are inexperienced (this matters).
-
You are not biased by other data perspectives or ideas (I always recommend generating hypotheses before diving into the data).
-
In later stages, you will be eager to complete the project without the ability to invest quality time.
This stage requires high-quality time investment, so I haven’t mentioned a timeline, but I suggest you treat it as standard practice. This helps you build a better predictive model with less iterative work in later stages. Let’s look at the timeline for the remaining stages of building your first model:
-
Descriptive data analysis – 50% of the time
-
Data preprocessing (handling missing values and outliers) – 40% of the time
-
Data modeling – 4% of the time
-
Performance prediction – 6% of the time
Let’s go through each process step by step (investing time in predictions for each step):
Stage 1: Descriptive Analysis/Data Exploration
When I first started as a data scientist, data exploration took up a lot of my time. However, over time, I have automated a lot of data operations. Since data preparation accounts for 50% of the workload in building the first model, the benefits of automation are evident.
This is our first benchmark model, and we will omit any feature engineering. Therefore, the time required for descriptive analysis is limited to understanding missing values and directly visible large features. In my methodology, you will need 2 minutes to complete this step (assuming a dataset of 100,000 observations).
Actions performed by my first model:
-
Identify ID, input features, and target feature.
-
Identify categorical and numerical features.
-
Identify columns with missing values.
Stage 2: Data Preprocessing (Handling Missing Values)
There are many methods to address this issue. For our first model, we will focus on smart and quick techniques to build the first effective model.
-
Create a flag for missing values: sometimes missing values themselves carry a lot of information.
-
Fill missing values with mean, median, or other simple methods: mean and median filling perform well; most people prefer mean filling, but I recommend using median in cases of skewed distributions. Other smart methods are similar to mean and median filling, using other relevant features to fill or building models. For example, in the Titanic survival challenge, you can use the titles from passenger names, such as “Mr.”, “Miss.”, “Mrs.”, “Master”, to fill in missing ages, which has a good impact on model performance.
-
Fill missing categorical variables: create a new category to fill categorical variables, coding all missing values as a single value like “New_Cat”, or you can look at frequency combinations, using high-frequency categorical variables to fill missing values.
Since the data processing methods are so simple, you can take only 3 to 4 minutes to handle the data.
Stage 3: Data Modeling
Depending on the business problem, I recommend using either GBM or RandomForest techniques. Both techniques can be extremely effective in creating benchmark solutions. I have seen data scientists often use these two methods as their first model and also as their final model. This takes a maximum of 4 to 5 minutes.
Stage 4: Performance Prediction
There are various methods to validate your model’s performance. I recommend splitting your training dataset into a training set and a validation set (the ideal ratio is 70:30) and modeling on 70% of the training dataset. Now, use 30% of the validation dataset for cross-validation and evaluate performance using evaluation metrics. Finally, it takes 1 to 2 minutes to execute and record the results.
The purpose of this article is not to win competitions but to establish our own benchmark. Let’s execute the above steps with Python code to build your first impactful model.
Let’s Get Started
First, I assume you have done all the hypothesis generation and are proficient in basic data science operations in Python. I will illustrate with an example from a data science challenge. Let’s look at the structure:
Step 1: Import the required libraries, read the test and training datasets.
#Import pandas, numpy packages, import LabelEncoder, random, RandomForestClassifier, GradientBoostingClassifier functions
import pandas as pd
import numpy as np
from sklearn.preprocessing import LabelEncoder
import random
from sklearn.ensemble import RandomForestClassifier
from sklearn.ensemble import GradientBoostingClassifier
#Read training and testing datasets
train=pd.read_csv(‘C:/Users/AnalyticsVidhya/Desktop/challenge/Train.csv’)
test=pd.read_csv(‘C:/Users/AnalyticsVidhya/Desktop/challenge/Test.csv’)
#Create flags for training and testing datasets
train[‘Type’]=’Train’
test[‘Type’]=’Test’
fullData =pd.concat([train,test],axis=0) #Combine training and testing datasets
Step 2: The second step of the framework does not require Python, proceed to the next step.
Step 3: View the column names or summary of the dataset
fullData.columns # Display all column namesfullData.head(10) # Display the first 10 records of the dataframefullData.describe() # You can use the describe() function to view the summary of the numerical range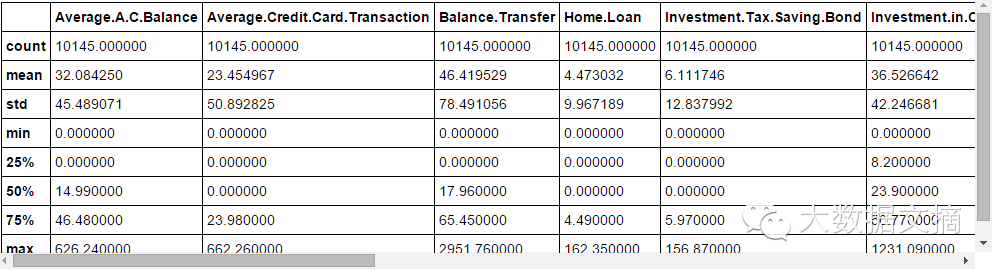
Step 4: Identify a) ID variable b) target variable c) categorical variables d) numerical variables e) other variables.
ID_col = ['REF_NO']target_col = ["Account.Status"]cat_cols = ['children','age_band','status','occupation','occupation_partner','home_status','family_income','self_employed', 'self_employed_partner','year_last_moved','TVarea','post_code','post_area','gender','region']num_cols= list(set(list(fullData.columns))-set(cat_cols)-set(ID_col)-set(target_col)-set(data_col))other_col=['Type'] # Set identifier for training and testing datasetsStep 5: Identify missing value variables and create flags
fullData.isnull().any()# Returns True or False, True means there are missing values and False means the oppositenum_cat_cols = num_cols+cat_cols # Combine numerical and categorical variables# Create a new variable for variables with missing values# Flag missing values as 1, otherwise 0for var in num_cat_cols: if fullData[var].isnull().any()==True: fullData[var+'_NA']=fullData[var].isnull()*1 Step 6: Fill in missing values
# Fill numerical missing values with meanfullData[num_cols] = fullData[num_cols].fillna(fullData[num_cols].mean(),inplace=True)# Fill categorical variable missing values with -9999fullData[cat_cols] = fullData[cat_cols].fillna(value = -9999)Step 7: Create a label encoder for categorical variables, split the dataset into training and testing sets, and further split the training dataset into training and validation sets.
# Create a label encoder for categorical featuresfor var in cat_cols: number = LabelEncoder() fullData[var] = number.fit_transform(fullData[var].astype('str'))# The target variable is also categorical, so it is also transformed using the label encoderfullData["Account.Status"] = number.fit_transform(fullData["Account.Status"].astype('str'))train=fullData[fullData['Type']=='Train']test=fullData[fullData['Type']=='Test']train['is_train'] = np.random.uniform(0, 1, len(train)) <= .75Train, Validate = train[train['is_train']==True], train[train['is_train']==False]Step 8: Pass the filled and dummy (missing value flags) variables to the model. I use Random Forest to predict the class.
features=list(set(list(fullData.columns))-set(ID_col)-set(target_col)-set(other_col))x_train = Train[list(features)].valuesy_train = Train["Account.Status"].valuesx_validate = Validate[list(features)].valuesy_validate = Validate["Account.Status"].valuesx_test=test[list(features)].valuesrandom.seed(100)rf = RandomForestClassifier(n_estimators=1000)rf.fit(x_train, y_train)Step 9: Check performance and make predictions
status = rf.predict_proba(x_validate)fpr, tpr, _ = roc_curve(y_validate, status[:,1])roc_auc = auc(fpr, tpr)print roc_aucfinal_status = rf.predict_proba(x_test)test["Account.Status"]=final_status[:,1]test.to_csv('C:/Users/Analytics Vidhya/Desktop/model_output.csv',columns=['REF_NO','Account.Status'])Now it can be submitted!


【Volunteer Recruitment – Visualization Column】
Column Introduction: The Visualization Column plans to be divided into two parts starting from 2016. One part focuses on translation, recommending good articles about visualization from the internet to readers. The other part focuses on programming, starting with hands-on series articles to introduce readers to the use of visualization tools. In the future, we will consider doing some small projects related to visualization.
Joining Requirements: Enthusiasm for volunteer work and learning. Basic guarantee of 3 hours of volunteer service time per week. English reading and writing ability should reach at least level six. If engaging in programming-related volunteer work, proficiency in Python or R, or a foundation in other languages, and a willingness to learn visualization-related programming knowledge is required. Reply “Volunteer” in the backend of Big Data Digest to learn more.
Column Editor: Yao Jialing, with a Bachelor’s degree in Computer Software and a Master’s degree in Business Administration.
Recommended Previous Articles, Click the Image to Read
-
Animated GIFs: Tracking NBA Players’ Movements with Python

-
10 Methods for Data Visualization with Python

【Limited Time Resource Download】

Click the image below to read “7 Major Trends in Big Data Development in 2016”

Before 2016/1/31
For the December 2015 resource file package download, please click the bottom menu of Big Data Digest: Download etc. — December Download
Exciting articles from Big Data Digest:
Reply with 【Finance】 to see historical journal articles from the 【Finance and Business】 column
Reply with 【Visualization】 to experience the perfect combination of technology and art
Reply with 【Security】 for fresh cases about leaks, hackers, and offense-defense
Reply with 【Algorithm】 for interesting and informative people and events
Reply with 【Google】 to see its initiatives in the field of big data
Reply with 【Academician】 to see how many academicians discuss big data
Reply with 【Privacy】 to see how much privacy remains in the era of big data
Reply with 【Healthcare】 to view six articles in the healthcare field
Reply with 【Credit】 for four articles on big data credit topics
Reply with 【Big Country】 to see the “Big Data National Archives” of the United States and 11 other countries
Reply with 【Sports】 for applications of big data in tennis, NBA, and other cases
Reply with 【Volunteer】 to learn how to join Big Data Digest
Long press the fingerprint to follow “Big Data Digest”

Focusing on big data, sharing daily