Introduction
Often, the datasets we need are very large due to high resolution, necessitating storage in chunks (in fact, many high-resolution datasets are provided for download in a chunk-compressed format).The naming convention of these chunk files usually indicates their corresponding latitude and longitude ranges, but finding and verifying them one by one can be cumbersome, which must have troubled many people.This tutorial introduces how to quickly find the filenames of data files within the research area of China using Python.
Problem Solving

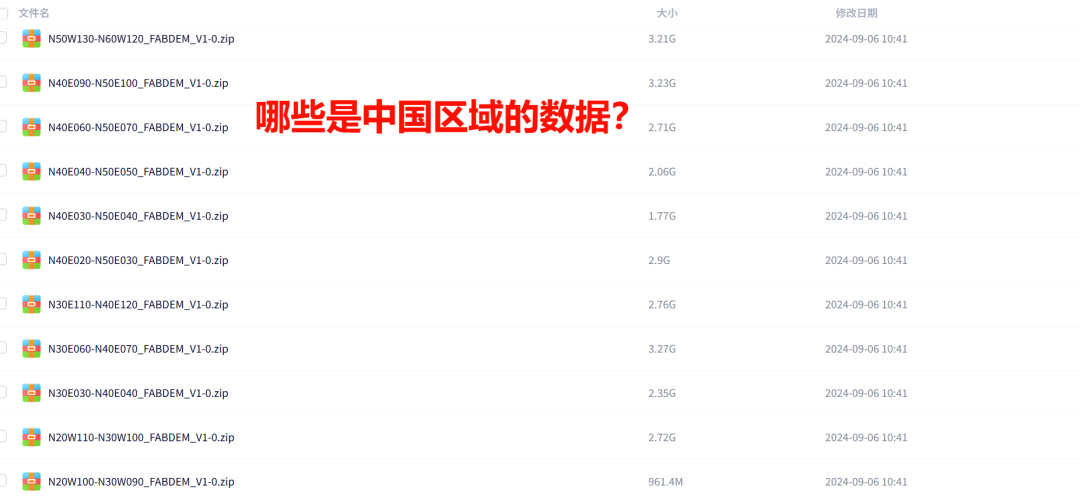
The image below shows a cloud disk link for global DEM data. If I only need data for the China region (or a specific ROI), how can we find the required data names from this massive list of data names? Many friends must have encountered this problem, ultimately giving up, painstakingly searching one by one, or quickly finding the target using programming~
Code
**************** 说明 *****************# This code is written by [Miao's Python Study], and it is used to filter out the DEM data filenames that cover the China region based on China's vector boundary data.# The code functionality includes reading China's vector boundary data and converting the coordinate system, obtaining the latitude and longitude extremes of the boundary points, defining the latitude and longitude span of the DEM files, generating a grid of coverage, checking the intersection of the grid with China's boundary, generating filenames that conform to the naming rules, and finally printing the output in a format of 4 filenames per line.# If there is a need to use, modify, or disseminate this code, please retain this note.# Code written date: 2025-04-10import geopandas as gpdfrom shapely.geometry import boximport math
# Read China's vector boundary and convert the coordinate systemcn_border = gpd.read_file(r'D:\Geographical_data\Administration\china\2024年省市县三级行政区划数据(审图号:GS(2024)0650号)\国界.shp').to_crs(4326)
# Get the latitude and longitude extremes of all boundary pointsall_points = []for geom in cn_border.geometry:    if geom.geom_type == 'Polygon':        all_points.extend(geom.exterior.coords)    elif geom.geom_type == 'MultiPolygon':        for poly in geom.geoms:            all_points.extend(poly.exterior.coords)
lons = [p[0] for p in all_points]lats = [p[1] for p in all_points]min_lon, max_lon = min(lons), max(lons)min_lat, max_lat = min(lats), max(lats)
# Define the span of DEM files (assumed to be 10 degrees, can be adjusted as needed)lat_step = 10lon_step = 10
# Generate the starting points of the coverage gridlat_start = math.floor(min_lat / lat_step) * lat_steplat_end = math.ceil(max_lat / lat_step) * lat_steplon_start = math.floor(min_lon / lon_step) * lon_steplon_end = math.ceil(max_lon / lon_step) * lon_step
# Iterate through all grids and check for intersectionchina_dem_files = []for lat in range(int(lat_start), int(lat_end) + lat_step, lat_step):    for lon in range(int(lon_start), int(lon_end) + lon_step, lon_step):        grid = box(lon, lat, lon + lon_step, lat + lat_step)        if cn_border.intersects(grid).any():            # Generate filenames that conform to the naming rules            nw = f"N{lat:02d}E{lon:03d}"            se = f"N{lat+lat_step:02d}E{lon+lon_step:03d}"            china_dem_files.append(f"{nw}-{se}")
# Print 4 filenames per linefor i in range(0, len(china_dem_files), 4):    print(" ".join(china_dem_files[i:i + 4]))
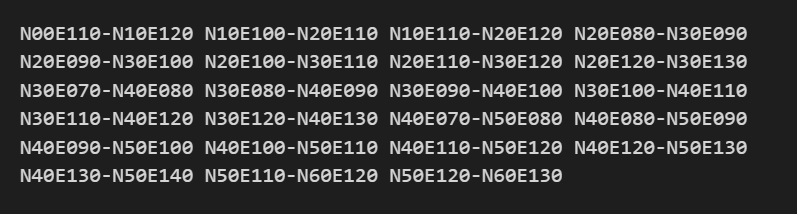
The above image lists all the filenames corresponding to the areas covered in the China region. If it is another area, simply change the vector path. The code is very flexible and can be easily adjusted to meet your requirements, greatly improving the efficiency of filtering target files.
Code Purpose
To filter out the DEM data filenames that cover the China region based on China’s vector boundary data and print the output in a format of 4 filenames per line.
Code Logic
-
Data reading and preprocessing: Use geopandas to read China’s vector boundary data and convert it to the specified 4326 coordinate system.
-
Obtain the latitude and longitude extremes of the boundary: Traverse the geometric objects of the vector boundary, extract the latitude and longitude coordinates of all boundary points, and calculate the minimum and maximum values of latitude and longitude.
-
Define grid span: Set the latitude and longitude span of the DEM files (default is 10 degrees), which can be adjusted according to actual conditions.
-
Generate grid starting points: Based on the latitude and longitude extremes and grid span, calculate the starting and ending points of the coverage grid.
-
Iterate through the grid and filter: Iterate through all generated grids, use the shapely box function to create the geometric object of each grid, and check if it intersects with China’s boundary. If it intersects, generate filenames that conform to the naming rules and add them to the result list.
-
Output results: Traverse the result list and print the filenames in a format of 4 filenames per line.