
Original Author: Jeffrey M. Perkel
The image viewing and analysis software napari fills a gap in the scientific ecosystem of the Python programming language.
Josh Dorrington has become quite adept at observing the jet stream. He plots the fast-moving air currents at different altitudes and arranges the flow maps sequentially. “You learn to observe all these cross-sections and unravel the meanings behind them,” says Dorrington, an atmospheric physicist at the University of Oxford in the UK. However, this “manual” method is relatively slow compared to computer visualization and “lacks interactivity.”
Therefore, when faced with atmospheric blocking events (extreme weather events caused by the deflection of the jet stream due to high-pressure stagnant air masses), Dorrington turned to another method for visualization. He used the image viewing software napari to present the jet streams moving over the Northern Hemisphere in a three-dimensional animation—air currents that are usually synchronized but not always. “I created a brief visualization of the low and high-altitude jet streams over the Atlantic in just one afternoon!” he tweeted last August.
Illustration: The Project Twins
napari is a free, open-source, and extensible image viewer designed for any complex (“n-dimensional”) data, tightly integrated with the Python ecosystem (see napari.org). napari is the brainchild of three scientists: Loïc Royer, a microscopy expert at the Chan Zuckerberg Biohub in San Francisco, California; Juan Nunez-Iglesias, who develops image analysis at Monash University in Melbourne, Australia; and Nicholas Sofroniew, head of the imaging technology team at the Chan Zuckerberg Initiative (CZI) in Redwood City, California.
The team created napari in 2018 to fill a gap in the Python scientific ecosystem. Although Python is a general-purpose language for scientific computing, it lacks visualization tools capable of handling n-dimensional datasets. As a result, data analysis often requires tedious back-and-forth between Python and other tools (such as the Java-based image analysis library ImageJ), as researchers alternate between manipulating their data and visualizing it to see what is happening.
napari is named after a village on a Pacific island, located between San Francisco, where the developers are based, and Melbourne, Australia. It features a simple graphical interface and an integrated Python console. In this graphical interface, users can render, rotate, and manipulate images in two or three dimensions, and control other dimensions, such as time “slices” in time series data, using sliders below the image window. If conditions allow, users can accelerate the software using a graphics processing unit (GPU). “We make sure the computer is running at full throttle,” Royer explains. (ImageJ users can work in the Python environment using PyImageJ, see pypi.org/project/pyimagej)
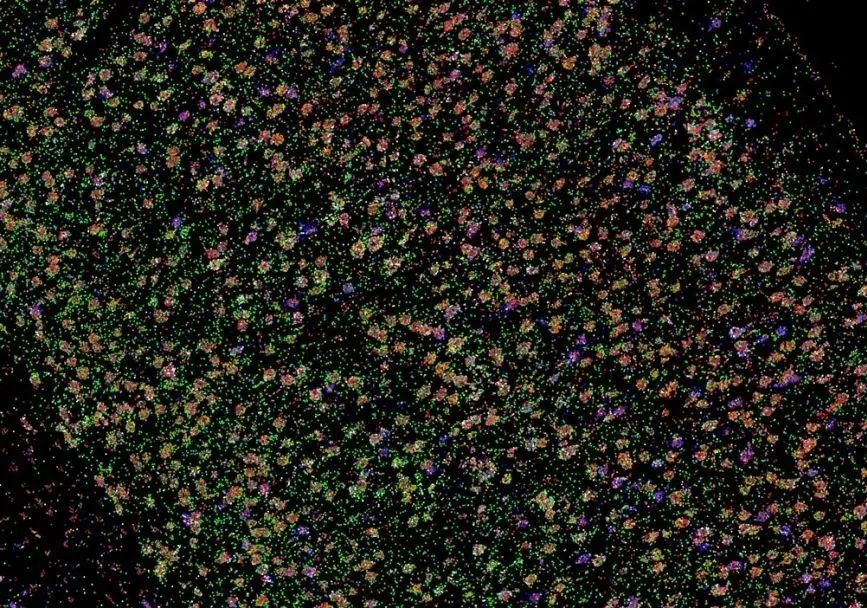
napari has layers similar to Adobe Photoshop, allowing users to overlay points, vectors, trajectories, surfaces, polygons, annotations, or other images. For example, researchers can open an image of a tissue in napari, click to identify cell nuclei, retrieve these points in Python, and use them as “seed points” for a cell image segmentation algorithm (used to identify cell boundaries). They can then push the results as a new layer on the original image in napari to evaluate how well the segmentation performed.
Xavier Casas Moreno, an applied physicist at the Royal Institute of Technology in Stockholm, has embedded napari into an instrument control system called ImSwitch, which he developed to control super-resolution microscopes in the lab. Using the layering feature, researchers can overlay images captured from different angles by multiple cameras and sensors. “This was a problem that had long remained unsolved,” Moreno says. ImSwitch also includes a custom napari control panel (or “widget”), allowing users to move two images relative to each other for alignment.
Users can also extend napari with plugins. There are over 100 plugins available on the napari hub (see napari-hub.org), for tasks such as file reading and writing, microscope control, and cell segmentation. Carsen Stringer, a computational neuroscientist at the Janelia Research Campus of the Howard Hughes Medical Institute, developed a cell segmentation plugin called CellPose, which showcases the power of Python deep learning algorithms through a simple graphical interface. Stringer and her colleagues use CellPose to measure gene expression and calcium signaling in individual cells within neural tissue.
Robert Haase, a biological image analysis developer at the Technical University of Dresden in Germany, has developed several plugins for napari. One plugin is for his py-clEsperanto assistant, which accelerates image processing workflows and eliminates programming language barriers between different image viewing systems; another plugin is natari, a play on napari and Atari (the video game developer), where users can play a game shooting cells to remove them from view.
Nunez-Iglesias even created a plugin that allows users to control napari via a MIDI (Musical Instrument Digital Interface) controller (commonly used for custom digital audio output). In a video demonstration, Nunez-Iglesias combined a MIDI controller with an Apple iPad, using an Apple Pencil to draw on the image displayed on the tablet, and then manually moved layers in napari using the knobs on the MIDI controller to segment cells. “I just prefer hardware control and physical feedback over a virtual user interface,” he explains.
napari is currently at version 0.4.12 and is still in development. The CZI Science Imaging Program (CZI science imaging programme) supports it, hosting the napari hub website and providing some manpower for the project, with many developers in the scientific community contributing code. CZI has also allocated $1 million to support the napari plugin accelerator grant program, announcing 41 awards last November.
Key development goals for napari include improving installation, documentation, plugin interface, and enhancing the handling of large 3D datasets. Nunez-Iglesias notes that in experiments like connectomics, the scale of the datasets produced can slow software processing to a “crawl,” and a “lazy-loading” scheme, which loads data on demand, should help alleviate this bottleneck.
Nunez-Iglesias estimates that napari has a user base of “thousands.” This community is rapidly growing even beyond the realm of microscopy experts. For instance, users have demonstrated that napari is also applicable in geophysics and structural biology. Additionally, DeepLabCut (a popular tool for capturing animal movement poses) has announced plans to replace its viewer with napari.
In 2020, Hung-Yi Wu, a systems biologist at Harvard Medical School at the time, summarized his excitement in a tweet: “@napari_imaging is amazing, it feels like I’m using the first iPhone.”
The original article was published under the title Python power-up: new image tool visualizes complex data in the technical feature section of Nature on December 6, 2021.
© nature
doi: 10.1038/d41586-021-03628-7
Click to read the original articlein English
Click the text or image to read related articles
New Molecular Toolbox Unveils Deeper Secrets of the Brain | Nature Technical Feature
Can We Be Friends Again? You Use Python, I Use AWE, Workflow Tools Can Help Us Reconnect
Forget Python and Fortran, Scientists Are Starting to Use Julia

Copyright Notice:
This article was translated by the Springer Nature Shanghai office. The Chinese content is for reference only; all content is subject to the original English version. Feel free to share it in your circle of friends, and for reprints, please email [email protected]. Unauthorized translations are considered copyright infringement, and the copyright holder reserves the right to pursue legal action.
© 2022 Springer Nature Limited. All Rights Reserved

Star us 🌟, and remember to like, view + and share!