 The team from the National University of Defense Technology proposed a lithium dendrite detection method based on time-domain relaxation time distribution (DRT), achieving an accuracy rate of over 99% after 240 cycles under different charging conditions, and can be integrated into existing Battery Management Systems (BMS) without additional hardware. The team automatically set the detection threshold using the 3σ criterion, which can detect slight lithium dendrites (such as minor deposits at the edge of the electrode under 0°C and 0.5C charging), achieving a recall rate of 100% and a false positive rate of only 0.6%.This achievement was published under the title “High sensitivity detection of lithium plating in high-energy lithium-ion batteries based on time-domain distribution relaxation times analysis” in the journal Energy Storage Materials, with Wang Yu as the first author from the College of System Engineering, National University of Defense Technology.
1. Abstract
High-energy lithium-ion batteries (LIBs) are prone to lithium dendrite deposition during fast charging or low-temperature charging, leading to severe safety issues such as separator puncture and internal short circuits. However, existing detection methods suffer from insufficient sensitivity and reliance on manual experience. To address this, the research team proposed a novel lithium dendrite detection method based on time-domain relaxation time distribution (DRT): by modeling the voltage relaxation curve using time-domain DRT, the detection threshold is automatically determined, achieving high sensitivity in lithium dendrite detection. Experimental validation shows that this method achieves an accuracy rate of up to 99% over 240 test cycles under different charging conditions; moreover, it is easy to integrate into existing BMS without additional measurement hardware. This research provides an efficient and convenient lithium dendrite detection solution for the safe operation of high-energy lithium-ion batteries, especially suitable for scenarios prone to lithium dendrite formation such as fast charging and low-temperature charging.
2. Introduction
Lithium-ion batteries (LIBs) have been widely used in electric vehicles, portable electronic devices, and energy storage systems due to their long cycle life, high power density, and low self-discharge rate. High-energy lithium-ion batteries effectively alleviate the range anxiety problem of electric vehicles. However, the thick electrode coatings of high-energy lithium-ion batteries are prone to lithium dendrite deposition during fast charging (2-3C and above) and low-temperature charging (e.g., 0°C): on one hand, this leads to rapid capacity decay, and on the other hand, the continuous growth of lithium dendrites can puncture the separator, causing internal short circuits and resulting in severe safety incidents such as fire and explosion. Therefore, precise online detection of lithium dendrites is crucial for the safe operation of high-energy lithium-ion batteries.
In the past decade, lithium dendrite detection methods have mainly been divided into three categories: sensor-driven methods, model-driven methods, and data-driven methods. The first two categories suffer from high usage costs, low model accuracy, and high computational complexity, making them difficult to apply in practical BMS; although data-driven methods rely on operational data such as voltage and are more suitable for online applications, traditional data-driven methods (such as voltage platform methods and differential voltage curve methods) still have limitations: for example, additional voltage platforms in the discharge curve after low-temperature charging, extra valleys in the dV/dQ curve, and platforms in the voltage relaxation process after charging can indicate lithium dendrites, but when the amount of lithium dendrite deposition is small (such as slight lithium dendrites), these features may not manifest, leading to low detection sensitivity; at the same time, these methods require manual identification of features from the voltage relaxation curve, making automatic detection impossible. To solve these problems, the research team proposed an online lithium dendrite detection method based on time-domain DRT modeling, aiming to enhance detection sensitivity and eliminate reliance on manual experience.
3. Methods
The research content mainly revolves around the principles of time-domain DRT, voltage relaxation curve DRT modeling, and lithium dendrite detection based on modeling, validated through multiple sets of experimental data and images, with specific image analysis as follows:
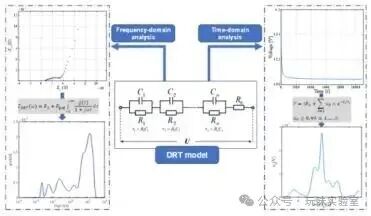
Fig. 1: DRT Analysis of Lithium-Ion Battery Time-Domain and Frequency-Domain Data
This figure is divided into two parts: the left side shows the application of the DRT method in the frequency domain (traditional use), while the right side shows its application in the time domain (the innovation of this study), presenting a dual-dimensional analysis of the polarization characteristics of lithium-ion batteries using the DRT method. In the frequency domain, DRT analyzes battery polarization characteristics by processing electrochemical impedance spectroscopy (EIS) data using an impedance model\(Z_{DRT}(A9)=R_0+R_{pol}\int_{0}^{B0}rac{g(\tau)}{1+j\omega\tau}d\tau\) (where\(R_0\) is the ohmic resistance,\(R_{pol}\) is the polarization resistance,\(\tau\) is the time constant,\(g(\tau)\) is the polarization resistance density distribution function), combined with Tikhonov regularization and other methods; in the time domain, for the voltage relaxation process after charging (depolarization process), DRT achieves precise modeling of the voltage relaxation curve through the polarization voltage model\(V_{DRT}(t)=iR_0+\int_{0}^{\infty}u(\tau)\times e^{-t/\tau}d\tau\) (where\(u(\tau)\) is the polarization voltage distribution function), combined with the least squares method to solve\(u(\tau)\). This figure clarifies the core idea of extending DRT from the frequency domain to the time domain, laying the theoretical foundation for subsequent voltage relaxation curve modeling and lithium dendrite detection. Based on this principle, high-precision modeling with a fitting error of less than 0.01% was achieved under both 0°C and 25°C conditions in subsequent experiments.
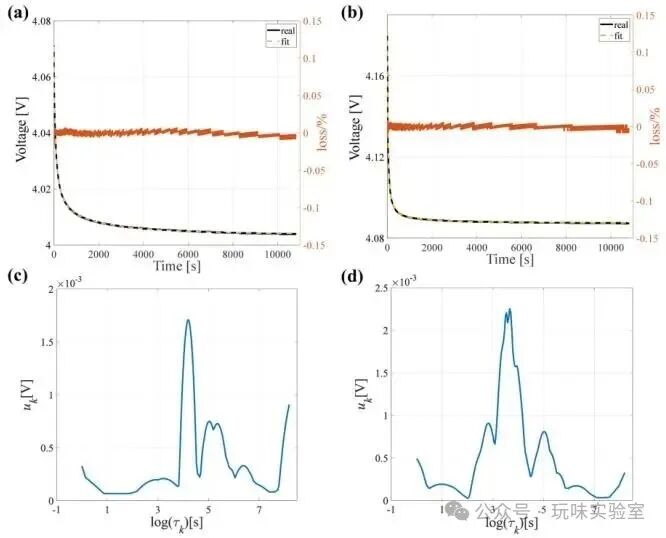
Fig. 2: DRT Modeling Results of Voltage Relaxation Curves at 0°C and 25°C and Polarization Voltage Distribution
This figure contains four sub-figures: (a) modeling results of the voltage relaxation curve at 0°C, (b) modeling results of the voltage relaxation curve at 25°C, (c) polarization voltage distribution at 0°C, and (d) polarization voltage distribution at 25°C, comprehensively validating the modeling accuracy of time-domain DRT for voltage relaxation curves at different temperatures. In (a) and (b), the horizontal axis represents time (unit: s, range 0-10000s), and the vertical axis on the left represents voltage (unit: V, approximately 4.02-4.08V at 0°C, approximately 4.12-4.16V at 25°C), while the right side represents modeling error (unit: %); the curves show that the DRT model fitting curve almost completely overlaps with the actual voltage relaxation curve, with fitting errors controlled within 0.01% at all time points, where the maximum error at 0°C does not exceed 0.05%, and at 25°C does not exceed 0.1%, proving the high accuracy of this modeling method under different temperature scenarios. In (c) and (d), the horizontal axis represents the logarithm of the time constant (log (\(\tau\)), unit: s), and the vertical axis represents the polarization voltage (unit: ×10⁻³V), with the distribution map showing the distribution characteristics of polarization voltage at different time constants: the peak polarization voltage at 0°C is approximately 2×10⁻³V, and at 25°C is approximately 2.5×10⁻³V, reflecting that the polarization degree of the battery is relatively low at low temperatures, consistent with the electrochemical characteristics of the battery. Overall, this figure confirms the effectiveness of the time-domain DRT modeling method through specific data and curve comparisons, providing reliable technical support for subsequent lithium dendrite detection based on modeling errors.
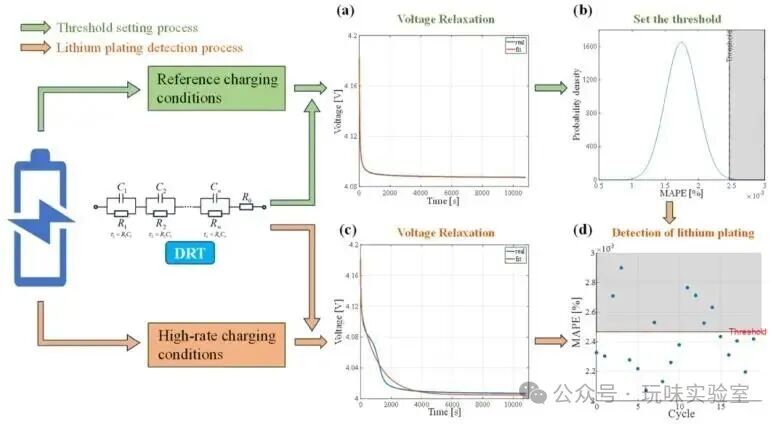
Fig. 3: Working Mechanism of Lithium Dendrite Detection Method Based on Time-Domain DRT
This figure contains four sub-figures: (a) voltage relaxation curve under reference charging conditions, (b) detection threshold setting process, (c) voltage relaxation curve under high-rate charging conditions, and (d) lithium dendrite detection results, fully presenting the flow and logic of the detection method. In (a), the horizontal axis represents time (unit: s), and the vertical axis represents voltage (unit: V), with the curve showing the voltage relaxation process of the battery under reference charging conditions (without lithium dendrites), where the voltage gradually decreases to the open-circuit voltage (OCV), and the DRT model fitting error is minimal; in (b), the horizontal axis represents the number of cycles, and the vertical axis represents the mean absolute percentage error (MAPE, unit: ×10⁻⁵%), through statistical analysis of fitting errors over multiple cycles under reference conditions, the detection threshold is determined using the 3σ criterion (red line in the figure), with the error distribution conforming to a normal distribution with a mean of 0.0017% and a standard deviation of 0.00024%, ultimately setting the threshold at 0.0025%; in (c), the horizontal axis represents time (unit: s), and the vertical axis represents voltage (unit: V), with the curve showing deviations between the voltage relaxation curve under high-rate charging (prone to lithium dendrites) and the DRT fitting curve, with significantly increased fitting errors; in (d), the horizontal axis represents the number of cycles (1-24), and the vertical axis represents MAPE (unit: %), with the gray shaded area indicating the lithium dendrite occurrence interval, showing that the fitting errors of all cycles under high-rate charging conditions exceed the 0.0025% threshold, while under reference conditions, only one cycle (the 7th) slightly exceeds the threshold, confirming that this method can accurately identify the occurrence of lithium dendrites. This figure clearly illustrates the working principle of the detection method through step-by-step visualization, combined with error data (such as an average error of 0.0017% under reference conditions and errors exceeding 0.006% under high rates), providing a methodological basis for experimental validation.
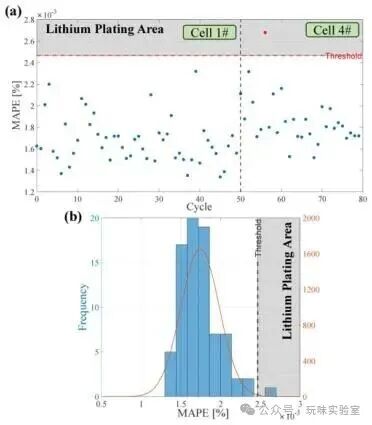
Fig. 4: Fitting Error Graph of the Battery Under Reference Charging Conditions
This figure contains two sub-figures: (a) scatter plot of fitting errors for Cell 1# and Cell 4#, and (b) distribution graph of fitting errors for all cycles of the two batteries, used to verify the stability and error distribution characteristics of time-domain DRT modeling under no lithium dendrites. In (a), the horizontal axis represents the number of cycles (1-70), and the vertical axis represents the mean absolute percentage error (MAPE, unit: ×10⁻⁵%), with both Cell 1# and Cell 4# using standard rate charging (without lithium dendrites), showing that the fitting errors of all cycles for both batteries are at a very low level: Cell 1# has a first cycle error of 0.0016% and a last cycle error of 0.0015%, while Cell 4# has a first cycle error of 0.0021% and a last cycle error of 0.0017%, with no significant trend of error increasing with the number of cycles, proving that under no lithium dendrites, the DRT model can achieve precise fitting of voltage relaxation curves under different temperatures and charging rates; in (b), the horizontal axis represents MAPE (unit: ×10⁻⁵%), and the vertical axis represents the frequency of error occurrence, with the histogram presenting the distribution of errors, and the red curve representing the fitted normal distribution curve, confirmed by the Kolmogorov-Smirnov (KS) test, showing that the error data follows a normal distribution with a mean of 0.0017% and a standard deviation of 0.00024%, thus using the 3σ criterion to calculate the lithium dendrite detection threshold as 0.0025% (μ+3σ=0.0017%+3×0.00024%). This figure provides reliable data support for the setting of the detection threshold through specific error data (such as both batteries having average errors below 0.002%) and statistical analysis, while verifying the stability of the modeling method under no lithium dendrites, forming an important basis for subsequent lithium dendrite detection.
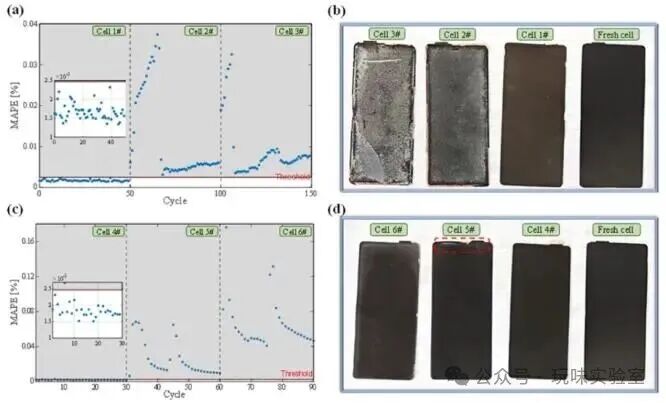
Fig. 5: DRT Fitting Errors and Disassembly Results of Batteries Under Different Charging Conditions
This figure contains four sub-figures: (a) time-domain DRT fitting error graph for Cell 1#, Cell 2#, and Cell 3#, (b) disassembly morphology images of the anodes of these three batteries, (c) fitting error graphs for Cell 4#, Cell 5#, and Cell 6#, and (d) disassembly morphology images of the anodes of these three batteries, used to verify the accuracy of lithium dendrite detection results (supported by disassembly experiments). In (a), the horizontal axis represents the number of cycles, and the vertical axis represents MAPE (unit: %), with Cell 1# (standard rate) having all cycle errors below the 0.0025% threshold, while Cell 2# (3C rate) and Cell 3# (4C rate) have all cycle errors exceeding 0.006% and 0.019%, significantly higher than the threshold; in (b), the fresh battery, Cell 1# has a black and clean anode surface without deposits, while Cell 2# and Cell 3# have a large amount of gray-white lithium dendrite deposits on the anode surface, corresponding completely with the error results; in (c), Cell 4# (standard rate) has only one cycle error exceeding the threshold, while Cell 5# (0°C, 0.5C) and Cell 6# (0°C, 1C) have all cycle errors exceeding 0.0065% and 0.083%, respectively; in (d), Cell 4# has a clean anode, while Cell 5# has minor gray-white deposits at the edge of the anode (near the copper tab, marked in red rectangle), and Cell 6# has significant deposits along the entire edge of the anode, confirming the characteristic of lithium dendrites being prone to deposit at the edges of electrodes at low temperatures. Combined with detection indicators, this method achieves an accuracy rate of 99.6%, a recall rate of 100%, and a false positive rate of 0.6%, fully confirming the accuracy and reliability of the detection method through the correspondence of error data and disassembly morphology.
4. Conclusions
Conclusions
- High-energy lithium-ion batteries have a significantly increased risk of lithium dendrite deposition during high-rate (3C, 4C) or low-temperature (0°C) charging, while existing battery management systems (BMS) struggle to detect this accurately; the time-domain DRT lithium dendrite detection method proposed in this study resolves the issues of low sensitivity and reliance on manual methods by modeling the voltage relaxation curve, achieving an accuracy rate exceeding 99% over 240 cycles under different charging conditions, with a recall rate of 100% and a false positive rate of only 0.6%.
- This method automatically sets the threshold (0.0025%) using the 3σ criterion (based on the normal distribution of errors under no lithium dendrites, with a mean of 0.0017% and a standard deviation of 0.00024%), capable of detecting slight lithium dendrites (such as minor deposits at the edge of the electrode under 0°C and 0.5C), and does not require additional hardware, allowing direct integration into existing BMS, significantly outperforming traditional voltage platform methods (which cannot detect slight lithium dendrites).
Outlook
- Currently, this method requires collecting 10800 seconds (3 hours) of voltage relaxation data for precise detection; in the future, it will combine the time-domain DRT method with electrochemical models to shorten the measurement time required for detection and enhance the real-time application of online monitoring.
- Quantifying the amount of lithium dendrite deposition is crucial for battery safety diagnosis; subsequent research will utilize the time-domain DRT analysis method to conduct quantitative studies on lithium dendrite deposition, providing more comprehensive technical support for battery safety assessment.
References
High sensitivity detection of lithium plating in high-energy lithium-ion batteries based on time-domain distribution relaxation times analysis