In modern web development, debugging and analyzing HTTP requests is a crucial task. Whether you are a backend developer or a frontend engineer, you need a simple and easy-to-use tool to help you quickly locate issues and optimize performance. Today, we will discuss a powerful Go language tool—GoVisual. It is a zero-configuration HTTP request visualization and debugging tool designed specifically for local Go web development.
0x0001 Introduction: Why Do We Need GoVisual?
Imagine this scenario: you are developing a complex Go web application and suddenly find that the response speed of a certain API endpoint is abnormally slow. You try to troubleshoot the issue through logs, but you feel overwhelmed by the massive amount of log information. At this point, you need a tool that can monitor HTTP requests in real-time, clearly displaying the details of each request without cumbersome configuration steps.
GoVisual was born for this purpose! It is a lightweight, zero-configuration HTTP request visualization and debugging tool that helps developers easily capture and analyze HTTP requests. Next, we will delve into the core features, usage methods, and some advanced features of GoVisual.
0x0002 Core Feature One: Real-Time Request Monitoring
One of the core features of GoVisual is real-time request monitoring. By integrating it into your Go web application, GoVisual can automatically capture all HTTP requests passing through the application and display these requests in an intuitive manner.
Technical Principles
GoVisual is implemented based on Go’s standard HTTP handler. It wraps existing HTTP handlers to intercept all HTTP requests and log them. Specifically, GoVisual performs the following actions when each request arrives:
- Capture Request Information: including HTTP method, path, header information, request body, etc.
- Log Response Information: including status code, response time, response body, etc.
- Store to Specified Storage Backend: supports various storage methods such as memory, PostgreSQL, and Redis.
Practical Application
Suppose you are developing a simple user management API, the code is as follows:
package main

import (
    "net/http"
    "github.com/doganarif/govisual"
)

func userHandler(w http.ResponseWriter, r *http.Request) {
    w.Write([]byte("User data"))
}

func main() {
    mux := http.NewServeMux()
    mux.HandleFunc("/api/users", userHandler)

    handler := govisual.Wrap(mux)
    http.ListenAndServe(":8080", handler)
}
After running the above code, visit <span>http://localhost:8080/__viz</span> to open the GoVisual dashboard. You will see an interface similar to the image below:
 GoVisual Dashboard
On this interface, you can view all captured HTTP requests, including request methods, paths, status codes, and response times.
0x0003 In-Depth Analysis: Request Inspection and Middleware Tracing
In addition to real-time monitoring, GoVisual also provides more powerful features—request inspection and middleware tracing.
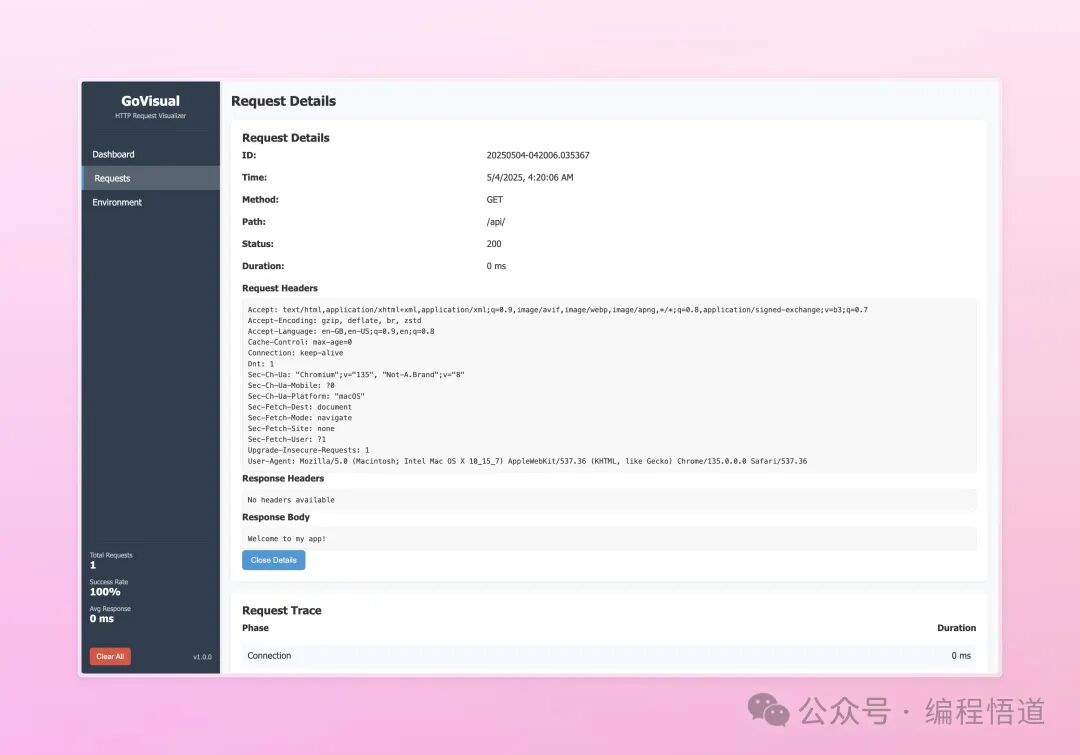
Request Inspection
By clicking on a request in the dashboard, you can view detailed information about that request, including:
- Header Information: all HTTP header fields and their values.
- Request Body: complete request body content (if request body logging is enabled).
- Response Body: complete response body content (if response body logging is enabled).
- Time Information: start time, end time, and total duration of the request.
For example, to enable request body and response body logging in the code:
handler := govisual.Wrap(
    mux,
    govisual.WithRequestBodyLogging(true),
    govisual.WithResponseBodyLogging(true),
)
With this, you can view detailed request and response content in the dashboard.
Middleware Tracing
GoVisual also supports visual tracing of middleware execution flows. If your application uses multiple middleware, GoVisual can clearly display the execution order and duration of each middleware, helping you quickly locate performance bottlenecks.
For example, suppose your application has two middleware:
mux.HandleFunc("/api/users", func(w http.ResponseWriter, r *http.Request) {
    w.Write([]byte("User data"))
})

handler := govisual.Wrap(
    mux,
    govisual.WithMiddlewareTracing(true),
)
In the dashboard, you will see a middleware execution flow diagram similar to the image below:
0x0004 Advanced Features: Storage Backends and OpenTelemetry Integration
GoVisual is not only powerful but also offers flexible extensibility. Below we introduce two of its advanced features: storage backends and OpenTelemetry integration.
Storage Backends
GoVisual supports multiple storage backends for saving captured HTTP request data. By default, GoVisual uses in-memory storage, but this means that all data will be lost when the application restarts. For persistent storage, you can choose PostgreSQL or Redis as the storage backend.
PostgreSQL Storage
When using PostgreSQL storage, you need to provide the database connection string and table name:
handler := govisual.Wrap(
    mux,
    govisual.WithPostgresStorage(
        "postgres://user:password@localhost:5432/database?sslmode=disable",
        "govisual_requests"
    ),
)
Redis Storage
When using Redis storage, you can set a TTL (Time To Live) to automatically clean up expired data:
handler := govisual.Wrap(
    mux,
    govisual.WithRedisStorage(
        "redis://localhost:6379/0",
        86400 // TTL in seconds (24 hours)
    ),
)
OpenTelemetry Integration
If you want to export captured HTTP request data to an OpenTelemetry collector, GoVisual also supports this feature. Just enable the OpenTelemetry option:
handler := govisual.Wrap(
    mux,
    govisual.WithOpenTelemetry(true),
    govisual.WithOTelEndpoint("localhost:4317"),
)
This allows GoVisual to seamlessly collaborate with other distributed tracing systems, further enhancing your debugging capabilities.
0x0005 Example Code and Practical Applications
To help readers better understand how to use GoVisual, we provide some example code.
Basic Example
This is the simplest example that demonstrates the basic functionality of GoVisual:
cd cmd/examples/basic
go run main.go
After running, visit <span>http://localhost:8080/__viz</span> to view the dashboard.
OpenTelemetry Example
If you want to test the OpenTelemetry integration feature, you can run the following command:
cd cmd/examples/otel
docker-compose up -d  # Start Jaeger
go run main.go
Multi-Storage Example
If you want to try different storage backends, you can run the following command:
cd cmd/examples/multistorage
docker-compose up -d  # Start PostgreSQL and Redis
Modify the <span>docker-compose.yml</span> file’s environment variables to switch between different storage backends.
Conclusion: The Value and Future of GoVisual
GoVisual is a powerful and easy-to-use HTTP request visualization and debugging tool. Whether you are a beginner or an experienced developer, you can benefit from it. It not only helps you quickly locate issues but also enhances your application’s performance.
Of course, there are many aspects of GoVisual worth exploring. For example, you can try customizing the dashboard path, filtering specific request paths, or combining it with other tools for deeper analysis.
Finally, if you are interested in GoVisual, why not give it a try! The project address is as follows:
https://github.com/doganarif/GoVisual[1]
I hope this article inspires you, and I wish you great success on your journey in Go language development!
References
[1]
https://github.com/doganarif/GoVisual: https://github.com/doganarif/GoVisual