Table of Contents:
- 1. Why Discuss Modern CLI Tools?
- 2. Storage and Disk Management
- 1. Replacement for df: View Disk Space Usage → duf
- 2. Replacement for du: View Directory or File Size → ncdu
- 3. Replacement for find: Search for Files and Directories → fdfind
- 3. System Monitoring and Process Management
- 1. Replacement for top: View System Performance → htop/btop
- 2. Replacement for iotop / iostat: View Real-time Disk IO → atop
- 4. Network and Connection Debugging
- 1. Replacement for netstat: View Listening Ports → ss
- 2. Replacement for traceroute: Network Path Tracing → mtr
- 3. Replacement for ping: Network Connectivity Testing → fping/gping
- 5. Text Processing and Output Optimization
- 1. Replacement for cat: View File Contents → batcat
- 2. Replacement for head / tail: View Log Contents → lnav
- 6. Have You Been Tempted?
1. Why Discuss Modern CLI Tools?
In daily use of <span>Linux</span> or <span>macOS</span>, the command line has always been an important entry point for efficiently controlling the system. Traditional tools like <span>du</span>, <span>df</span>, and <span>top</span> have accompanied developers for many years, being stable, easy to use, and dependency-free, making them the first choice for many when troubleshooting issues and monitoring resources.
However, as the usage scenarios have diversified, these tools have gradually exposed some “shortcomings of the times”:
- To achieve slightly more complex functions, multiple parameters or even command combinations are required;
- The data presentation methods are inconsistent, making it difficult to quickly focus on key information;
- They do not support interactive operations, limiting readability and efficiency.
In contrast, modern CLI tools have significantly improved the user experience:
- 💡 Support for interactive operations and a more user-friendly interface (color highlighting, real-time refresh, etc.);
- 📊 Provide more comprehensive metrics and dimensions (such as network, disk, containers, etc.);
- 🚀 High running efficiency, suitable for long-term operation.
These tools are not just modern replacements for “old commands,” but are also important components of the new generation of command line workflows.
For this reason, finding those “ready-to-use, clear interface, powerful” modern CLI tools has become a part of my daily efforts to enhance terminal usage experience. Next, let’s look at some new generation command line tools worth trying from different usage perspectives.
2. Storage and Disk Management
1. Replacement for df: View Disk Space Usage → duf
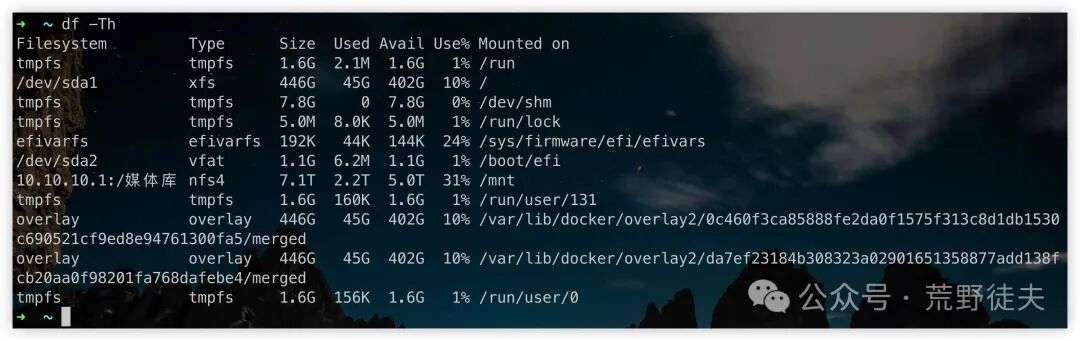
<span>df</span> is the most commonly used command to view disk space usage, quickly outputting the used space, available space, and usage percentage for each mount point. However, its output is quite “plain,” making it less readable, especially when there are multiple mount points/multiple disks, where the information is not intuitive enough.
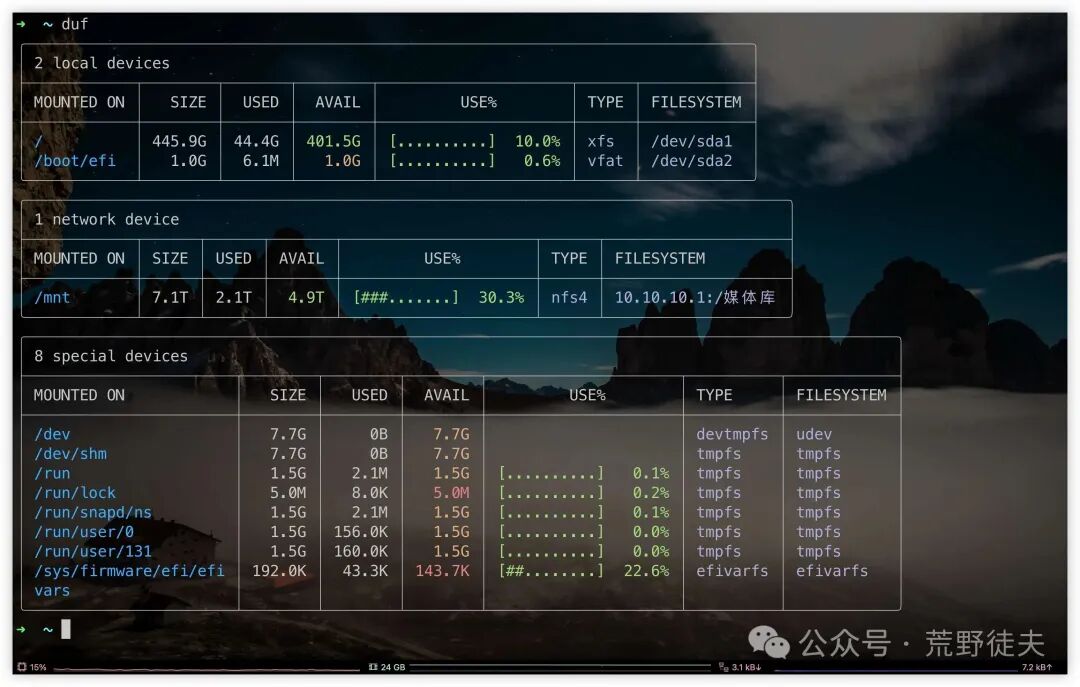
If you want a more aesthetically pleasing terminal display, consider using the modern replacement tool <span>duf</span>.
-
Output of df command:
-
Output of duf command:
The commands mentioned in this article are based on the Ubuntu system, and the CLI tools mentioned can be installed via the apt command unless otherwise specified.
2. Replacement for du: View Directory or File Size → ncdu
<span>du</span> is the most commonly used command for checking disk usage, especially for analyzing how much space a specific directory or file occupies. However, the output structure of <span>du</span> is relatively simple, lacking sorting, interactivity, and intuitiveness, especially when there are many directory levels, making it less user-friendly.
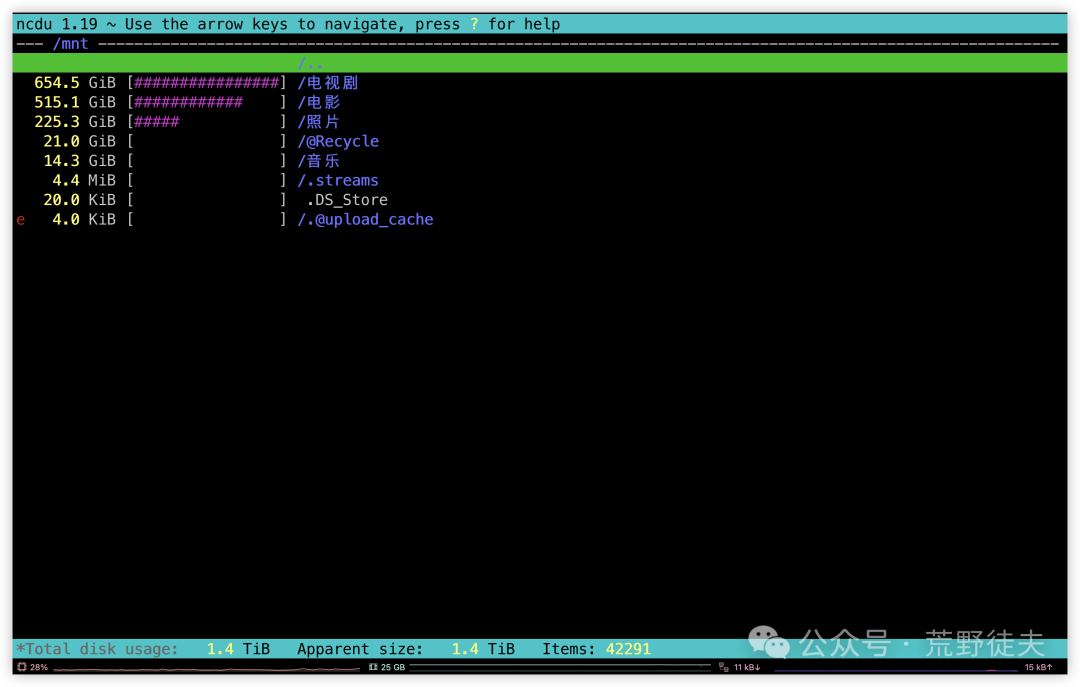
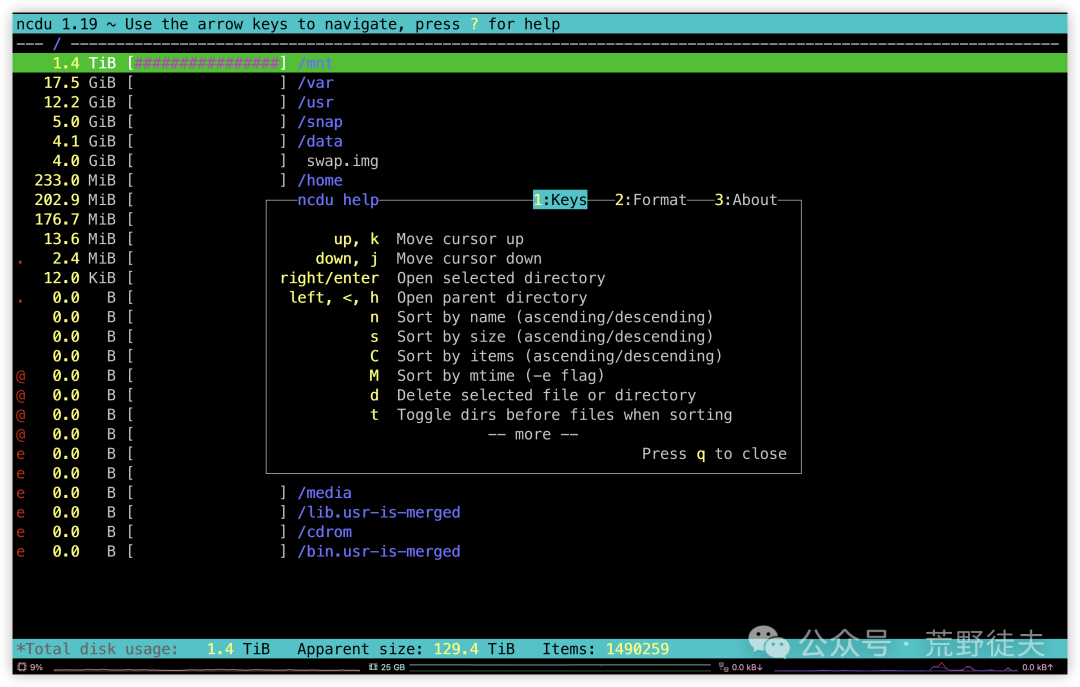
In contrast, <span>ncdu</span> (NCurses Disk Usage) provides an interactive interface that allows for quick viewing of which directories or files occupy the most space, and supports keyboard shortcuts for operations, sorting, deletion, etc., making it very suitable for cleaning up disk space or initially locating large files.
Here is a comparison of the two:
-
<span>du -h --max-depth=1 / | sort -hr</span>command output example: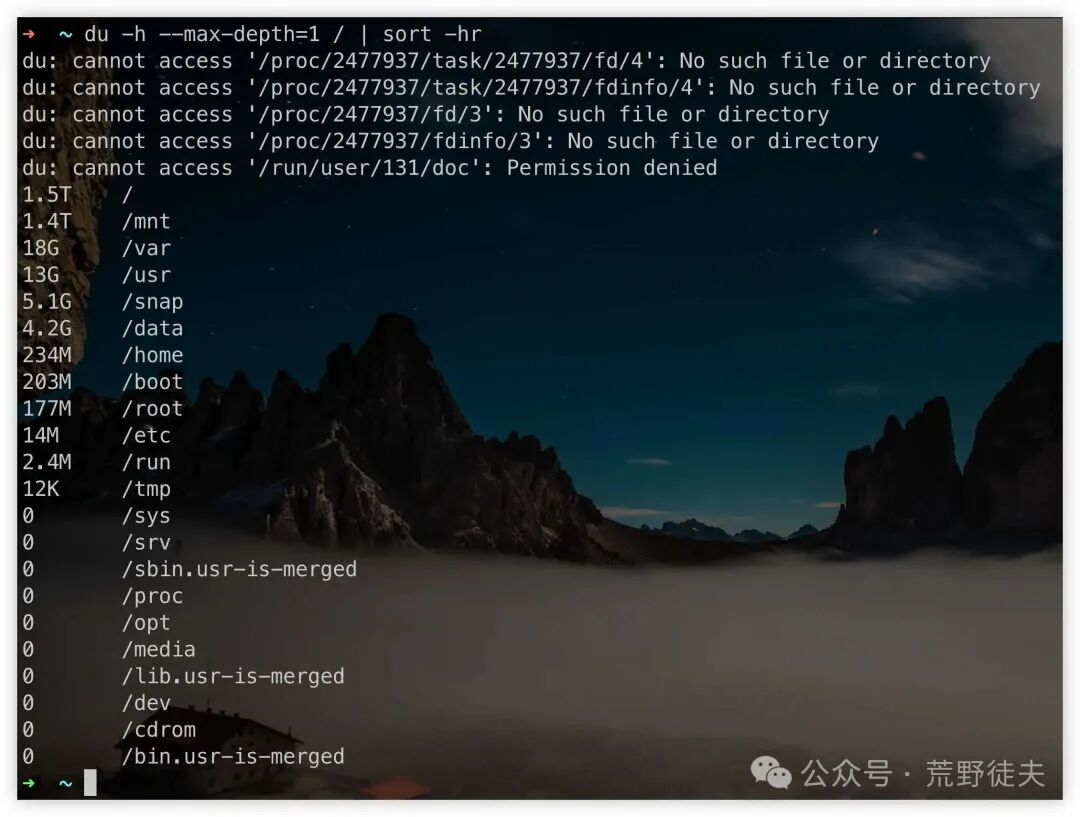
-
<span>ncdu /</span>command interactive interface screenshot or description: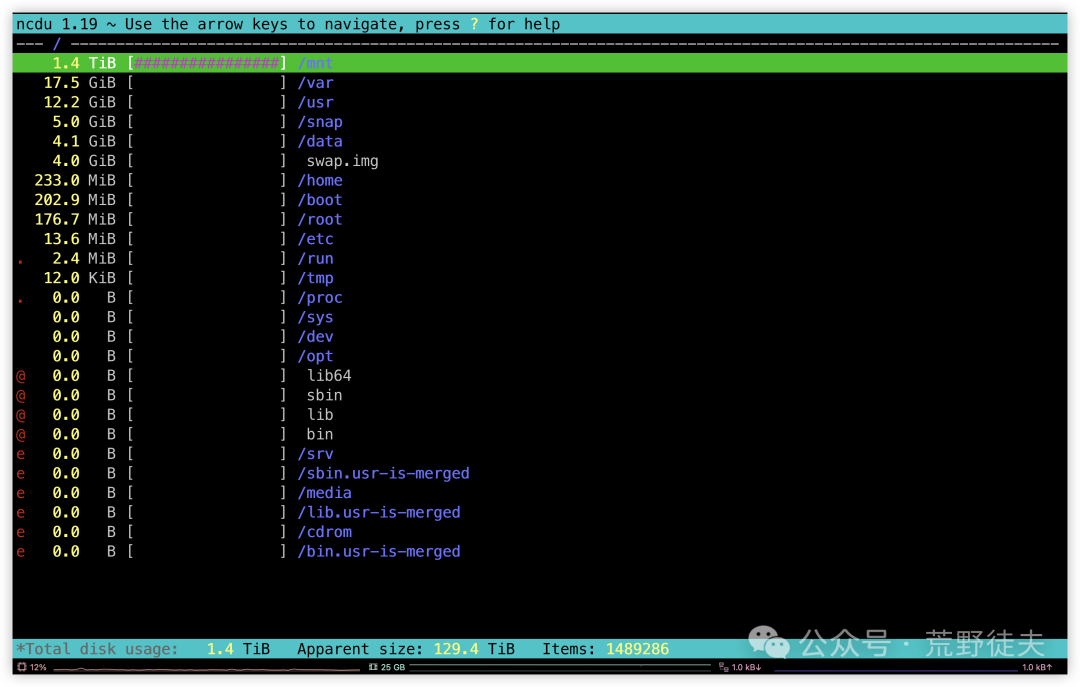
Summary: If you are looking for a more intuitive and efficient way to view disk space usage, ncdu is the preferred replacement for du. More advanced usage features can be explored on your own.
3. Replacement for find: Search for Files and Directories → fdfind
find is a very powerful search command in Linux systems, capable of recursively searching for files or directories that meet certain conditions in a specified path, supporting various filtering conditions such as name, size, modification time, etc. However, due to its powerful functionality, the syntax of the find command is relatively complex, often resulting in lengthy commands, and the output is not very aesthetically pleasing, as it does not highlight or intelligently skip directories without permission by default.
We can use the fd command (installable via <span>apt install fd-find</span> on Ubuntu, with the command being <span>fdfind</span>) as a replacement: 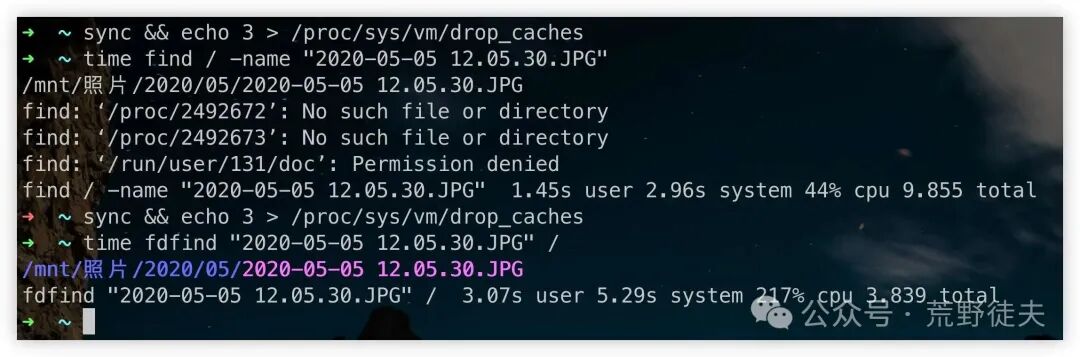
To ensure a fair comparison, we manually cleared the system cache before each query. By comparing the actual execution results of find and fdfind, it can be seen that fdfind utilizes multithreading for parallel acceleration, resulting in significantly faster query speeds, especially in large directories. However, this speedup comes at the cost of higher CPU usage, which is a typical optimization method of “exchanging CPU for time,” suitable for quickly searching for files in multi-core systems.
3. System Monitoring and Process Management
1. Replacement for top: View System Performance → htop/btop
When checking system resource usage, <span>top</span> is one of the most commonly used commands, quickly displaying information about CPU, memory, load, etc. However, its interface is quite primitive, and the interactive experience is not very user-friendly.
It is more recommended to use the <span>htop</span> command as a replacement, which provides:
- More intuitive color highlighting and bar graphs;
- Support for navigation with arrow keys;
- Support for interactive sorting (e.g., sorting by memory usage);
- Conveniently filter and terminate processes.
<span>top</span> command output display: 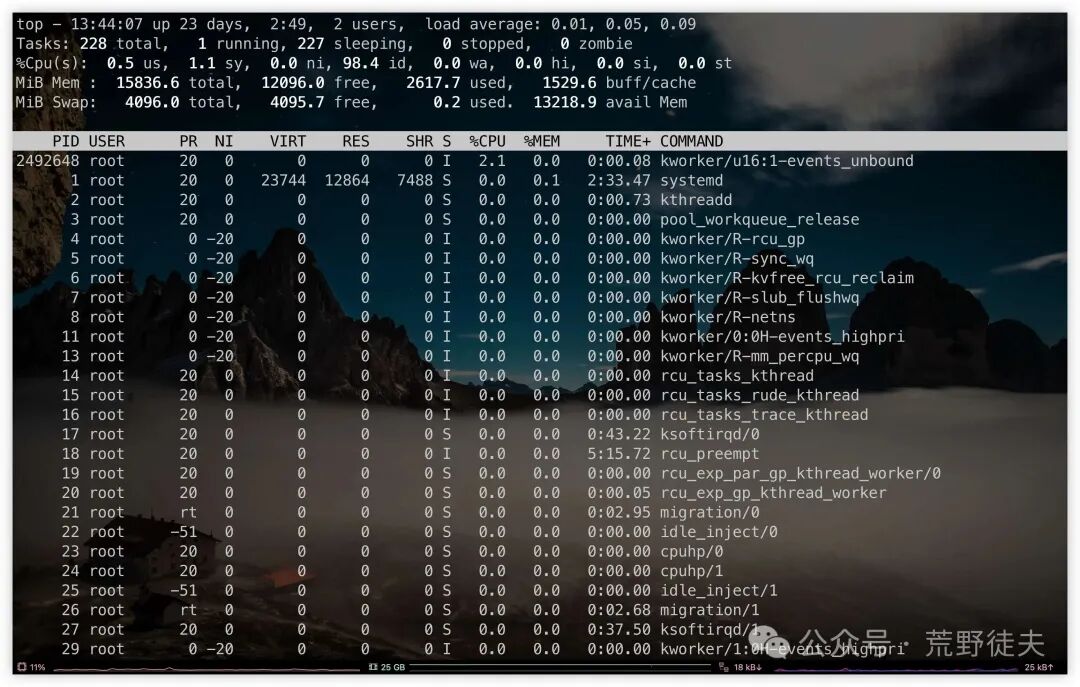
<span>htop</span> command output display: 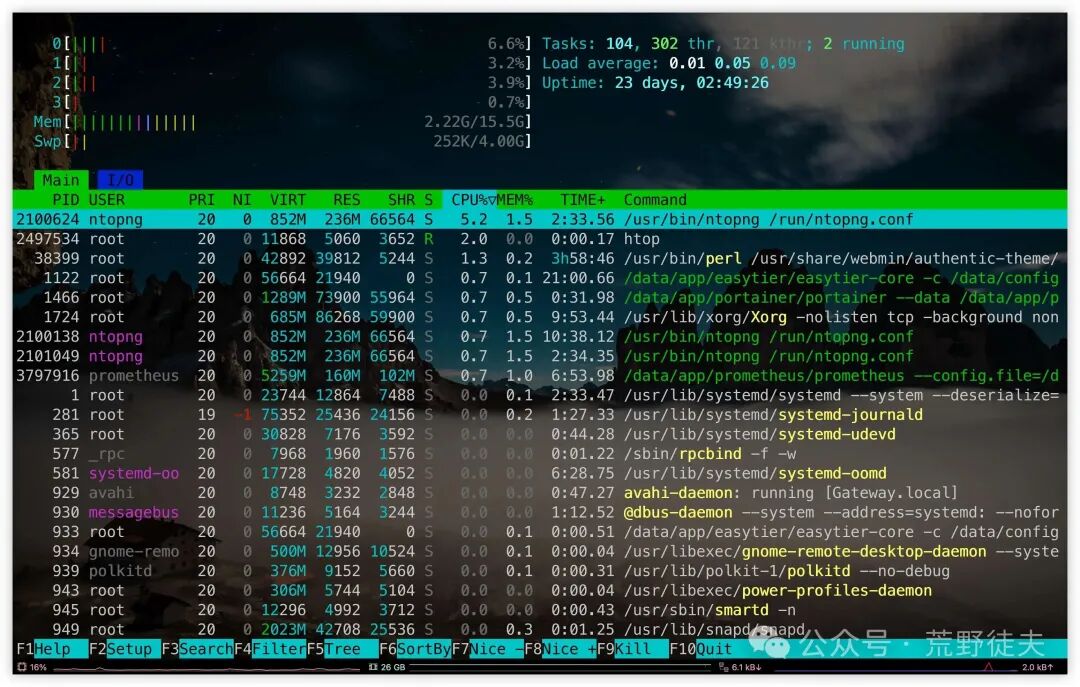
<span>btop</span> command output display: 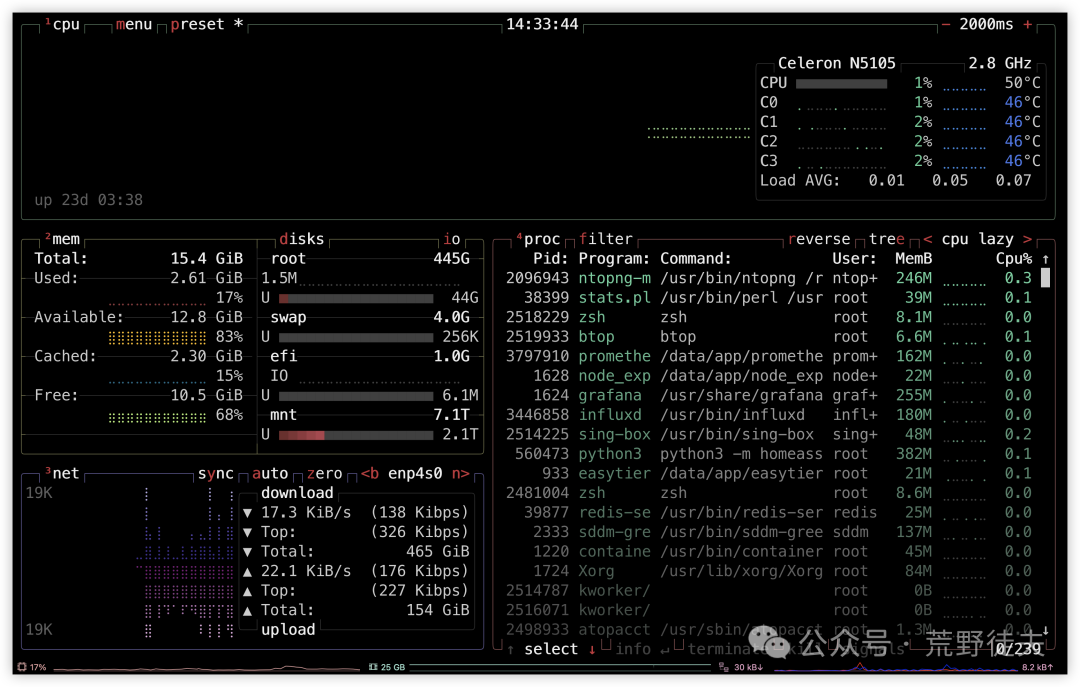
2. Replacement for iotop / iostat: View Real-time Disk IO → atop
🔍 Feature Highlights:
- Similar to top, but focuses more on detailed statistics of disk, network, memory, and CPU;
- Can display:
- Disk read/write volume/IO wait/throughput
- Disk, network, and CPU usage for each process
- Can periodically log performance data, making it a great tool for system bottleneck analysis
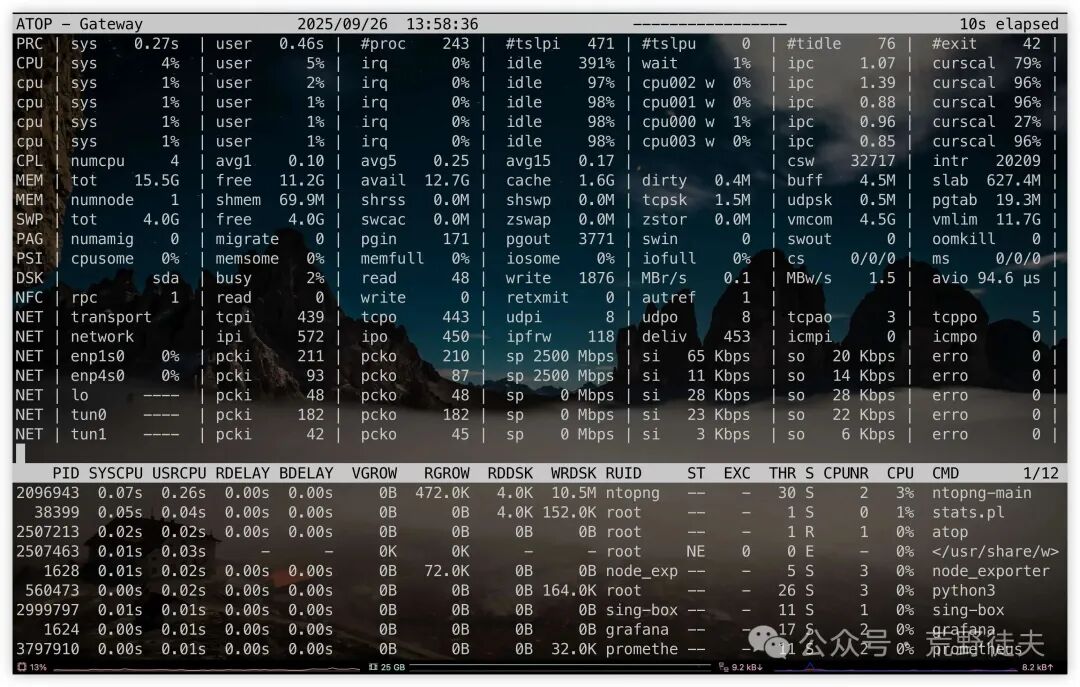
When the system experiences disk I/O anomalies or read/write performance limitations, the atop tool can quickly locate the specific processes that are occupying the disk. By observing the rddsk (read rate) and wrdsk (write rate) fields for each process, one can intuitively determine which processes are reading and writing large amounts of disk data, thereby accurately identifying the culprits causing I/O bottlenecks. This method is more readable and has better tracking capabilities compared to traditional iotop or iostat, making it particularly suitable for daily server maintenance and troubleshooting scenarios.
4. Network and Connection Debugging
1. Replacement for netstat: View Listening Ports → ss
When checking the current host’s listening ports, protocols, and corresponding processes, the traditional <span>netstat -tulnp</span> is commonly used, but it is relatively slow to execute, and some systems do not have it installed by default.<span>ss</span> (Socket Stat) is its more modern replacement, with the following advantages:
- Starts faster and consumes fewer resources;
- Supports a richer set of protocols including TCP/UDP/UNIX sockets;
- Output structure is clearer, with more powerful filtering syntax;
- More efficient in scenarios with a large number of connections.
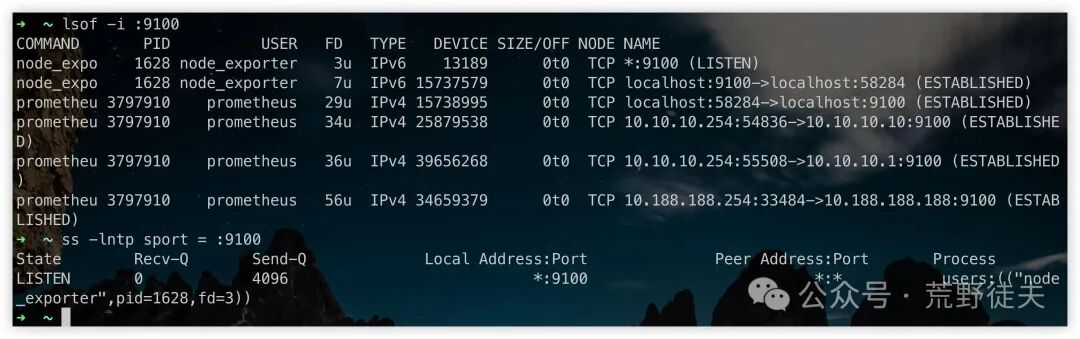
<span>ss</span> is commonly used as a replacement for <span>netstat</span>, and its usage is already very widespread, so it will not be elaborated further. However, it is worth mentioning that it can also effectively replace the usage scenario of <span>lsof -i :<port></span>, which is used to query which service is listening on a specific port, making it very practical.
# lsof
lsof -i :9100

# ss
ss -lntp sport = :9100
2. Replacement for traceroute: Network Path Tracing → mtr
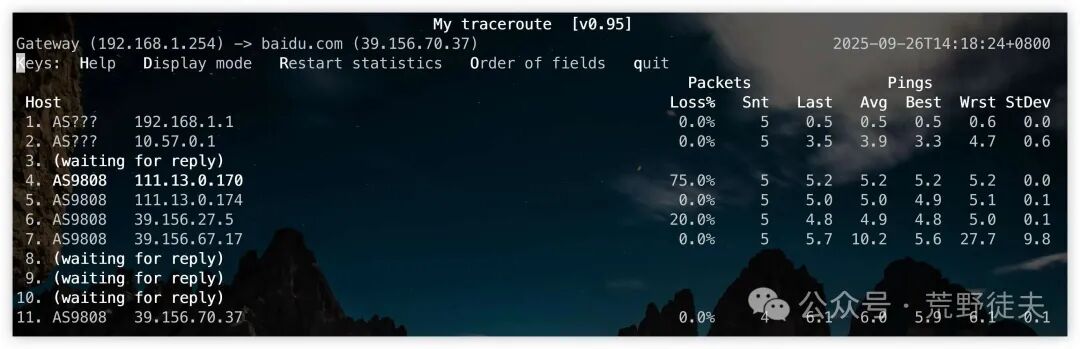
<span>traceroute</span> is typically used to diagnose network paths and locate latency issues at intermediate nodes, but it is just a static one-time probing tool. In contrast, <span>mtr</span> (My Traceroute) combines the advantages of <span>traceroute</span> and <span>ping</span>, providing dynamic and continuous link tracing capabilities.
Compared to <span>traceroute</span>, <span>mtr</span> has the following advantages:
- Real-time refresh, continuously displaying the packet loss rate and latency for each hop;
- Supports multiple modes including ICMP, UDP, TCP;
- More comprehensive and intuitive statistical information, making it easier to troubleshoot network bottlenecks or unstable points.
If you need to check whether there is intermittent packet loss or high latency at a certain hop in the network, mtr is clearly a more efficient choice.
mtr -nz baidu.com
3. Replacement for ping: Network Connectivity Testing → fping/gping
<span>ping</span> is the most commonly used tool for network troubleshooting, used to test whether a target host is reachable. However, it has a common problem: by default, it can only test a single target, which is inefficient.
If you often need to batch test multiple IPs or want clearer graphical feedback, consider the following alternatives:
<span>fping</span>: Supports sending ping requests to multiple target hosts simultaneously, making it very suitable for batch monitoring scenarios. It can be used in scripts to quickly determine the status of hosts.<span>gping</span>: Provides a terminal-based graphical delay display effect, supporting real-time plotting for multiple targets, making it a more user-friendly interactive choice.
# fping network segment liveliness test
fping -a -g -q 10.10.10.0/24
fping -a -g -q < ip.txt

# gping multiple target addresses
gping 119.29.29.29 223.5.5.5
These tools not only improve usage efficiency but also enhance the visual experience and functional details compared to traditional <span>ping</span>.
5. Text Processing and Output Optimization
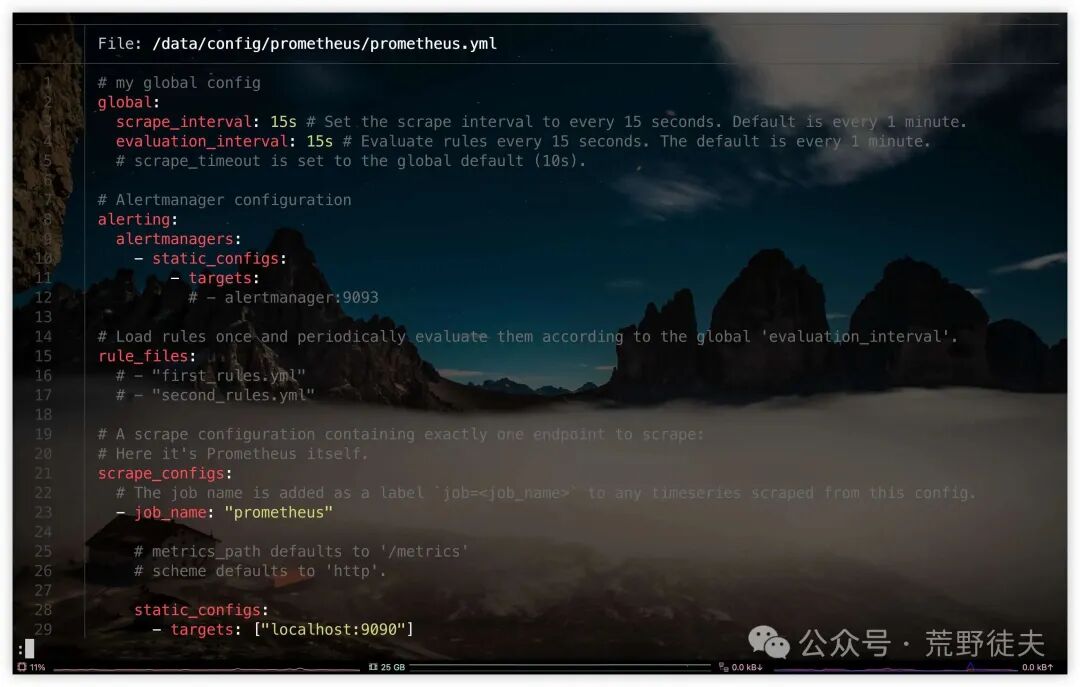
1. Replacement for cat: View File Contents → batcat
<span>cat</span> is the most basic and common command for viewing file contents, but its output is straightforward and lacks highlighting, making it somewhat dull when reading code or configuration files.<span>batcat</span> is an excellent replacement tool:
- Supports syntax highlighting, compatible with most languages and configuration formats;
- Automatically paginates long files, integrating less;
- Displays line numbers, file names, Git modification markers, and more details;
- Default behavior is consistent with cat, making it almost no learning cost to get started.
batcat filename
Whether for reading code, viewing configuration files, or quick debugging,
<span>batcat</span>can provide a better visual experience and operational efficiency. ⚠️ Installation command:<span>atp -y install bat</span>.
2. Replacement for head / tail: View Log Contents → lnav
<span>head</span> and <span>tail</span> are very commonly used text viewing commands, especially when viewing log files, where <span>tail -f</span> is the first choice for many users. However:
- They can only view the top or bottom content of the text;
- They cannot handle multiple log files;
- They do not support structured display or keyword highlighting.
On the other hand, <span>lnav</span> (Log Navigator) is a CLI tool focused on log reading, providing more powerful features:
- ✅ Aggregated viewing of multiple log files;
- ✅ Supports automatic recognition of log timestamps and structured parsing;
- ✅ Supports SQL queries, filtering, keyword highlighting;
- ✅ Can enter auto-refresh mode (-t);
- ✅ Supports navigation and search interactive operations.
Example 1: View a specific log file (color highlighting + automatic format recognition)
lnav /var/log/syslog
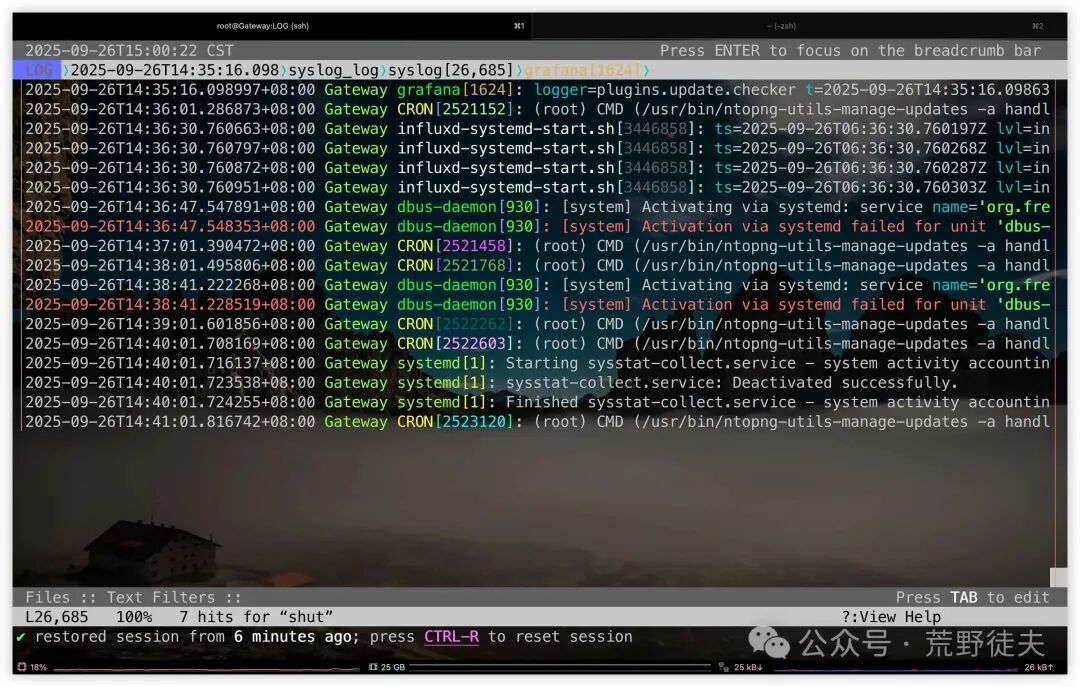 During the log viewing process, pressing the i key allows you to quickly view the basic information and parsing status of the current file, helping users confirm the log source and time range, which is an important reference when troubleshooting issues.
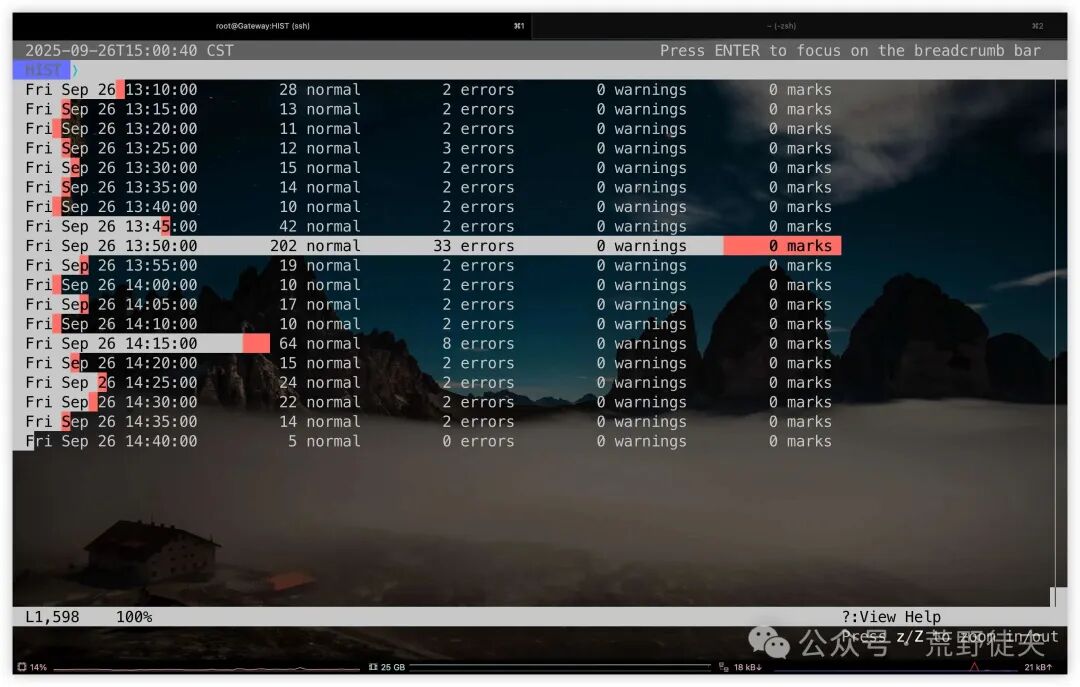
- Automatically recognizes timestamps, levels, fields, and other structures;
- Supports scrolling up and down, syntax highlighting;
- Automatically aggregates logs and highlights ERRORS/WARN
Example 2: Real-time tracking of log files (similar to <span>tail -f</span>)
lnav -t /var/log/syslog
Example 3: Open multiple log files at once and automatically merge and sort
lnav /var/log/*.log
- Supports displaying multiple log files merged by time;
- Very suitable for viewing unified timelines of multiple service logs.
Example 4: Only view logs of a specified level (e.g., error)
lnav -n -c ":filter-in error" /var/log/syslog
6. Have You Been Tempted?
Which of these modern CLI tools caught your eye? Is there any tool you are already using that you find “really good”?
💬 Feel free to share in the comments:
- Which tool do you most want to try?
- Are there any CLI gems you commonly use that were not mentioned in the article? Feel free to recommend!
I will continue to update more practical command line tools, looking forward to discovering and sharing with everyone!