Abstract: As the world’s largest energy consumer and carbon emitter, China faces severe challenges in energy conservation and emission reduction. However, the development of the digital economy is on the rise. This study explores how the development of the digital economy affects energy consumption and CO2 emissions. Using panel data from 30 provinces in China from 2011 to 2019, the entropy method is employed to analyze the level of digital economy development in each province, and a double fixed effects model is constructed to empirically analyze the existence of a positive “U” or inverted “U” relationship between the digital economy and energy consumption, as well as between the digital economy and carbon emissions. The results indicate: ① There are interprovincial and regional disparities in the level of digital economy development in China, with Guangdong and the eastern regions having the highest levels, while Qinghai and the western regions have the lowest; ② There is a significant positive “U” relationship between the digital economy and the scale of energy consumption, as well as between the digital economy and the scale of carbon emissions. Conversely, there is a significant inverted “U” relationship between the digital economy and the structure of energy consumption, energy consumption efficiency, and carbon emission efficiency, indicating that the energy conservation effect of digital economy development is greater than its carbon reduction effect; ③ The nonlinear relationships between the digital economy and the scale of energy consumption, energy consumption structure, energy consumption efficiency, and the scale of carbon emissions and carbon emission efficiency exhibit heterogeneity across the eastern, central, western, and northeastern regions; ④ The nonlinear impacts of digital infrastructure, digital innovation environment, digital user scale, and digital industry scale on the scale of energy consumption, energy consumption structure, and energy consumption efficiency differ, as do their nonlinear impacts on the scale of carbon emissions and carbon emission efficiency. Accordingly, policy recommendations are proposed from three aspects: narrowing the gap in digital economy development levels, formulating digital economy development policies, improving the digital innovation environment, and increasing the scale of digital users, aiming to provide empirical support and theoretical basis for China to develop its digital economy while considering energy conservation and emission reduction effects, thus promoting the achievement of carbon peak and carbon neutrality goals.Over the past forty years of reform and opening up, China has achieved remarkable economic success, with the gross domestic product (GDP) surpassing 100 trillion yuan in 2020 and reaching 114 trillion yuan in 2021. However, the past extensive economic development model has resulted in high energy consumption and severe pollution, making energy conservation and emission reduction the most important means to transform production methods and reduce carbon emissions. According to the “BP Statistical Review of World Energy 2022,” from 1978 to 2021, China’s primary energy consumption increased from 16.65 EJ to 157.65 EJ, with its share of global primary energy consumption rising from 6.11% to 26.5%; China’s energy carbon emissions grew from 1.419 billion tons to 10.523 billion tons, with its share of global carbon emissions increasing from less than 1/10 to nearly 1/3. Additionally, data from the National Bureau of Statistics shows that China’s energy consumption gap is generally expanding, especially during the 13th Five-Year Plan period, where the energy consumption gap exceeded 900 million tons of coal equivalent (tce), indicating a severe situation for energy conservation and emission reduction. Countries around the world are taking proactive actions to achieve the temperature control goals set in the Paris Agreement. As the world’s largest energy consumer and carbon emitter, China, adhering to a responsible major power attitude, has committed to striving to achieve carbon peak before 2030 and carbon neutrality before 2060. Furthermore, to assist in achieving the carbon peak and carbon neutrality goals, the “14th Five-Year Plan for Energy Conservation and Emission Reduction Comprehensive Work Plan” emphasizes improving the energy conservation and emission reduction policy mechanism, significantly increasing energy utilization efficiency, continuously reducing the total amount of pollutant emissions, achieving synergistic effects of energy conservation, carbon reduction, and pollution reduction, winning the battle against pollution prevention and control, continuously improving ecological environment quality, and setting clear targets for 2025, including a 13.5% reduction in energy consumption per unit of GDP compared to 2020 and a non-fossil energy share of around 20%.Currently, the digital economy has become a key driving force for economic development in various countries, changing people’s production and lifestyle. During the 13th Five-Year Plan period, China achieved significant results in the development of the digital economy. In 2020, the scale of China’s digital economy reached nearly 5.4 trillion US dollars, with the added value of its core industries accounting for 7.8% of GDP, effectively promoting sustained and healthy economic and social development. However, can the development of the digital economy effectively promote energy conservation and emission reduction and assist in achieving the “dual carbon” goals? Based on this, this study characterizes energy consumption using the scale of energy consumption, energy consumption structure, and energy consumption efficiency, and carbon emissions using the scale of carbon emissions and carbon emission efficiency, exploring whether there is a positive “U” or inverted “U” relationship between the digital economy and energy consumption, and whether there is a positive “U” or inverted “U” relationship between the digital economy and carbon emissions. If such relationships exist, what is the relative position of the current level of digital economy development to the inflection point? What are the specific impacts on energy consumption and carbon emissions? Currently, existing literature has not conducted a comprehensive and systematic study on these issues. Answering these questions is of significant practical and long-term importance for China’s development of the digital economy, effectively promoting energy conservation and emission reduction, and assisting in achieving the “dual carbon” goals.
1 Literature Review
Driven by the digital wave, researchers have begun to focus on the relationship between the digital economy and energy consumption. However, there is currently limited empirical research on the digital economy and energy consumption, mainly concentrated on the impact of information and communication technology, informatization, and internet development on energy consumption. There are two mainstream views on the energy effects of information and communication technology: one categorizes it into three stages: the direct production of “e-waste,” improvement of energy efficiency, and the formation of the “rebound effect”; the other summarizes the positive and negative impacts of information and communication technology on energy consumption as income effects and substitution effects. Regarding the income effect, the application of information and communication technology can enhance economic vitality, thereby increasing energy consumption. In terms of the substitution effect, information and communication technology plays a key role in improving energy efficiency, significantly reducing total energy demand, thereby reducing total energy consumption. However, the question of which effect dominates remains unresolved. Proponents of the substitution effect argue that the application of information and communication technology not only improves productivity and economic output but also enhances energy utilization efficiency in the production process, reduces transportation volume, and decreases energy demand, thus reducing greenhouse gas emissions, particularly significantly lowering the use of non-electric energy. Informatization can significantly improve energy utilization efficiency, promote a reduction in energy consumption intensity, and thus potentially reduce energy consumption. However, since the information and communication industry is energy-intensive, the production, use, and disposal of related products are accompanied by substantial energy consumption. Proponents of the income effect argue that the development of the digital economy increases the scale of energy consumption and raises per capita energy consumption. In summary, the development of the digital economy has both suppressive and growth effects on energy consumption, and existing research has confirmed a significant positive “U” relationship between the development of the information and communication industry and energy consumption.With the development of the digital economy, an increasing number of scholars have also begun to pay attention to the relationship between the digital economy and carbon emissions, mainly reflected in the impact of digital technology, internet development, and the digital economy on carbon emissions. The rapid development of digital technology and its industries has led to an increase in electricity usage, driving carbon emissions growth. However, some scholars hold different views, arguing that the development of digital technology is conducive to reducing greenhouse gas emissions, thereby improving environmental quality. For example, increasing internet penetration and investing in ICT infrastructure can significantly reduce carbon emissions. Information and communication technology has a significant negative impact on CO2 emissions. Carbon trading platforms built on digital technology not only help promote carbon reduction and lower carbon emission intensity but are also considered an important pathway to achieve carbon neutrality. Regarding internet development, it can not only suppress the resource curse but also significantly improve energy and carbon emission performance. The development of the digital economy significantly reduces various pollutant emissions, drives the development of low-carbon industries, and reduces carbon emission intensity, but this effect exhibits regional heterogeneity characterized by “East suppression, Central promotion, and West absence.” In summary, the development of the digital economy can effectively suppress carbon emissions and improve carbon emission performance, and there is an inverted “U” relationship between the development of the digital economy and carbon emissions. The development of the digital economy promotes the level of total factor carbon productivity in China and can become a new energy source for the country to improve its green development level.In conclusion, existing literature on the digital economy and its relationship with energy consumption and carbon emissions provides useful references but also has shortcomings: first, most studies focus on the linear impact of information and communication technology on energy consumption and carbon emissions, lacking a comprehensive evaluation of the level of digital economy development and its nonlinear relationship with energy consumption and carbon emissions; second, existing research tends to analyze the relationship between the digital economy and energy consumption scale, energy consumption structure, energy consumption efficiency, or the digital economy and carbon emission scale, carbon emission efficiency separately, lacking a comprehensive analysis of the impact of the digital economy on energy consumption and carbon emissions. Based on this, the potential marginal contributions of this study are mainly twofold: first, on the basis of improving the comprehensive evaluation of the digital economy, it explores the nonlinear impact of the digital economy on energy consumption from the aspects of energy consumption scale, energy consumption structure, and energy consumption efficiency, and analyzes the nonlinear relationship between the digital economy and carbon emissions from the aspects of carbon emission scale and carbon emission efficiency, and compares the energy conservation effect and emission reduction effect of the digital economy; second, based on the inflection points of the nonlinear impact of the digital economy on energy consumption and carbon emissions, it provides suitable local digital economy development policies for each province and region according to the current level of digital economy development, thereby maximizing the energy conservation and emission reduction benefits of digital economy development.
2 Theoretical Analysis
2.1 The Impact Mechanism of the Digital Economy on Energy Consumption
The rapid development of the digital economy is profoundly changing our production and lifestyle. In terms of production methods, the development of the digital economy optimizes production processes, promoting efficient integration of production, distribution, circulation, and consumption through data flow, thereby reducing energy consumption. Specifically, the widespread application of digital technologies and platforms, such as internet technology, in enterprise R&D, design, manufacturing, market operation, and management optimizes energy utilization technologies and production processes, improves energy utilization efficiency, and reduces energy consumption. The application of digital technology in the new energy sector accelerates the promotion and popularization of new energy, increasing the proportion of new energy consumption, thereby optimizing the energy consumption structure. Energy enterprises relying on advanced digital technologies deepen the application of industrial internet, big data, cloud computing, cloud storage, and artificial intelligence to build a new smart energy business model, promoting digital operation and management across all aspects of enterprises. This not only helps reduce energy losses during conversion and transportation but also facilitates effective energy allocation and maximization of utilization, potentially promoting energy savings. Meanwhile, energy enterprises can achieve real-time data collection of production and precise management of energy consumption, thus enabling personalized energy use plans based on supply-side demand to avoid excessive service, driving up individual and household energy utilization rates, potentially achieving energy savings and further reducing environmental pollution. In terms of lifestyle, the development of the digital economy is one of the important ways to meet people’s growing needs for a better life. The development of the digital economy helps break down spatial and temporal barriers, enhances the level of resource accessibility, improves the convenience of life for the public, and meets the diverse and personalized needs of the people. During the current global pandemic of COVID-19, the development of various online meeting platforms has enabled energy experts and scholars worldwide to discuss current energy issues in a timely manner and formulate widely applicable response plans, thereby promoting the rationalization of energy consumption. At the same time, as internet technology matures and internet platforms grow, workers can choose to work from home, which not only helps save energy consumption in office spaces but also reduces energy consumption caused by commuting. Additionally, the widespread application of digital technology in public transportation, ride-hailing, and private vehicles can effectively reduce the empty driving rate of public transport and ride-hailing services, decrease waiting times at traffic lights for private vehicles, and optimize travel route selection through real-time sharing of road information to alleviate traffic congestion, thereby potentially reducing energy consumption. With the popularization of 5G communication technology and smartphones, the rise of online sales platforms such as JD.com and Taobao, as well as video live streaming platforms like Douyin and WeChat, has changed traditional shopping, learning, entertainment, exercise, and energy consumption habits, thus influencing energy consumption.However, due to the marginal diminishing effect of digital resources as input factors and the rebound effect of energy consumption, there may be a nonlinear relationship between the development of the digital economy and energy consumption. In the initial stage of digital economy development, the marginal energy-saving effect of the digital economy is significant, and the application of digital technology in various aspects leads to a decrease in the scale of energy consumption, improvement in energy consumption structure, and enhancement of energy consumption efficiency. In the growth stage of digital economy development, the marginal energy-saving effect gradually declines, and the benefits of reduced energy consumption scale, optimized energy consumption structure, and improved energy consumption efficiency due to changes in production and lifestyle brought about by the digital economy gradually reach their optimum. In the mature stage of digital economy development, the marginal energy-saving effect of the digital economy turns negative, as the development of the digital economy increases energy consumption due to economic growth, and it is also an energy-intensive industry. The rebound effect of energy consumption leads to an increase in total social energy consumption demand alongside the expansion of the digital economy, thereby driving up the scale of energy consumption. The application of digital technology in the new energy sector has also matured, making it difficult to further promote the optimization of energy consumption structure. The increase in energy consumption demand may still need to be supported by coal to ensure stable energy supply, leading to a deterioration in the energy consumption structure. At this stage, the application of digital technology has reached its peak, and the improvement in energy utilization efficiency has reached its maximum, but the significant increase in energy consumption scale and deterioration in energy consumption structure may drag down energy consumption efficiency, resulting in a decline in efficiency.
2.2 The Impact Mechanism of the Digital Economy on Carbon Emissions
The digital economy itself belongs to a low-carbon economy, encompassing five major industries: internet, software, telecommunications, computer basic technology, and integrated hardware and software, characterized by “low energy consumption, high output, and high returns.” Its development is inherently conducive to promoting CO2 reduction. The changes in production and lifestyle brought about by the digital economy not only affect energy consumption but also impact carbon emissions. Energy consumption has a significant positive impact on CO2, and the impact of the digital economy on energy consumption will also transmit to carbon emissions. The widespread application of digital technology in energy exploration, production, transportation, distribution, and usage helps to deeply analyze energy consumption and energy-saving potential at both the production and consumption ends, facilitating the full transformation and optimization of professional technologies and forming an efficient digital energy network. This is beneficial for accelerating the construction of an efficient, clean, and low-carbon energy system based on safety guarantees, promoting industrial enterprises to use green energy, and reducing carbon emissions. At the same time, the innovation and application of carbon reduction digital technologies promote the cleaning of production processes and drive CO2 reduction. Particularly, as major energy consumers, digital economy enterprises implementing low-carbon operations impact CO2 emissions and influence the CO2 emissions of other types of enterprises through digital technology output. Additionally, with the increasing maturity of digital technology, the improvement of carbon accounting and carbon credit systems, and the growing popularity of afforestation, the area of green land is gradually increasing, thus promoting the increase of carbon sinks and subsequently affecting CO2 emissions. The construction of a carbon peak big data platform can achieve precise measurement, supervision, statistics, and assessment of energy reduction and carbon reduction situations in various regions. If this platform is widely used in production and life, it can help reduce unit energy consumption, thereby effectively promoting carbon reduction.In terms of lifestyle, similar to the impact of the digital economy on energy consumption, the promotion and application of digital technology reduce unnecessary offline economic activities through platforms such as Email, WeChat, Alipay, Douyin, and Tencent Meetings, thereby decreasing the frequency and extent of offline activities and reducing CO2 emissions caused by offline meetings and commuting. The promotion and application of new energy vehicles reduce exhaust emissions from fuel vehicles, thus decreasing CO2 emissions. Moreover, the wide coverage of mobile communication users and the use of short video platforms for CO2 reduction and environmental protection publicity help enhance the effectiveness of environmental protection advocacy, raise people’s awareness of carbon reduction, and cultivate carbon reduction habits. The application of internet platforms has led to the rise of online shopping, influencing and changing people’s consumption behaviors, thereby affecting the supply of environmentally friendly and non-environmentally friendly products, ultimately promoting CO2 reduction.Similarly, due to the marginal diminishing effect of digital resources as input factors, there may also be a nonlinear relationship between the digital economy and carbon emissions. Energy consumption is the main source of CO2 emissions, and the impact of the development of the digital economy at various stages on energy consumption will also transmit to carbon emissions. In the initial stage of digital economy development, the marginal carbon reduction effect of the digital economy is significant, as its development promotes a decrease in energy consumption scale, improvement in energy consumption structure, and enhancement of energy consumption efficiency, all of which are conducive to reducing the scale of CO2 emissions. Additionally, as it belongs to a low-carbon economy, it further promotes the reduction of CO2 emissions. As a key force in the economic development of countries worldwide, the digital economy can drive economic development and stimulate economic growth, thereby leading to a dual effect of promoting a decrease in CO2 emissions and promoting economic growth, which results in a decline in carbon emission efficiency. In the growth stage of digital economy development, the marginal effects of carbon reduction and economic growth both decrease, and the roles of promoting a decrease in carbon emission scale and stimulating economic growth gradually reach their maximum, further enhancing carbon emission efficiency to its peak. In the mature stage of digital economy development, the marginal effects of carbon reduction and economic growth turn negative, and increasing input factors of the digital economy no longer promote a decrease in carbon emission scale and economic growth. Moreover, the total carbon reduction effect of the digital economy development is likely to be less than the total carbon increase effect driven by economic growth, which may lead to a decline in carbon emission efficiency.
3 Model Construction
3.1 Model Specification
To verify the impact of the digital economy on the scale of energy consumption, energy consumption structure, energy consumption efficiency, carbon emission scale, and carbon emission efficiency, a double fixed effects benchmark regression model is constructed:
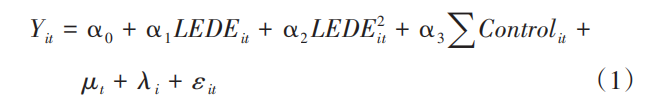
Where: The explained variables Yit are the energy consumption scale (ECSC), energy consumption structure (ECST), energy consumption efficiency (ECEF), carbon emission scale (CESC), and carbon emission efficiency (CEEF) for province i in year t; the core explanatory variable LEDEit represents the level of digital economy development in province i in year t. To verify whether there is a positive “U” or inverted “U” relationship between the core explanatory variable and the explained variables, the square term of the core explanatory variable is added. The control variables Controlit include industrial structure (INDS), population size (POPS), per capita disposable income of urban residents (LEIN), level of openness (LEOP), and technological innovation (TEIN); αo is the constant term, μt is the time fixed effect, λi is the individual fixed effect, and εit is the random error term.
3.2 Variable and Data Description
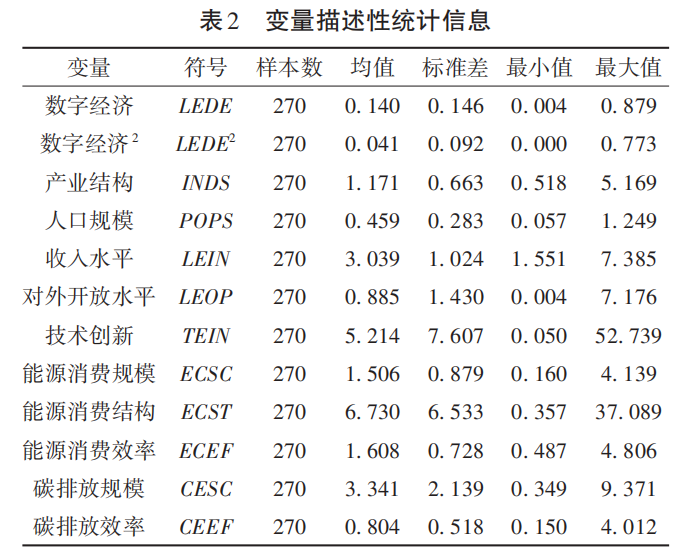
3.2.1 Explained Variables
(1) Energy Consumption (EC). Not only does the scale of energy consumption affect the scale of carbon emissions and carbon emission efficiency, but changes in energy consumption structure and the level of energy consumption efficiency also impact the scale of carbon emissions and carbon emission efficiency. Therefore, this study references the research of Wu et al. and selects energy consumption scale (EC-SC), energy consumption structure (ECST), and energy consumption efficiency (ECEF) as proxy variables for energy consumption. ECSC is represented by the total energy consumption. EC-ST is represented by the ratio of natural gas consumption to total energy consumption. Compared to raw coal and crude oil, natural gas has lower pollution emissions, and a higher proportion of natural gas indicates a better energy consumption structure. ECEF is represented by energy consumption per unit of GDP, where more GDP created per unit of energy consumption indicates higher energy consumption efficiency, which is more conducive to carbon reduction.(2) Carbon Emissions (CE). Current research on carbon emissions tends to examine either the scale of carbon emissions or carbon emission efficiency separately, but there is little literature that comprehensively examines both as proxy variables for carbon emissions. Therefore, similar to energy consumption, this study selects carbon emission scale (CESC) and carbon emission efficiency (CEEF) as proxy variables for carbon emissions to explore whether the digital economy effectively promotes CO2 reduction.
3.2.2 Core Explanatory Variable
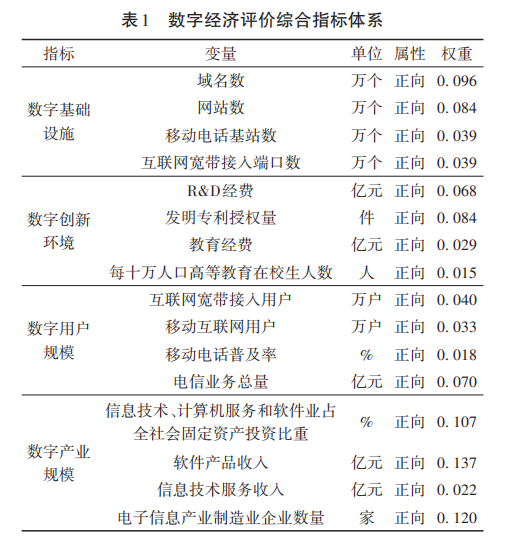
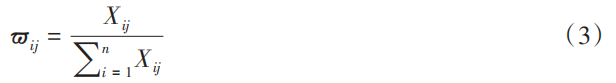
Digital Economy (LEDE). The digital economy is characterized by data resources as the main factor, information networks as the key carrier, focusing on promoting the integrated application of information and communication technology and the digital transformation of all factors, emphasizing the unity of fairness and efficiency, and becoming a new economic form following agricultural and industrial economies. This study builds a comprehensive indicator system for evaluating the digital economy based on the connotation of the digital economy, referencing the research of Zhao Tao et al., Wang Jun et al., and Bai Peiwen et al., focusing on four dimensions: digital infrastructure, innovation environment, user scale, and industry scale (Table 1). Digital infrastructure reflects the infrastructure conditions for digital economy development, mainly measured by four indicators: the number of domain names, the number of websites, the number of mobile phone base stations, and the number of internet broadband access ports; the digital innovation environment reflects the level of digital technology innovation, mainly including R&D investment (R&D funding), R&D output (number of authorized invention patents), talent training expenditure (education funding), and talent reserve (number of higher education students per 100,000 population); the digital user scale mainly measures the level of user digitization, covering internet broadband access users, mobile internet users, mobile phone penetration rate, and total telecommunications business volume; the digital industry scale mainly reflects the development level of the digital economy’s basic industries, utilizing the proportion of information technology, computer services, and software industries in total fixed asset investment, software product revenue, information technology service revenue, and the number of electronic information manufacturing enterprises for accounting.The subjective weighting method assigns weights based on human judgment of the relative importance of indicators, while the objective weighting method assigns weights based on the original information of indicators. Given that the subjective weighting method is easily influenced by human subjective factors, leading to inaccurate weight assignments that do not well reflect the comprehensive index of indicators, the entropy method from the objective weighting method is used to assign weights to the indicators.
Due to significant dimensional and magnitude differences among the 16 basic indicators, standardization is necessary to ensure comparability and accuracy of the comprehensive index. Given that there are no negative indicators, only the standardization formula for positive indicators is provided:

Where min{xj} is the minimum value of indicator j in each year, max{xj} is the maximum value of indicator j in each year, and x*ij is the result after standardizing the data to remove dimensions.To calculate the proportion of indicator j in year i, it is represented by ϖij:
To calculate the information entropy of indicator j, it is:

To calculate the redundancy of information entropy of indicator j:

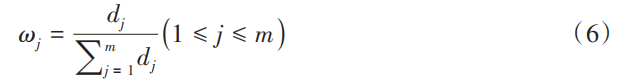
Based on dj, the weight of indicator j is calculated as:
Finally, the level of digital economy development LEDEi for each province is calculated as:

LEDEi represents the level of digital economy development in province i in year t, ranging from 0 to 1. A larger LEDEi indicates a higher level of digital economy development, while a smaller LEDEi indicates a lower level.
3.2.3 Control Variables
(1) Industrial Structure (INDS). Generally, the industrial structure is measured by the ratio of the added value of the tertiary industry to that of the secondary industry. Generally, a larger proportion of the secondary industry indicates higher energy consumption and carbon emissions. Therefore, a larger value of the industrial structure indicator is more favorable for energy conservation and emission reduction.(2) Population Size (POPS). A larger population corresponds to a larger scale of energy consumption, leading to increased carbon emissions. The population size is represented by the year-end resident population of each province; a smaller population indicates less energy consumption to meet diverse needs, which is more favorable for carbon reduction.(3) Income Level (LEIN). The choice of energy consumption varieties by households is influenced by income, and income growth helps promote the energy transition of households, thereby driving the overall energy transition of society, increasing the proportion of clean energy, and reducing carbon emissions. Therefore, per capita disposable income of urban residents is used to represent income level.(4) Level of Openness (LEOP). The level of openness mainly affects domestic economic growth and environmental products through import and export trade, thereby influencing energy consumption and carbon emissions. Therefore, the total import and export volume of each province is used to measure the level of openness.(5) Technological Innovation (TEIN). Other conditions being equal, a higher level of technological innovation in energy utilization leads to lower energy consumption per unit of output, and simultaneously, lower CO2 emissions per unit of output. The number of authorized patent applications usually represents the innovation level of a region, so this study uses it to represent technological innovation.The data used in this article is panel data from Chinese provinces from 2011 to 2019. Due to data availability and other reasons, the study does not cover Hong Kong, Macao, Taiwan, and Tibet. Data for each indicator mainly comes from the “China Statistical Yearbook,” provincial yearbooks, and the CEADs database. For individual years with missing data for certain indicators, interpolation or moving average methods are used to supplement. Descriptive statistical results of each variable are shown in Table 2.
4 Empirical Analysis
4.1 Evaluation of Digital Economy Development Level
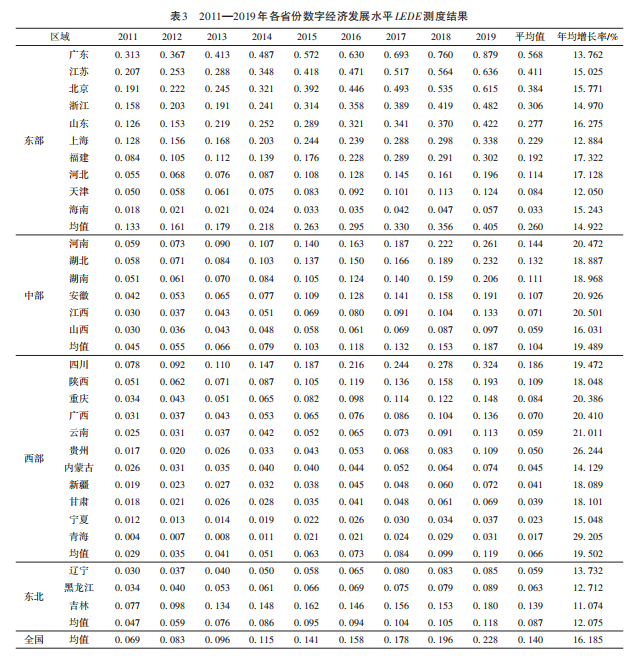
Using the entropy method formula, the digital economy development level (LEDE) of each province from 2011 to 2019 is calculated, as shown in Table 3. It can be seen that LEDE exhibits significant spatiotemporal heterogeneity. The average LEDE in China increased from 0.069 to 0.228, with an average annual growth rate of 16.185%. The LEDE of each province has significantly risen. In 2019, Guangdong, Jiangsu, Beijing, Zhejiang, Shandong, and Shanghai were in the leading group for LEDE; Qinghai, Guizhou, Yunnan, Anhui, Jiangxi, Henan, Guangxi, and Chongqing had outstanding annual average growth rates, all exceeding 20%, showing rapid development and ranking in the LEDE chasing group. Although there is a significant catching-up trend, it is undeniable that interprovincial disparities remain prominent. For instance, in 2019, the LEDE of Guangdong (0.879) was 28.35 times that of Qinghai (0.031), indicating that the interprovincial gap in LEDE in China remains substantial. The LEDE of the four major regions shows a trend of annual increase. In terms of average annual growth rate, the western region is the fastest at 19.502%, followed by the central region at 19.489%, the eastern region at 14.922%, and the northeastern region at 12.075%. However, in terms of LEDE, the eastern region had the highest in 2019 at 0.405, followed by the central region at 0.187, the western region at 0.119, and the northeastern region at 0.118, which is very close to the western region. This indicates that the eastern region has a high LEDE, while the central and western regions have relatively low LEDEs, thus their faster LEDE growth rates are understandable. There are also significant disparities in digital economy development among provinces within the same region. In terms of the annual average value of digital economy development level, Guangdong and Jiangsu lead in the eastern region, while Tianjin and Hainan are at the bottom. The annual average LEDE of Guangdong (0.568) is 17.21 times that of Hainan (0.033). In the central region, Henan and Hubei are leading, while Jiangxi and Shanxi are lagging, with the annual average LEDE of Henan (0.144) being 2.44 times that of Shanxi (0.059). In the western region, Sichuan and Shaanxi are at the forefront, while Ningxia and Qinghai are at the back, with the annual average LEDE of Sichuan (0.186) being 10.94 times that of Qinghai (0.017). In the northeastern region, Liaoning ranks first (0.139) and Jilin ranks third (0.059), with the former being 2.36 times that of the latter. It can be seen that the digital economy development level in the eastern region has the largest gap, followed by the western region, the central region third, and the northeastern region last. Compared to the national average level of digital economy development, all three northeastern provinces are below average, while only Sichuan in the western region and Henan in the central region exceed the national average level of digital economy development. In the eastern region, all provinces except Hebei, Tianjin, and Hainan are above the national average level of digital economy development, indicating that the eastern region is the leader in national digital economy development. To achieve regional coordinated development, China has successively introduced a series of policy measures, such as the rise of the eastern region first and the development of the western region, which have improved the economic development levels of various regions. At the same time, with the in-depth application of internet platforms, artificial intelligence, cloud storage, and big data, the digital economy has become another important growth pole for high-quality economic development in China. Due to policy orientation and resource endowments, the LEDE of the four major regions varies significantly.
4.2 Benchmark Regression Analysis
4.2.1 Analysis of the Impact of the Digital Economy on Energy Consumption
To control for macroeconomic environment and individual differences that do not change over time, a double fixed effects model is used for regression. Table 4 presents the benchmark regression results of the impact of the digital economy on energy consumption. In models (1), (3), and (5), control variables are not added, while in models (2), (4), and (6), control variables are included. From the regression results of models (1) and (2), it can be seen that the coefficient of the linear term of the digital economy is negative, while the coefficient of the quadratic term is positive, indicating a significant positive “U” relationship between the digital economy and the scale of energy consumption, with the inflection point calculated to be 0.613 (the calculation method for all subsequent inflection points is the same and will not be repeated). Combining with Table 3, it can be seen that currently, the digital economy development levels across the country and the four major regions are all on the left side of the inflection point, indicating that improving the average level of digital economy development across the country and the four major regions is beneficial for energy conservation. However, in terms of provinces, the digital economy development level in Guangdong has been on the right side of the inflection point since 2016, while Jiangsu and Beijing have been on the right side since 2019. The remaining provinces have always been on the left side of the inflection point during the observation period, indicating that the digital economy development levels among provinces are disparate, leading to differences in their impact on the scale of energy consumption. This may be because when the digital economy develops rapidly and reaches a high level, the reduction in energy consumption brought about is less than the increase in energy consumption caused by economic growth, and due to the rebound effect of energy consumption, further enhancement of the digital economy at a certain level will lead to an expansion of the scale of energy consumption. Similarly, from the regression results of models (3) and (4), as well as models (5) and (6), it can be seen that the coefficient of the linear term of the digital economy is positive, while the coefficient of the quadratic term is negative, indicating a significant inverted “U” relationship between the level of digital economy development and energy consumption structure and energy consumption efficiency, with inflection points of 1.538 and 0.898, respectively. The entire country, the four major regions, and all provinces are located on the left side of the inflection points, indicating that improving the level of digital economy development in China at this stage is beneficial for optimizing energy consumption structure and enhancing energy consumption efficiency. This may be due to the fact that the application of digital technology in the new energy sector is still in its early stages, and the speed of new energy development is limited by natural resource conditions and other factors, so the efficiency and structural effects of digital technology have not yet fully manifested.

The development of the digital economy exhibits a nonlinear relationship with the scale of energy consumption, energy consumption structure, and energy consumption efficiency, indicating that the negative impact of the digital economy on energy consumption has a diminishing marginal effect. When LEDE < 0.613, enhancing the level of digital economy development can optimize energy consumption structure, improve energy consumption efficiency, and reduce the scale of energy consumption; when 0.613 ≤ LEDE < 0.898, enhancing the level of digital economy development can optimize energy consumption structure and improve energy consumption efficiency but cannot reduce the scale of energy consumption; when 0.898 ≤ LEDE < 1.538, enhancing the level of digital economy development can only optimize energy consumption structure but cannot improve energy consumption efficiency or reduce the scale of energy consumption; when LEDE ≥ 1.538, enhancing the level of digital economy development cannot improve energy consumption structure, energy consumption efficiency, or reduce the scale of energy consumption. Therefore, when the level of digital economy development is less than 1.538, China should continue to enhance the level of digital economy development to maximize the impact of the digital economy on energy consumption.
4.2.2 Analysis of the Impact of the Digital Economy on Carbon Emissions
Table 5 presents the benchmark regression results of the impact of the digital economy on carbon emissions. Similar to the models in Table 4, models (1) and (3) do not include control variables, while models (2) and (4) include control variables. From the regression results of models (1) and (2), it can be seen that the coefficient of the linear term of the digital economy is negative, while the coefficient of the quadratic term is positive, indicating a significant positive “U” relationship between the digital economy and the scale of carbon emissions, with the inflection point at 0.448. In terms of the entire country and the four major regions, the current levels of digital economy development are all on the left side of the inflection point, indicating that enhancing the level of digital economy development at this stage is beneficial for reducing carbon emissions across the country and in each region. However, in terms of provinces, Guangdong, Jiangsu, Beijing, and Zhejiang have reached the right side of the inflection point in 2014, 2016, 2017, and 2019, respectively, while the remaining provinces have remained on the left side of the inflection point throughout the analysis period, indicating significant disparities in the level of digital economy development among provinces and differences in their impact on the scale of carbon emissions. Similarly, from the regression results of models (3) and (4), it can be seen that the coefficient of the linear term of the digital economy is positive, while the coefficient of the quadratic term is negative, indicating a significant inverted “U” relationship between the level of digital economy development and carbon emission efficiency, with the inflection point at 1.080. The entire country, the four major regions, and all provinces are located on the left side of the inflection point, indicating that enhancing the level of digital economy development is conducive to improving the overall carbon emission efficiency in China. Similar to energy consumption, the possible reason is that when the level of digital economy development reaches a certain level, the carbon reduction effect of enhancing LEDE is smaller than the carbon increase effect brought about by economic growth, resulting in an increase in total carbon emissions. However, at this point, the economic growth effect of the digital economy has not yet reached its maximum, so continuing to enhance the level of digital economy development is beneficial for improving carbon emission efficiency. When the economic growth effect also reaches its maximum, further enhancement of LEDE will not improve carbon emission efficiency.
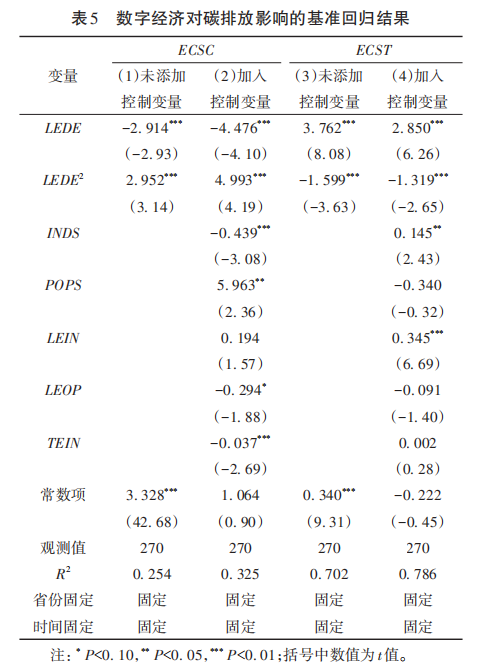
The nonlinear relationship between the digital economy and the scale of carbon emissions and carbon emission efficiency indicates that there is a diminishing marginal effect of the digital economy on carbon emissions. When LEDE < 0.448, enhancing the level of digital economy development is beneficial for reducing carbon emission scale and improving carbon emission efficiency; when 0.448 ≤ LEDE < 1.080, enhancing the level of digital economy development can improve carbon emission efficiency but cannot reduce carbon emission scale; when 1.080 ≤ LEDE, enhancing the level of digital economy development will neither reduce carbon emission scale nor improve carbon emission efficiency. Therefore, when the level of digital economy development is less than 1.080, China still needs to vigorously develop the digital economy to maximize the carbon emission impact effect of the digital economy.
4.2.3 Comparative Analysis of the Impact of the Digital Economy on Energy Consumption and Carbon Emissions
Both the digital economy and energy consumption efficiency and the digital economy and carbon emission efficiency exhibit significant inverted “U” relationships. However, the inflection point for the digital economy and energy consumption efficiency (1.538) is greater than that for the digital economy and carbon emission efficiency (1.080), indicating that the marginal incremental decrease in energy consumption efficiency per unit increase in the level of digital economy development is slower than that of carbon emission efficiency. That is, when 1.080 ≤ LEDE < 1.538, enhancing the level of digital economy development can still improve energy consumption efficiency but cannot reduce carbon emission efficiency. Similarly, both the digital economy and energy consumption scale and the digital economy and carbon emission scale exhibit significant positive “U” relationships, but the inflection point for the digital economy and energy consumption scale (0.613) is greater than that for the digital economy and carbon emission scale (0.448), indicating that the negative impact of the digital economy on carbon emission scale has a faster marginal diminishing speed. When 0.448 ≤ LEDE < 0.613, enhancing the level of digital economy development can significantly reduce energy consumption scale but increase carbon emission scale. Through comparative analysis, it is found that when the carbon reduction effect of the digital economy development reaches its maximum, the energy conservation effect of the digital economy has not yet reached its maximum. Therefore, corresponding digital economy development policies should be formulated based on the actual economic development conditions of each region, considering the size of the carbon increase effect and the energy conservation carbon reduction effect of the digital economy. This may be due to the widespread application of internet technology and internet platforms in the energy sector, promoting the digital operation and management of fossil energy and new energy, directly affecting energy supply and demand, leading to the energy conservation effect of the digital economy being more persistent than its carbon reduction effect.
4.3 Robustness Test
To verify the robustness of the research conclusions, discussions are conducted from six aspects. ① Replacing the core explanatory variable. The measurement method of the digital economy is changed to factor analysis, and the energy conservation and emission reduction effects of the digital economy are re-examined based on factor scores. ② Replacing control variables. Technological innovation is replaced with green technology innovation, using the number of green patent authorizations to represent green technology innovation, which better reflects environmental protection aspects. ③ Following the robustness test method of Shi Bingzhan et al., the logarithm of each explanatory variable is taken before regression. In the previous text, since some variables among the explanatory and explained variables are ratios rather than absolute values, logarithmic transformation was not performed. However, taking the logarithm of each variable leads to a more normal distribution of data and is more conducive to obtaining robust estimation results. ④ Conducting a two-tailed trimming treatment at the 1% quantile for each variable. ⑤ Regressing again after excluding Qinghai Province, which started late and developed slowly in the digital economy. ⑥ Regressing again after excluding the four municipalities directly under the central government: Beijing, Tianjin, Shanghai, and Chongqing. The robustness test results are generally consistent with the previous benchmark regression results (due to space limitations, results are omitted and available upon request).
4.4 Heterogeneity Analysis
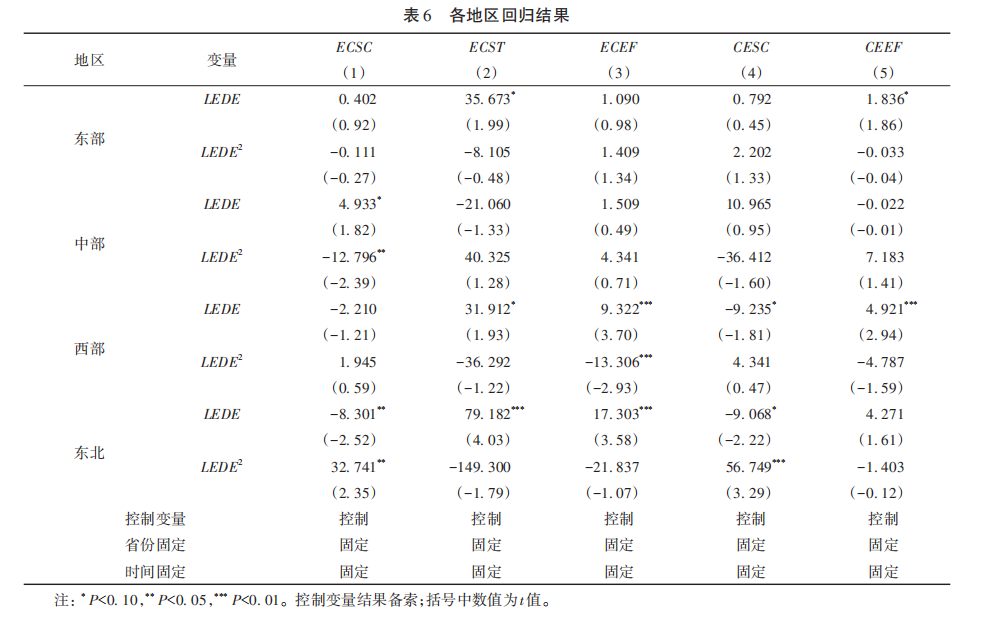
Table 6 shows that the regression results for various regions indicate that there are no significant nonlinear relationships between the digital economy and the scale of energy consumption, energy consumption structure, energy consumption efficiency, carbon emission scale, and carbon emission efficiency in the eastern region. In the central region, the digital economy only has a significant inverted “U” relationship with the scale of energy consumption, with an inflection point of 0.193, and the central region is located on the left side of the inflection point. Only by enhancing the level of digital economy development beyond the inflection point can the energy conservation effect of digital economy development be realized. In the central region, there are no significant nonlinear relationships between the digital economy and energy consumption structure, energy consumption efficiency, carbon emission scale, and carbon emission efficiency. In the western region, the digital economy only has a significant inverted “U” relationship with energy consumption efficiency, with an inflection point of 0.350. Currently, the level of digital economy development in the western region is on the left side of the inflection point, indicating that enhancing the level of digital economy development can significantly improve energy consumption efficiency. In the western region, there are no significant nonlinear relationships between the digital economy and energy consumption scale, energy consumption structure, carbon emission scale, and carbon emission efficiency. In the northeastern region, the digital economy has significant positive “U” relationships with the scale of energy consumption and carbon emission scale, with inflection points of 0.127 and 0.080, respectively. The level of digital economy development in the northeastern region has exceeded 0.080 since 2014, indicating that enhancing the level of digital economy development can no longer reduce the scale of carbon emissions. However, the level of digital economy development in 2019 is still less than 0.127, indicating that enhancing the level of digital economy development can still reduce the scale of energy consumption. There are no significant nonlinear relationships between the digital economy and energy consumption structure, energy consumption efficiency, and carbon emission efficiency in the northeastern region.
4.5 Further Analysis
To further study the specific factors influencing energy consumption and carbon emissions in the development of the digital economy, empirical tests are conducted using digital infrastructure (DINF), digital innovation environment (DIEN), digital user size (DUSI), and digital industry scale (DISC) as independent variables (due to space limitations, the values of DINF, DIEN, DUSI, and DISC for each province during the observation period are available upon request). The regression results are shown in Table 7.
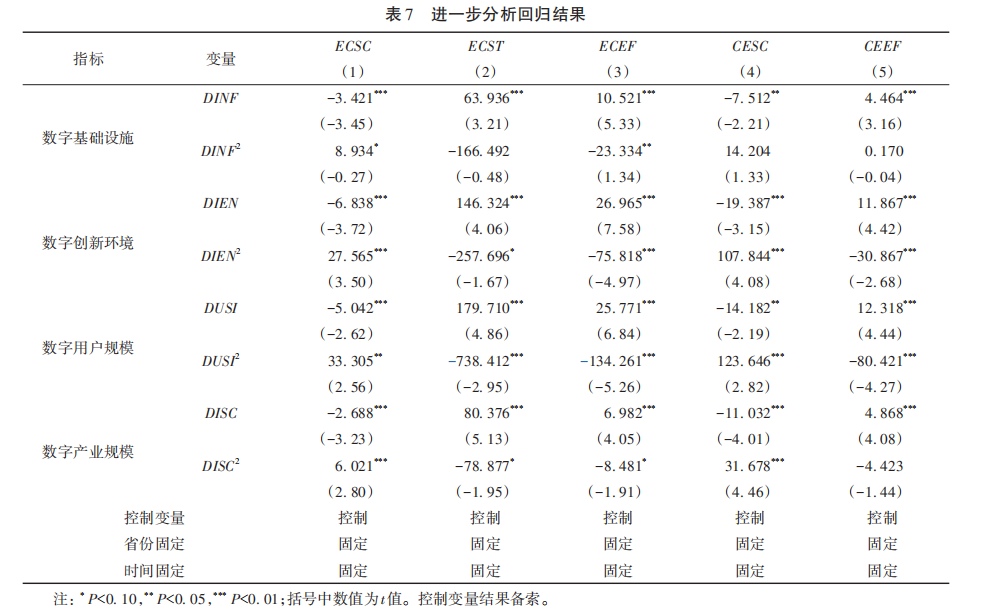
Currently, there are significant nonlinear relationships between digital infrastructure and the scale of energy consumption and energy consumption efficiency, while there are no significant nonlinear relationships between digital infrastructure and energy consumption structure, carbon emission scale, and carbon emission efficiency. Specifically, there is a significant positive “U” relationship between digital infrastructure and the scale of energy consumption, with an inflection point of 0.191. Considering the level of digital infrastructure in each province during the observation period, only Guangdong’s digital infrastructure level exceeded the inflection point in 2019, while the levels of digital infrastructure in other provinces remain on the left side of the inflection point. There is a significant inverted “U” relationship between digital infrastructure and energy consumption efficiency, with an inflection point of 0.225. The levels of digital infrastructure in each province remain on the left side of the inflection point. This indicates that the overall level of digital infrastructure in China is relatively low, and enhancing the level of digital infrastructure can further unleash its energy-saving potential and improve energy consumption efficiency. However, there are no significant nonlinear relationships between digital infrastructure and energy consumption structure, carbon emission scale, and carbon emission efficiency, indicating that there are no significant inverted “U” or positive “U” relationships.Digital innovation environment has significant nonlinear relationships with both energy consumption and carbon emissions. Specifically, there is a significant positive “U” relationship between the digital innovation environment and the scale of energy consumption and carbon emissions, with inflection points of 0.124 and 0.090, respectively. Considering the level of digital innovation environment in each province, Guangdong and Jiangsu’s digital innovation environment levels exceeded 0.124 in 2017, and Beijing exceeded 0.124 in 2018, while the levels of digital innovation environment in other provinces remain below 0.124, indicating significant disparities in the level of digital innovation environment among provinces. Enhancing the level of digital innovation environment is beneficial for improving the overall energy conservation effect of the digital economy in China. Guangdong, Jiangsu, and Beijing exceeded the level of 0.090 in 2015, and Zhejiang exceeded 0.090 in 2018, while the levels of digital innovation environment in other provinces remain below 0.090, further indicating significant disparities in the level of digital innovation environment among provinces. Enhancing the level of digital innovation environment is beneficial for reducing carbon emissions and assisting China in achieving its “dual carbon” goals. The digital innovation environment exhibits significant inverted “U” relationships with energy consumption structure, energy consumption efficiency, and carbon emission efficiency, with inflection points of 0.284, 0.178, and 0.192, respectively. Only Guangdong’s innovation environment level exceeded 0.178 in 2019, indicating that enhancing the digital innovation environment in various provinces is beneficial for optimizing energy consumption structure, improving energy consumption efficiency, and enhancing carbon emission efficiency.Similar to the digital innovation environment, the digital user scale exhibits significant positive “U” relationships with the scale of energy consumption and carbon emissions, with inflection points of 0.076 and 0.057, respectively. Considering the digital user scale in each province in 2019, Hebei, Jiangsu, Zhejiang, Anhui, Shandong, Henan, Hunan, Guangdong, and Sichuan exceeded 0.057, among which Jiangsu, Zhejiang, Shandong, Henan, Guangdong, and Sichuan exceeded 0.076, indicating that most provinces remain on the left side of the inflection points for the digital user scale and energy consumption scale, as well as the digital user scale and carbon emission scale. At this stage, enhancing the digital user scale is beneficial for energy conservation and emission reduction. The digital user scale exhibits significant inverted “U” relationships with energy consumption structure, energy consumption efficiency, and carbon emission efficiency, with inflection points of 0.122, 0.096, and 0.077, respectively. In 2019, the levels of digital user scale in Jiangsu, Zhejiang, Shandong, Henan, Guangdong, and Sichuan exceeded 0.077, among which Jiangsu, Zhejiang, and Guangdong exceeded 0.096, and only Guangdong exceeded 0.122, indicating that at this stage, expanding the digital user scale can effectively enhance China’s energy consumption efficiency and carbon emission efficiency, as well as improve energy consumption structure.The digital industry scale exhibits significant positive “U” relationships with the scale of energy consumption and carbon emissions, with inflection points of 0.223 and 0.174, respectively. Considering the digital industry scale in each province, Guangdong, Jiangsu, and Beijing exceeded 0.174 in 2014, 2015, and 2017, respectively, and exceeded 0.223 in 2016, 2018, and 2018, respectively, while the levels of digital industry scale in other provinces remain on the left side of the inflection points, indicating that other provinces still need to vigorously develop the digital industry to promote national energy conservation and emission reduction. The digital industry scale exhibits significant inverted “U” relationships with energy consumption structure and energy consumption efficiency, with inflection points of 0.510 and 0.412, respectively. All provinces remain on the left side of the inflection points, indicating that expanding the digital industry scale can significantly optimize energy consumption structure and enhance energy consumption efficiency. However, there are no significant nonlinear relationships between the digital industry scale and carbon emission efficiency.
5 Conclusions and Recommendations
This study is based on provincial panel data from 2011 to 2019, evaluating the level of digital economy development using the entropy method and constructing a double fixed effects model to empirically analyze the nonlinear relationships between the digital economy, energy consumption, and carbon emissions. The main conclusions are as follows:(1) There are interprovincial and regional differences in the level of digital economy development. Guangdong, Jiangsu, and Beijing lead in digital economy development, while Qinghai and Ningxia lag behind; the eastern region has the highest level of digital economy development, followed by the central region, the northeastern region, and the western region.(2) There are significant nonlinear relationships between the level of digital economy development and both energy consumption and carbon emissions. The level of digital economy development exhibits a significant positive “U” relationship with the scale of energy consumption and carbon emissions, while it exhibits a significant inverted “U” relationship with energy consumption structure, energy consumption efficiency, and carbon emission efficiency, indicating that the energy conservation effect of digital economy development is greater than its carbon reduction effect.(3) The nonlinear relationships between the digital economy and energy consumption and carbon emissions exhibit regional heterogeneity. In the eastern region, there are no significant nonlinear relationships between the digital economy and energy consumption and carbon emissions. In the central region, the digital economy only has a significant positive “U” relationship with the scale of energy consumption, while in the western region, the digital economy only has a significant inverted “U” relationship with energy consumption efficiency. In the northeastern region, the digital economy exhibits significant positive “U” relationships with both the scale of energy consumption and carbon emissions.(4) Digital infrastructure exhibits significant positive “U” and inverted “U” relationships with the scale of energy consumption and energy consumption efficiency, respectively. The digital innovation environment and digital user scale exhibit significant positive “U” and inverted “U” relationships with the scale of energy consumption, energy consumption structure, energy consumption efficiency, carbon emission scale, and carbon emission efficiency, while the digital industry scale exhibits significant positive “U” relationships with the scale of energy consumption, energy consumption structure, energy consumption efficiency, and carbon emission scale, but does not exhibit significant nonlinear relationships with carbon emission efficiency.Therefore, to better promote energy conservation and emission reduction, ensure national energy security, and assist in achieving the “dual carbon” goals, this study provides relevant policy recommendations. ① Narrow the interprovincial and regional gaps in digital economy development levels. Provinces and regions with leading digital economy development levels should continue to steadily develop the digital economy, while provinces and regions with intermediate levels should strive to catch up with leading provinces, and provinces and regions with lagging levels should urgently accelerate the pace of digital economy development to prevent further widening of the gap. ② Formulate digital economy development policies tailored to local conditions. Each province and region should first determine whether their level of digital economy development is on the left or right side of the respective inflection points for energy consumption scale, energy consumption structure, energy consumption efficiency, carbon emission scale, and carbon emission efficiency, and then formulate digital economy development policies that align with their energy conservation and emission reduction goals. For provinces and regions with lagging digital economy development levels that have not yet crossed any inflection points, there is significant potential for energy conservation and emission reduction, and they should accelerate digital economy development to promote reductions in energy consumption scale and carbon emission scale, improvements in energy consumption efficiency and carbon emission efficiency, and optimization of energy consumption structure. For provinces and regions with intermediate digital economy development levels that have crossed some inflection points, they should continue to develop the digital economy, as they may no longer be able to reduce energy consumption scale or carbon emission scale, but can still optimize energy consumption structure and enhance energy consumption efficiency or carbon emission efficiency, continuing to play a role in energy conservation and emission reduction. For provinces and regions with leading digital economy development levels that have crossed all inflection points, it indicates that the energy conservation and emission reduction potential of the digital economy has been fully realized. At this time, they should avoid excessive development of the digital economy that leads to simultaneous increases in energy consumption scale and carbon emission scale, as well as declines in energy consumption efficiency and carbon emission efficiency, and deterioration of energy consumption structure. ③ Improve the digital innovation environment and increase the scale of digital users. Each province and region should always prioritize improving the digital innovation environment and increasing the scale of digital users. As China’s economy transitions from a phase of rapid development to high-quality development, the driving force is shifting from investment-driven to innovation-driven, with innovation being the core element of China’s future economic development. Improving the digital innovation environment and enhancing digital innovation levels will help fully unleash the energy conservation and emission reduction effects of the digital economy. Additionally, expanding the scale of digital users is beneficial for strengthening energy conservation and emission reduction advocacy through online platforms, enhancing public awareness of energy conservation and emission reduction, and changing lifestyles to promote the realization of energy conservation and emission reduction goals.
Source: Carbon Neutrality and Sustainable Development