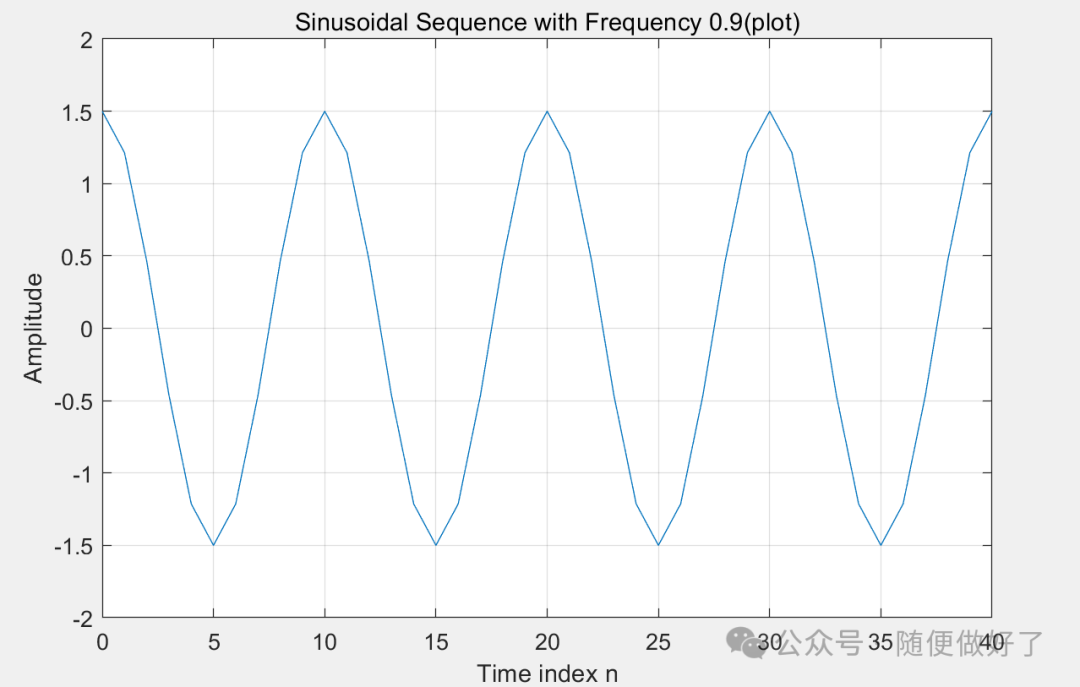
On the first day of the semester, I conducted a Matlab experiment on DSP, focusing on discrete plotting, and I started encountering errors with the stem function again. Although I can use plot to visualize discrete sequences, stem is more appropriate. Below is a comparison of the effects of plotting the same discrete sequence: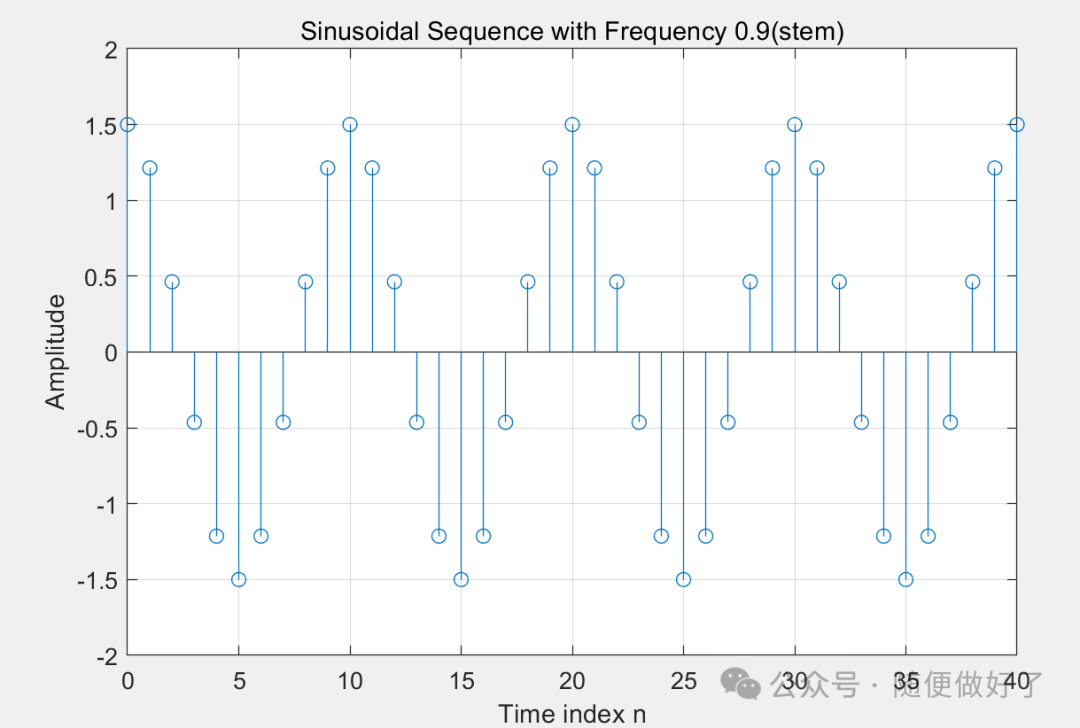
 However, when dealing with time delays, using code generated by AI often results in dimension mismatches with the stem function because it constructs the impulse sequence using zero-padding and then convolves. This method is quite simple, but AI usually fails to calculate how many zeros to pad correctly, gets the row and column vectors mixed up, and forgets to adjust for the index decrement. I typically manually convolve and adjust parameters to ensure dimension matching. Today, I discovered two simpler methods to ensure dimension matching during the experiment.Method 1 involves using an indicator function to directly construct the impulse sequence. In the index vector n, positions equal to
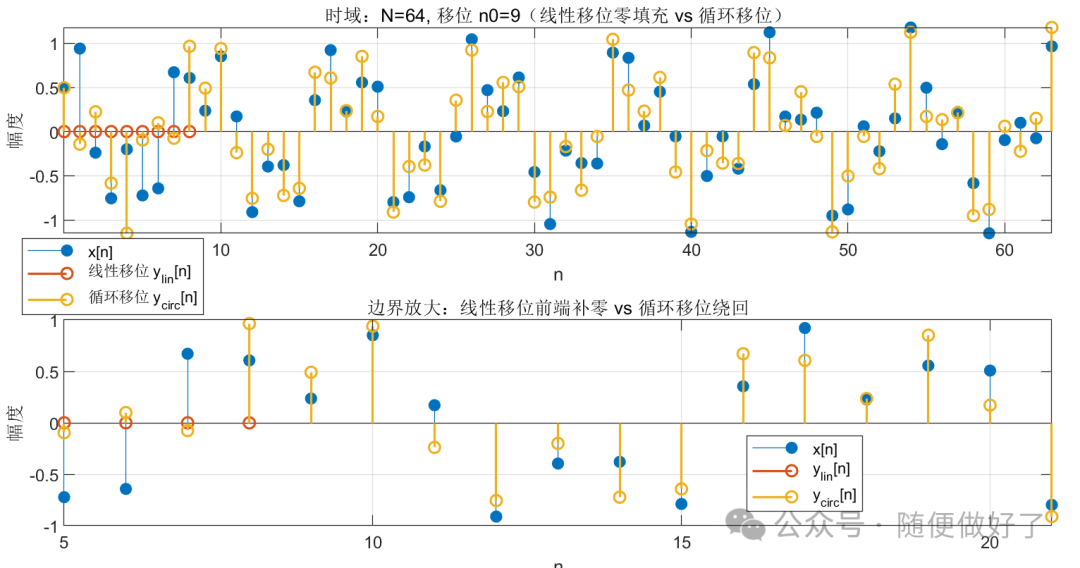
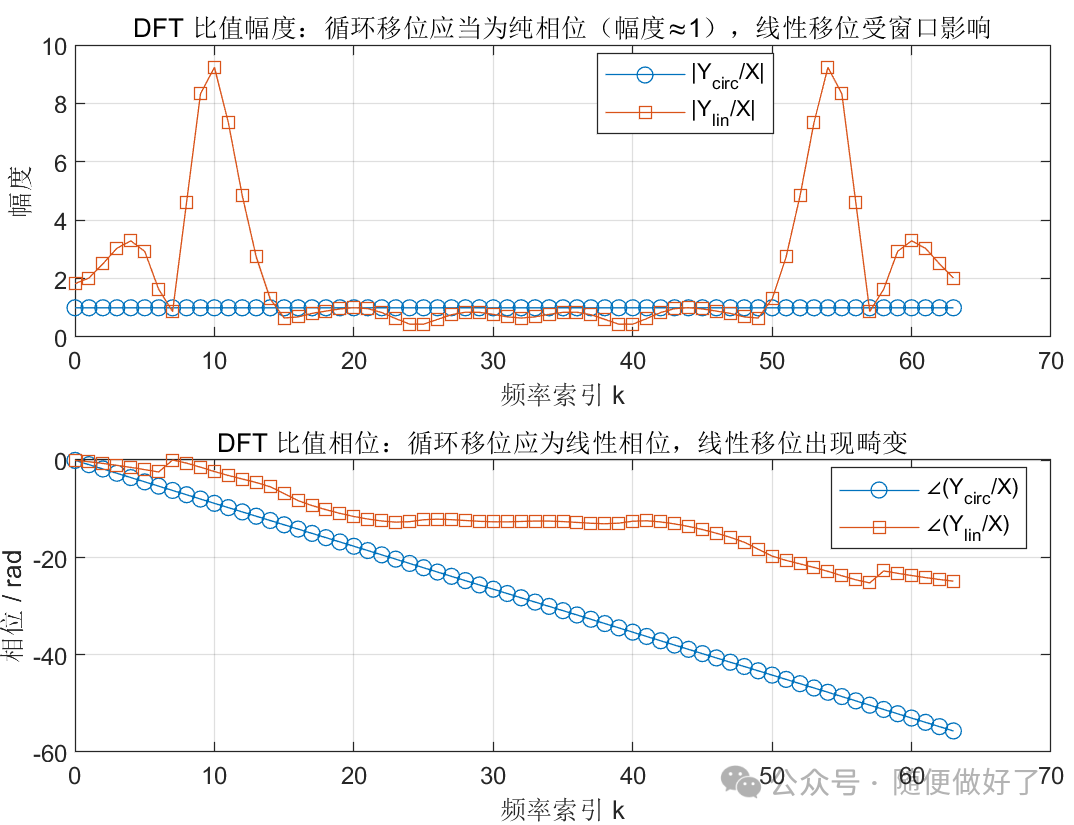
Circular shift: |Y/X| maximum deviation from 1 = 4.66e-15
Circular shift: phase slope estimate group delay ≈ 9.000 (target n0=9)
Linear shift: |Y/X| maximum deviation from 1 = 8.23