This article is aimed at those who want to develop a debugger for the Linux Armv8a architecture. It can serve as a reference, and I will use my experience from developing two debuggers to clearly describe the key technical details in as simple language as possible.Due to space limitations, this article will only discuss the detailed aspects of Linux debugger development and some step-by-step implementation details of the Windows debugger. For the Windows debugger, since I implemented it purely in assembly, I will try to translate it into C language for easier understanding.
Prerequisite Knowledge: C/C++ Linux debugging APIs, Windows debugging APIs, ArmV8a instruction set, X86 instruction set
Language: C/C++
1
Brief Overview of Debugger Principles
First, let’s provide a more academic definition of a debugger, as quoted from Wiki.
Debugger (English: Debugger), also known as a debugging program or debugging tool, refers to a computer program and tool used to debug other programs. It allows the code to be checked for running status and selectively executed in an Instruction Set Simulator (ISS) for error checking and debugging.
The debugging principles under Linux and Windows systems are different. Debugging in Windows is based on an exception dispatch mechanism (thus, theoretically, the debugging mechanism in Windows is more versatile, such as stealth debugging, which is achieved by taking over a system debugging function’s unprotected function pointer in conjunction with exception instructions to implement debugging without additional overhead). In contrast, debugging in Linux is based on a signal mechanism, implemented through the following two APIs:<span class="language-plaintext">ptrace</span> and <span class="language-plaintext">waitpid</span>.
First, let’s discuss the debugging principles in Windows. We will provide an exception propagation flowchart to help everyone understand.
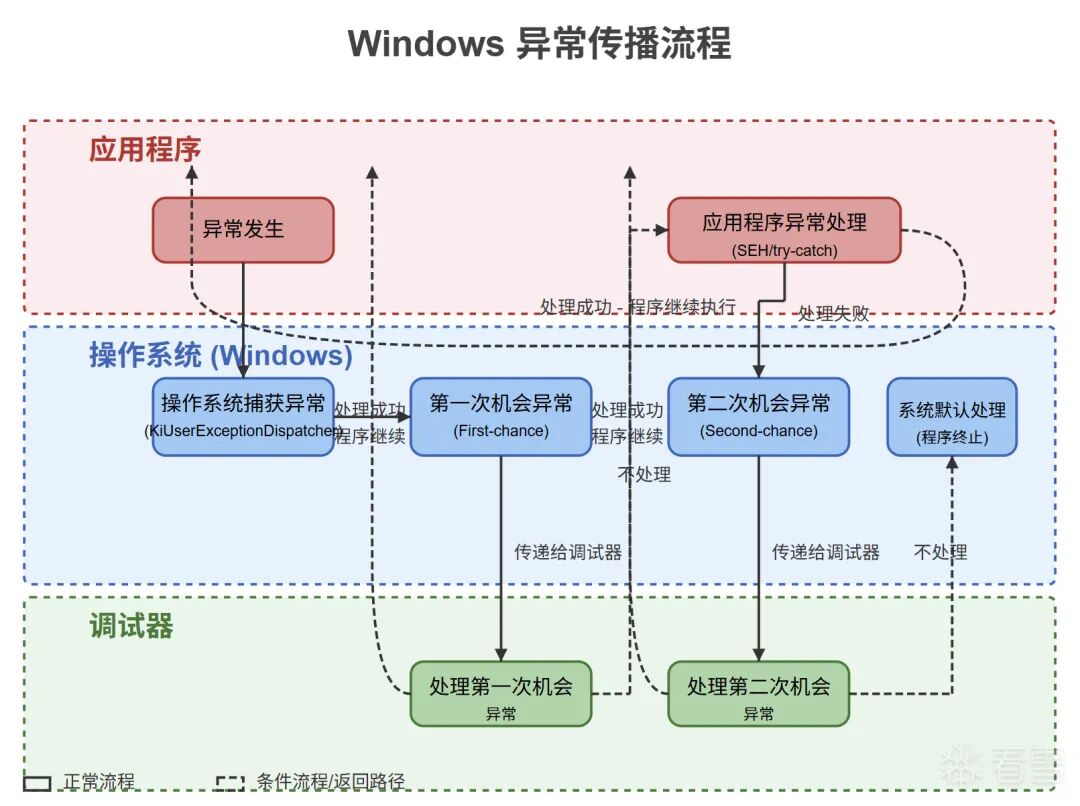
In Windows, our debugger has two opportunities to handle exceptions:
1. First opportunity
2. Second opportunity
We generally perform operations during the first opportunity. When the second opportunity occurs, it usually indicates that an unhandled exception has occurred, which will be displayed by the debugger (for example, unhandled exceptions like 0xC05, which x64dbg typically shows in the lower left corner).
The usual flow is as follows:
<span class="language-plaintext">CPU(detects exception) => System(OS) => Debugger => Debugged program</span>
What our debugger needs to do is to write a breakpoint privilege instruction at the location where we want to set a breakpoint after opening the process. Here we use the classic breakpoint instruction <span class="language-plaintext">INT3</span>. When the program runs to the breakpoint, it will throw an exception. At this point, we can receive the first exception through debugging. When we handle this exception, we accept user input and then proceed with the next operation based on the input. This is the basic principle of a Windows debugger based on exceptions. We will use a diagram to express this process more clearly.
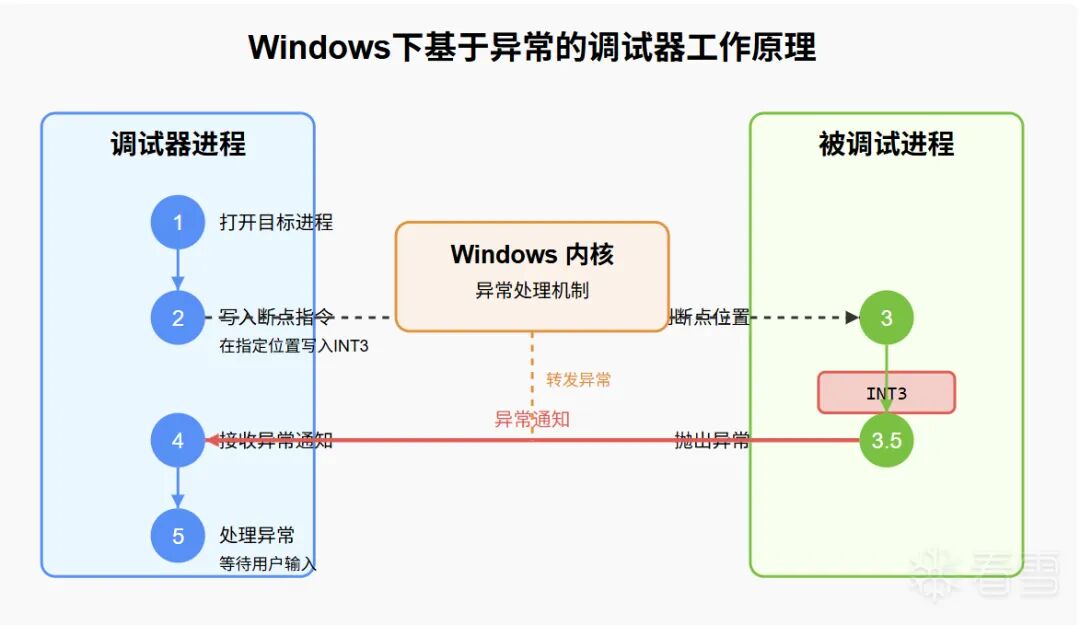
Let’s summarize this step:
- Open the process (or read/write through page table parsing)
- Write the
<span class="language-plaintext">INT3</span>breakpoint at the breakpoint location- When the debugged target runs to the target, the CPU will throw an exception, which will be handled by the system’s exception handler, and the first exception will be dispatched based on whether a debugger is registered.
- The debugger receives the exception and communicates with the user interface through the network, pipe, or directly, waiting for user input or executing certain operations.
This is the working principle of the debugger in Windows. This process can be accomplished using the built-in Dbghelp library in Windows.
Now let’s talk about the Linux debugger process. The biggest difference between the Linux debugger and the Windows debugger is that the Linux system implements it through signals. We typically use the following two APIs:
◆<span class="language-plaintext">ptrace</span>
◆<span class="language-plaintext">waitpid</span>
to implement the debugger’s functionality. In the Arm-v8a architecture, we usually use a special breakpoint instruction <span class="language-plaintext">BRK</span>, which is similar to the first half of the Windows principle. We open the process and then write (here we generally use ptrace’s PTRACE_POKEDATA because it can write to the code segment) the special breakpoint instruction. After triggering the exception, a signal will be sent to the debugging process. In the debugging process, we use <span class="language-plaintext">waitpid</span> to receive it and wait for user input. The biggest difference from Windows is that there is no concept of multiple exception opportunities. The overall writing can actually be seen as an abstract response to a certain signal, except that one is exception propagation and the other is signal propagation.
Similarly, we will provide a diagram of the debugger’s principles in the Linux system for better understanding.
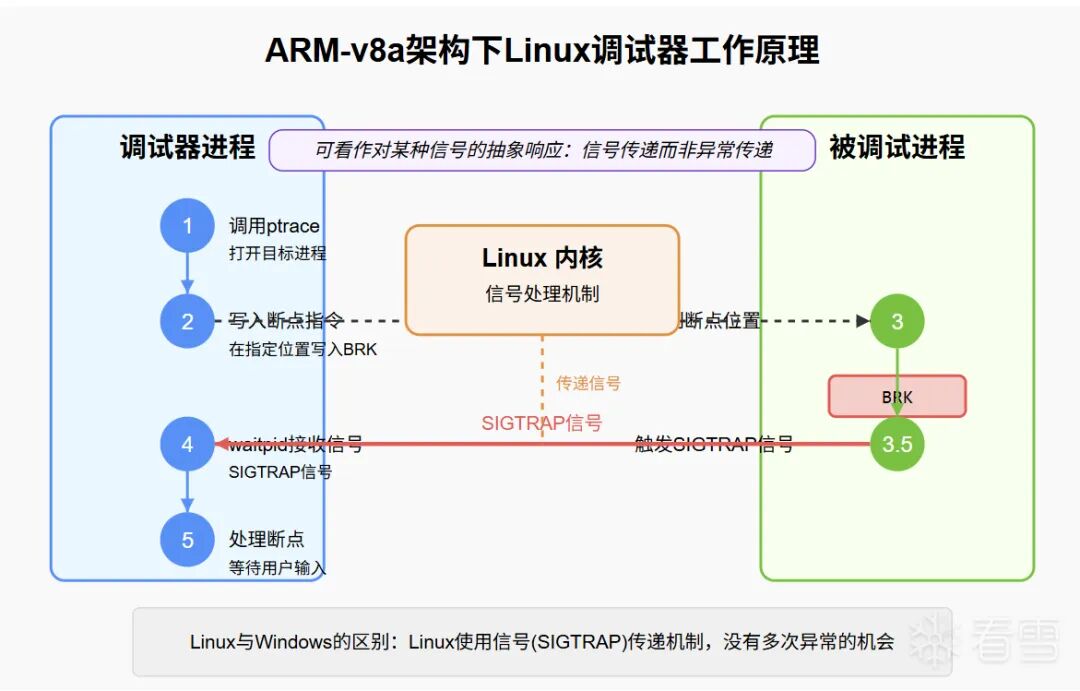
The overall workflow is quite similar to Windows, so I won’t repeat it here.
2
Differences in Breakpoint Instructions Between Two Architectures
Although the principles of the debugger are similar on both platforms, the different behaviors of breakpoint instructions on the two platforms lead to some implementation details being different. Let’s explore the differences between the two breakpoint instructions. First, in the Linux platform Arm-v8a architecture, we use the <span class="language-plaintext">BRK</span> instruction, which pauses before execution, while in the Windows platform x86 assembly, the <span class="language-plaintext">INT3</span> instruction breaks after the instruction is executed. Here are some examples.
; Linux
40A01000 D4 20 00 00 BRK

; Windows
40A01000 CC INT3
As shown in the example, at <span class="language-plaintext">40A01000</span>, we have two breakpoint instructions, where in the Linux environment the breakpoint trigger position is at <span class="language-plaintext">40A01000</span>, while in Windows the breakpoint trigger position is at <span class="language-plaintext">40A1001</span> (i.e., EIP=0x40A1001). We will provide a diagram to assist understanding.
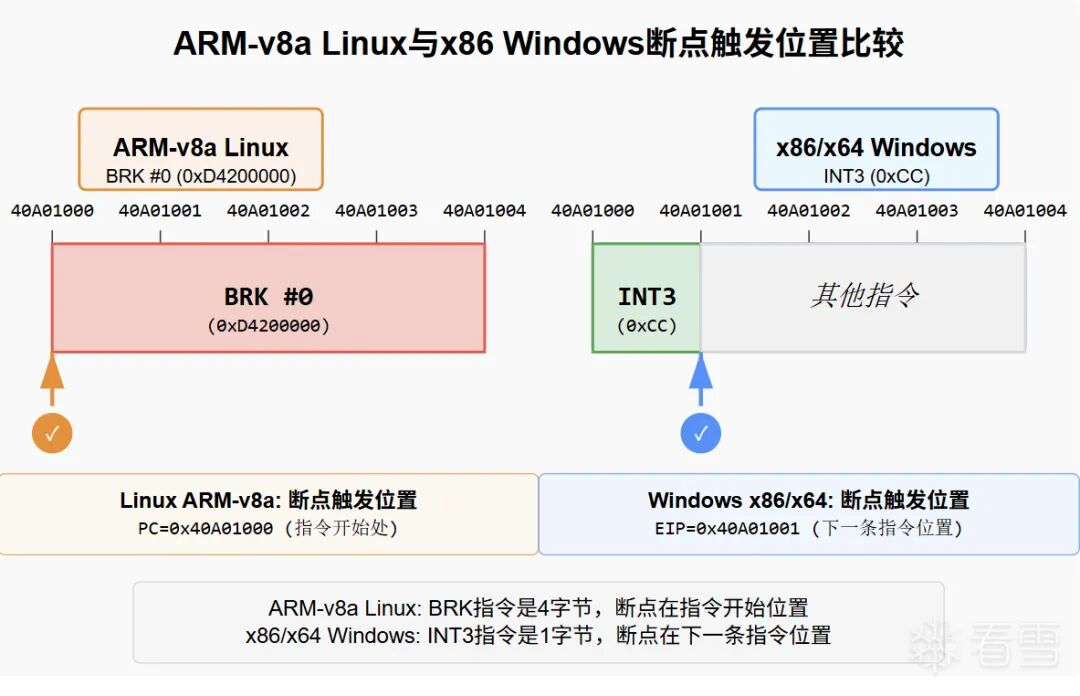
It is evident that there is a difference in the breakpoint positions. This difference leads to slight variations in the writing of step-over, which is the core of this article.
3
Step-Over Coordination
Before understanding the specific implementation details, we need to know what step-over coordination is.
Why is step-over coordination necessary?
Before answering this question, we need to understand that a debugger, as an intrusive software, will inevitably affect the control flow of the program if not handled specially. That is, when we insert breakpoint instructions into normal code sections, it will definitely cause that location to throw an exception rather than execute the conventional logic. To eliminate the need for the debugger to receive signals after the breakpoint is hit while allowing the debugged program to maintain its original behavior, we need to perform step-over coordination.
Step-over coordination refers to a programming method that uses breakpoints and single steps in coordination to maintain the normal behavior of the debugged program. Next, we will discuss the writing and detailed implementation details of step-over coordination in Windows and Linux.
First, for Windows, we list the common steps for step-over coordination:
1. Breakpoint hit
2. Set global step-over flag
3. Restore original bytecode at the breakpoint
4. Set single step
5. Read global step-over flag during single step
6. If the flag is hit, we need to set <span class="language-plaintext">eip-1</span> (because the <span class="language-plaintext">INT3</span> instruction is one byte) to move the EIP back to the instruction before this instruction.
7. Reset the breakpoint at the location that was single-stepped.
Example of pseudocode:
bool g_stepSingle = false;
DWORD g_dwContinueStatus = DBG_EXCEPTION_NOT_HANDLED;

void HandleSingleStep(Regs& reg)
{
// Get registers
    CONTEXT Ctx;
if (GetRegs(&Ctx) < 0)
return -1;
//...
if (g_stepSingle)
    {
// Reset breakpoint
        SetBreakPoint(Ctx.Eip + 1);
        g_dwContinueStatus  = DBG_CONTINUE;
    }
//...
}

void HandleDbg()
{
//... Here we need to make some judgments, such as whether it is our own breakpoint
// Get registers
    CONTEXT Ctx;
if (GetRegs(&Ctx) < 0)
return;
if (IsMyBreak(Ctx.Eip))
    {
        ReserveBreakPoint(Ctx.Eip);
        g_stepSingle = true;
        Ctx.Eip -= 1;
// Jump to single step
        SetSingleStep();
         g_dwContinueStatus  = DBG_CONTINUE;
    }
}
In the case of Linux, we generally handle it as follows:
long WaitProcess(){
long result = waitpid(env.pid, nullptr, WNOHANG);

if (result == -1)
    {
printf("waitpid err: %s",strerror(errno));
return result;
    }

if (result == 0)
    {
return result;
    }

// Target process has arrived
siginfo_t si{};
    result = ptrace(PTRACE_GETSIGINFO, env.pid, nullptr, &si);
if (result == -1)
    {
printf("ptrace PTRACE_GETSIGINFO err: %s",strerror(errno));
return result;
    }

/*
    If a breakpoint has arrived, it can be roughly distinguished through sig_signo, and sig_code can be used for further differentiation
    */
// printf("signo:%d, errno:%d, sigcode:%d\n", si.si_signo, si.si_errno, si.si_code);
    user_regs_struct reg{};

/* DOR call */
    CCmdReg* pReg = (CCmdReg*)g_cmd[(int)DOR_IDX::EnumCmdReg];
    CCmdBp* pBp = (CCmdBp*)g_cmd[(int)DOR_IDX::EnumCmdBp];
    CCmdStepInto* pStepIn = (CCmdStepInto*)g_cmd[(int)DOR_IDX::EnumStepInto];
    CCmdMem* pMem = (CCmdMem*)g_cmd[(int)DOR_IDX::EnumCmdMem];
/* Read registers */
    pReg->ReadReg(®);
    env.tag_currentAddress = reg.pc;
    env.tag_disasmAddress = reg.pc;

uint8_t insn[12]{0};

/* Step-over coordination */
if (env.tag_stepBpFlag)
    {
        pBp->SetBp(env.tag_stepBpReverseAddr);
/* Reset step-over coordination flag */
        env.tag_stepBpReverseAddr = 0;
        env.tag_stepBpFlag = false;
    }

if (env.tag_resumeFlag)
    {
        env.tag_resumeFlag = false;
        CCmdResume* pResume = (CCmdResume*)g_cmd[(int)DOR_IDX::EnumCmdResume];
        pResume ->Resume();
return result;
    }


switch(si.si_signo)
    {
case SIGSTOP:
        {
printf("\nprocess stop.\n");
break;
        }
case SIGTRAP:
        {
switch (si.si_code) {
case TRAP_BRKPT:
                {
                    pReg->ShowReg(®);
if (env.tag_stepOverFlag)
                    {
                        pMem->WriteMem(env.tag_currentAddress, env.tag_stepOverBuffer, 4);
                        env.tag_stepOverFlag = false;
                    }

if (env.tag_stepBpResFlag)
                    {
                        pBp->SetBp(env.tag_stepBpResAddr);
                        env.tag_stepBpResFlag = false;
                        env.tag_stepBpResAddr = 0;
                    }

if (pBp->IsBpExist(reg.pc))
                    {
printf("\nHit bp! at 0x%lx\n", reg.pc);

//pMem->WriteMem(env.tag_currentAddress, env.tag_stepOverBuffer, 4);
                        pBp->ReserveMem(reg.pc);

                        env.tag_stepBpReverseAddr = reg.pc;
                        env.tag_stepBpFlag = true;

// pStepIn->SetSingleStep();
                    }
//}

                    pMem->ReadMem(reg.pc, insn, 12);
for (int i = 0; i < 3; i++)
                    {
                        env.disasm.Disasm(reg.pc + i * 4, insn + i * 4, 4);
                    }

break;
                }
case TRAP_TRACE:
                {
if (env.tag_stepBpResFlag)
                    {
                        pBp->SetBp(env.tag_stepBpResAddr);
                        env.tag_stepBpResFlag = false;
                        env.tag_stepBpResAddr = 0;
                    }

if (env.tag_traceFlag)
                    {
if (reg.pc == env.tag_traceTargetAddr)
                        {
                            env.tag_traceTargetAddr = 0;
                            env.tag_traceFlag = false;

                        }
else
                        {
                            pMem->ReadMem(reg.pc, insn, 12);
for (int i = 0; i < 1; i++) {
                                env.disasm.Disasm(reg.pc + i * 4, insn + i * 4, 4);
                            }
                            pStepIn->SetSingleStep();
break;
                        }
                    }


                    pReg->ShowReg(®);
                    pMem->ReadMem(reg.pc, insn, 12);
for (int i = 0; i < 3; i++)
                    {
                        env.disasm.Disasm(reg.pc + i * 4, insn + i * 4, 4);
                    }
break;
                }
            }
break;
        }
    }
return result;
}
4
Disassembling Breakpoint Handling
Next, we will discuss the handling of disassembled code. The principle is simple: when disassembling, first check for breakpoints, then write back the original instructions, and finally rewrite the breakpoints.
void Disasm()
{
// ...
    if (IsMyBreakPoint())
    {
ReserveBreakPoint();
// Perform disassembly operation here, usually a single instruction disassembly operation
SetBreakPoint();
    }
// ...
}
5
Memory Writing Function in Arm-v8a Debugger
To enable writing to the code segment memory, we use <span class="language-plaintext">ptrace</span>‘s PTRACE_POKEDATA for chunked memory writing.
bool WriteMem(uint64_t addr, uint8_t * pszBuf, size_t  size) {
printf("addr: 0x%lx size: %zu\n", addr, size);
if (size == 0)
        {
printf("Write size is 0");
return true;
        }
bool ret = true;

/* Number of batches */
int nBatch = size / sizeof(void *);

/* Remaining bytes */
int nTail = size - sizeof(void *) * nBatch;

/* Bytes already written */
size_t nWrite = 0;

/* Secondary pointer for chunked data writing */
void **ppszBuffer = (void **) malloc(sizeof(void *));

if (!ppszBuffer)
        {
return false;
        }

/* Writing batches */
for (int i = 0; i < nBatch; i++) {
memcpy(ppszBuffer, &(pszBuf[i * sizeof(void *)]), sizeof(void *));

long result = ptrace(PTRACE_POKEDATA, env.pid, (void *) (addr + nWrite), *ppszBuffer);

if (result == -1) {
printf("Write err: %s\n", strerror(errno));
                ret = false;
break;
            }
/* Increase write count */
            nWrite += sizeof(void *);
        }
free(ppszBuffer);

if (!ret)
        {
return ret;
        }


/* Tail data writing buffer */
uint8_t *pszTailData = (uint8_t *) malloc(sizeof(void *));

if (!pszTailData)
        {
return false;
        }
/* Read then write */
if (!ReadMem((uint64_t) (addr + nWrite), pszTailData, sizeof(void *)))
        {
            ret = false;
        }

if (!ret)
        {
free(pszTailData);
return ret;
        }

for (int i = 0; i < nTail; i++) {
            pszTailData[i] = pszBuf[nWrite + i];
        }

/* Write back to the target process */
long result = ptrace(PTRACE_POKEDATA, env.pid, (void *) (addr + nWrite),
                             *(void **) pszTailData);

if (result == -1) {
printf("Write err: %s\n", strerror(errno));
            ret = false;
        } else {
            nWrite += nTail;
        }

free(pszTailData);
//printf("Write completed: %lu/%lu\n", nWrite, size);

return ret;
    }
6
Core Single-Step Function of Windows Pure Assembly Debugger
handleBreakPoint proc uses esi ebx edx ecx
    LOCAL ctx:CONTEXT
    LOCAL lpAddress:DWORD
    mov esi, offset g_dbgEvent
    add esi, 0ch
    assume esi:ptr EXCEPTION_RECORD
    ; lpAddress
    mov eax, [esi].ExceptionAddress
    mov dword ptr lpAddress, eax
    mov dword ptr g_dwCotinueStatus, DBG_EXCEPTION_NOT_HANDLED

    ; Here we need to satisfy that g_stepOverFlag is set and the step-over address equals the set step-over address
    mov edx, g_stepOverFlag
    mov ebx, g_stepBpAddress
    mov ecx, lpAddress

    .if edx == 1 && ebx == ecx
        ; Set showAsm default disassembly position
        mov ebx, lpAddress
        mov dword ptr g_dwCurrentShowAddr, ebx
        ; Here we need to set a breakpoint
        invoke getNode, lpAddress
        mov esi, eax
        assume esi:ptr BreakPointNode
        ; writeMemory proc uses esi ebx lpAddress:DWORD, lpBuffer:DWORD, dwSize:DWORD
        ; Restore code
        lea eax, [esi].tag_szOrgCode
        invoke writeMemory, lpAddress, eax,1
        ; change eip - 1
        lea eax, ctx
        invoke getRegs, eax
        lea eax, ctx
        assume eax:ptr CONTEXT
        mov ebx, [eax].regEip
        dec ebx
        mov [eax].regEip, ebx
        invoke setRegs, eax
        ;invoke queryRegs
        ; Only show 3 lines
        invoke showAsm, lpAddress, 3
        mov eax, 0
        mov g_stepOverFlag, eax
        invoke removeBreakPoint, lpAddress
        invoke cmdHandle
        mov dword ptr g_dwCotinueStatus, DBG_CONTINUE
    .endif

    ; Check if it is our own breakpoint
    invoke getNode, lpAddress

    .if eax != FAIL
        ; Set showAsm default disassembly position
        mov ebx, lpAddress
        mov dword ptr g_dwCurrentShowAddr, ebx
        mov esi, eax
        assume esi:ptr BreakPointNode
        ; writeMemory proc uses esi ebx lpAddress:DWORD, lpBuffer:DWORD, dwSize:DWORD
        ; Restore code
        lea eax, [esi].tag_szOrgCode
        invoke writeMemory, lpAddress, eax,1
        ; change eip - 1
        lea eax, ctx
        invoke getRegs, eax
        lea eax, ctx
        assume eax:ptr CONTEXT
        mov ebx, [eax].regEip
        dec ebx
        mov [eax].regEip, ebx
        invoke setRegs, eax
        ;invoke queryRegs
        ; Only show 3 lines
        invoke showAsm, lpAddress, 3
        ; Step-over coordination is to keep this breakpoint set as a permanent breakpoint rather than a temporary one
        mov dword ptr g_isBpFlag, 1
        mov eax, lpAddress
        mov dword ptr g_lpAddressForBpFlag, eax
        invoke setStepBp
        invoke cmdHandle
        mov dword ptr g_dwCotinueStatus, DBG_CONTINUE
    .endif
    ; Check if it is a system breakpoint
    xor eax, eax
    mov al, g_isSystemBp
    .if eax == 1
        mov ebx, lpAddress
        mov dword ptr g_dwCurrentShowAddr, ebx
        invoke showAsm, lpAddress, 3
        invoke setBreakPoint, 401000h
        ;invoke setHardBreakPoint, 401000h, 0, 1
        xor eax, eax
        mov g_isSystemBp, al
        invoke cmdHandle
        mov dword ptr g_dwCotinueStatus, DBG_CONTINUE
    .endif

    ret
handleBreakPoint endp
; todo hard break point
handleSingleStep proc uses esi ebx edx
    LOCAL ctx:CONTEXT
    ;LOCAL pStepOverAddress:DWORD
    LOCAL dwReadSize:DWORD
    LOCAL dwDr6:DWORD
    LOCAL dwDr7:DWORD
    lea esi, ctx
    invoke getRegs, esi
    assume esi:ptr CONTEXT
    ; Get DR6 register
    mov eax, [esi].iDr6
    mov dwDr6, eax
    ; Get DR7 register
    mov eax, [esi].iDr7
    mov dwDr7, eax

    mov esi, offset g_dbgEvent
    add esi, 0ch
    assume esi:ptr EXCEPTION_RECORD
    mov dword ptr g_dwCotinueStatus, DBG_EXCEPTION_NOT_HANDLED
    lea edx, ctx
    invoke getRegs, edx
    lea edx, ctx
    assume edx:ptr CONTEXT
    ; todo hard bp options !!!!
    ; B0
    mov eax, 01h
    and eax, dwDr6
    .if eax
        mov dword ptr g_dwCotinueStatus, DBG_CONTINUE
        mov eax, 00030000h
        and eax, dwDr7
        ; Check if this bit is 0
        .if !eax
            ; If 0, set L0 to 0
            mov eax, 0fffffffCh
            and eax,dwDr7
            mov dwDr7, eax

            mov [edx].iDr7, eax
            invoke setRegs, edx
            lea edx, ctx
        .endif
        invoke showAsm, [edx].regEip, 3
        ; Enter command line
        invoke cmdHandle
    .endif
    ; B1
    mov eax, 02h
    and eax, dwDr6
    .if eax
        mov dword ptr g_dwCotinueStatus, DBG_CONTINUE
        mov eax, 00300000h
        and eax, dwDr7
        ; Check if this bit is 0
        .if !eax
            ; If 0, set L0 to 0
            mov eax, 0fffffff3h
            and eax,dwDr7
            mov dwDr7, eax

            mov [edx].iDr7, eax
            invoke setRegs, edx
            lea edx, ctx
        .endif
        invoke showAsm, [edx].regEip, 3
        ; Enter command line
        invoke cmdHandle
    .endif
    ; B2
    mov eax, 04h
    and eax, dwDr6
    .if eax
        mov dword ptr g_dwCotinueStatus, DBG_CONTINUE
        mov eax, 03000000h
        and eax, dwDr7
        ; Check if this bit is 0
        .if !eax
            ; If 0, set L0 to 0
            mov eax, 0ffffffCfh
            and eax,dwDr7
            mov dwDr7, eax

            mov [edx].iDr7, eax
            invoke setRegs, edx
            lea edx, ctx
        .endif
        invoke showAsm, [edx].regEip, 3
        ; Enter command line
        invoke cmdHandle
    .endif
    ; B3
    mov eax, 08h
    and eax, dwDr6
    .if eax
        mov dword ptr g_dwCotinueStatus, DBG_CONTINUE
        mov eax, 30000000h
        and eax, dwDr7
        ; Check if this bit is 0
        .if !eax
            ; If 0, set L0 to 0
            mov eax, 0ffffff3fh
            and eax,dwDr7
            mov dwDr7, eax

            mov [edx].iDr7, eax
            invoke setRegs, edx
            lea edx, ctx
        .endif
        invoke showAsm, [edx].regEip, 3
        ; Enter command line
        invoke cmdHandle
    .endif

    .if g_isBpFlag
        xor eax, eax
        mov g_isBpFlag, eax
        mov dword ptr g_dwCotinueStatus, DBG_CONTINUE
        mov eax, 0fffh
        not eax
        and eax, g_lpAddressForBpFlag
        invoke resetBreakPoint, g_lpAddressForBpFlag
        ;invoke setBreakPoint, g_lpAddressForBpFlag
        ;.if eax == FAIL
        ;    invoke resetBreakPoint, g_lpAddressForBpFlag
        ;.endif
    .endif

    ; Check single-step conditions
    mov eax, g_isStep
    .if eax
        ; Set single-step flag to FALSE
        xor eax, eax
        mov dword ptr g_isStep, eax
        ; Find register environment
        lea esi, ctx
        ;invoke getRegs, esi
        assume esi:ptr CONTEXT
        invoke showAsm, [esi].regEip, 3

        ; Enter command line
        invoke cmdHandle
        mov dword ptr g_dwCotinueStatus, DBG_CONTINUE
    .endif

    .if g_bmOtherPageFlag
        mov eax, g_bmOtherPageFlag
        xor eax, eax
        mov g_bmOtherPageFlag, eax
        invoke ezSetPageAttr, g_bmOtherPageAddress, 1h, PAGE_NOACCESS
    .endif
    .if g_bmFlagNode
        ; Set g_bmFlagNode to FALSE
        mov eax, g_bmFlagNode
        xor eax, eax
        mov g_bmFlagNode, eax
        ; Reset
        mov edx, g_bmLasBmNodeAddress
        assume edx:ptr MemoryBreakPointNode
        invoke ezSetPageAttr, [edx].tag_page1,1h, PAGE_NOACCESS
        mov eax, [edx].tag_page2
        .if eax
            invoke ezSetPageAttr, [edx].tag_page2, 1h, PAGE_NOACCESS
        .endif
    .endif
    ret
handleSingleStep endp
; mem bp work process
; 1. change target mem attr to PROCESS_NOACCESS
; 2. run code
; 3. recv exception C05
; 4. judge the condition, if the address between the page address and the pageaddr + offset
; then stop it and show the cmd and dasm
; else the address not in there that means,
; not our bp so we need to reset the attr in the page
; if we catch the C05 exception in our address then we need to set the
;  attr and run it then goto singel step to reset the page attr
Conclusion
The difficulty of developing a debugger does not lie in the programming ideas but in handling boundary conditions. When we fail to handle boundary conditions well, various hard-to-debug bugs will arise.

Kanxue ID:TeddyBe4r
https://bbs.kanxue.com/user-home-983513.htm
# Previous Recommendations
1、Great Wall Cup 2025 (php-pwn) semi-final php-master detailed explanation
2、How to compile LineageOS and flash it
3、Defeating magic with magic: Virtual machine analysis and restoration
4、Redis vulnerability analysis – lua script section
5、PWN introduction – OffByOne encounter
6、Understanding Dirty_Pipe thoroughly: From source code analysis to kernel debugging


Share
Like
Watch

Click to read the original text for more