“PLC Automation Testing: 3 Core Scenarios Tested, Fault Detection Rate Increased by 90%!”
Hello everyone! Today, I would like to share a “lifesaving” practical experience with all industrial control professionals — the ultimate secret of PLC automation testing! Have you ever encountered sudden stalling of equipment? Have you ever been woken up at midnight by a shutdown alarm? Have you calculated the losses caused by a single fault? (Warning: blood and tears case)
A certain automotive factory experienced a 4-hour production line shutdown due to a PLC program bug in the conveyor belt, resulting in a direct loss of 5 million! A certain chemical plant lost control of equipment and crashed a reactor worth 3 million due to untested emergency stop functionality! A certain food factory lost 800,000 due to a sensor false trigger that caused an entire batch of products to be scrapped!
The common point of these accidents is only one — inadequate PLC testing!
1. Requirement Decomposition Layer
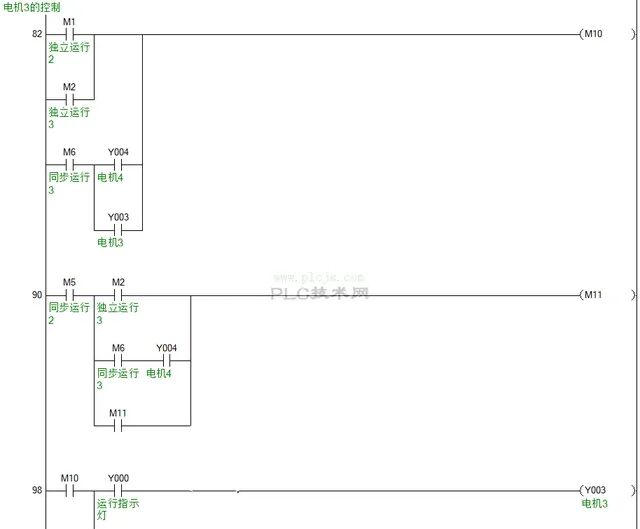
Use mind mapping to decompose control logic (Example: the conveyor belt system needs to be split into modules such as start-stop control, synchronous operation, emergency stop protection, etc.)
Establish a testing matrix: input signals, output responses, abnormal scenarios (such as power failure, sensor false alarms)
2. Tool Layer
Mitsubishi FX Series: GX Works3 + TestWorks plugin (supports automatic generation of test cases from ladder diagrams)
Siemens S7-1200: TIA Portal + PLCSIM Advanced (virtual simulation + hardware-in-the-loop testing)
Open-source solution: OpenPLC + Docker (low-cost setup of distributed testing environment)
3. Execution Layer
Boundary Value Testing: Run the conveyor belt at 100% speed for 72 hours (refer to a case where testing caused a motor to burn out)
Stress Testing: Simultaneously trigger 100 sensor signals (a factory discovered a stack overflow bug in the program due to this)
Random Testing: Use Python scripts to generate 100,000 sets of random signals (a beverage factory discovered a liquid level control bug)
4. Analysis Layer
Use Matlab to draw signal timing diagrams (Example: the time difference for starting each motor during synchronous operation must be < 50ms)
Establish a defect database (a steel plant accumulated over 2000 cases, with a defect recurrence rate reduced by 80%)
2. Scenario-based Testing Package
Fault detection rate increased from 65% to 98%
Annual downtime reduced from 480 hours to 32 hours
Annual cost savings exceeded 5 million
5. Implementation Roadmap
Risk Assessment: Use FMEA to analyze high-risk modules (Example: synchronous operation module risk factor 9.5/10)
Solution Selection: Choose testing tools based on budget (Reference: small and medium-sized enterprises prioritize open-source solutions)
Pilot Testing: First test the conveyor belt system (90% of issues are concentrated in such equipment)
Full Promotion: Update the test case library quarterly (a factory has accumulated over 1200 test cases)