

01
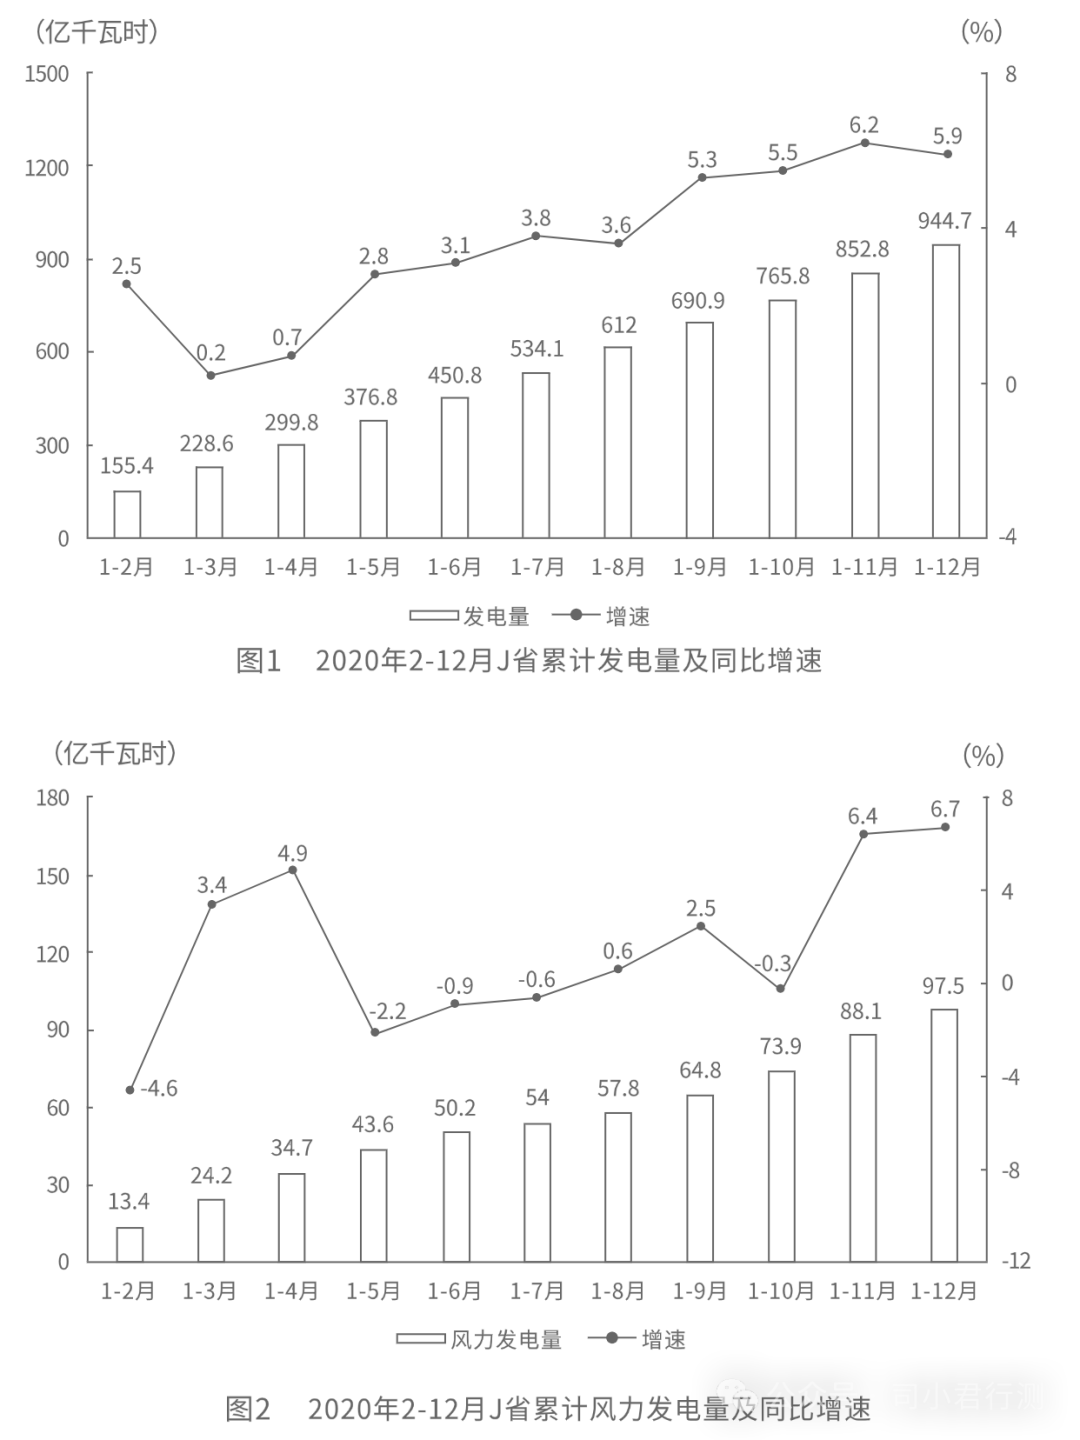
The cumulative power generation of J Province from January to February 2021 compared to the same period last year, how does it compare to the cumulative growth rate of wind power generation?
A. Less than 10 percentage points higher
B. Less than 10 percentage points lower
C. More than 10 percentage points higher
D. More than 10 percentage points lower
Click below to get the answer
Answer: D
【Analysis】Based on the question “In January-February 2021… the growth rate compared to… the growth rate”, it can be determined that this question is about general growth rates. The data shows that in January-February 2021, J Province’s power generation was 16.7 billion kWh, of which wind power generation was 1.74 billion kWh. From the data, in January-February 2020, J Province’s cumulative power generation was 15.54 billion kWh, with wind power generation at 1.34 billion kWh. Using the formula: growth rate = (current period amount – base period amount) / base period amount, we find that the question asked = (16.7 – 15.54) / 15.54 – (1.74 – 1.34) / 1.34 = 11.6 / 15.54 – 0.4 / 1.34 ≈ -22%, which is more than 10 percentage points lower.
Thus, the correct answer is D.
02
From March to December 2020, how many months did J Province’s monthly power generation growth rate exceed the cumulative power generation growth rate for that month?
A. 5
B. 6
C. 7
D. 8
Click below to get the answer
Answer: C
【Analysis】Based on the question “From March to December 2020… the monthly power generation growth rate exceeds the cumulative power generation growth rate for that month…”, combined with the data showing the monthly cumulative power generation growth rates, this question is about mixed growth rates. From the data, we can see that from February to December 2020, J Province’s monthly cumulative power generation growth rates are available. The monthly cumulative power generation = last month’s cumulative power generation + monthly power generation. To satisfy the condition that the monthly power generation growth rate exceeds the monthly cumulative power generation growth rate, we find that the monthly power generation growth rate > monthly cumulative power generation growth rate > last month’s cumulative power generation growth rate, which means that the monthly cumulative power generation growth rate > last month’s cumulative power generation growth rate. The months that meet this condition are April, May, June, July, September, October, and November, totaling 7 months.
Thus, the correct answer is C.
In 2021, there were 138 national-level regional breeding bases for good seeds in the country, with Shandong and Heilongjiang having 16 and 12 bases respectively, followed by Yunnan and Hubei with 10 each. In 2021, there were 677 rice varieties approved by the national examination, of which Hunan had 169; among the 919 corn varieties approved, 134 came from Beijing, followed by Jilin with 99 and Henan with 95; compared to rice and corn, soybean seed sources are highly dependent on imports, with only 86 national-approved varieties in 2021, of which Heilongjiang had 18 and Shandong had 14; among the 39 national-approved cotton varieties, the most were from Xinjiang with 12, followed by Henan with 6.In 2021, the area of self-bred crop varieties in China accounted for over 95%, with 100% self-sufficiency in the two staple crops, rice and wheat. The dependence on imported soybean seeds reached 86%, and the import dependence for seeds of carrots, eggplants, spinach, onions, high-end tomato varieties, and beets exceeded 90%.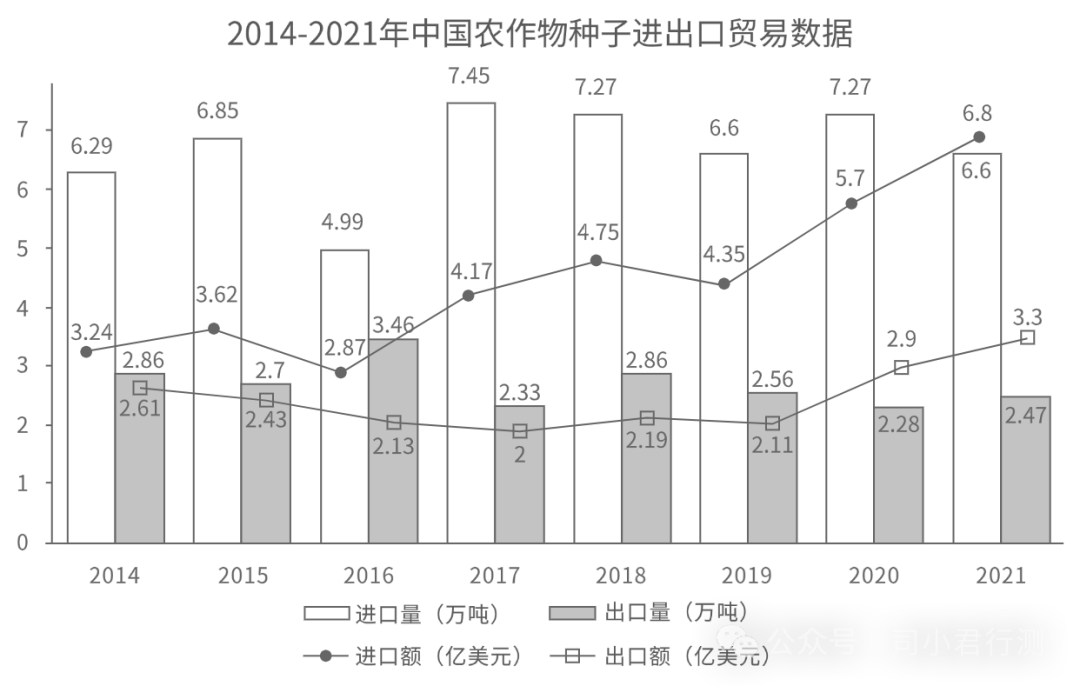
03
In 2021, the proportion of crop seed exports in China accounted for the total import and export value ( ).
A. Increased by more than 2 percentage points
B. Decreased by more than 2 percentage points
C. Increased by less than 2 percentage points
D. Decreased by less than 2 percentage points
Click below to get the answer
Answer: D
【Analysis】Based on the question “In 2021… the proportion compared to last year”, combined with the options of increase/decrease + percentage points, this question is about the calculation of proportions between two periods. The statistical data shows that in 2021 and 2020, the export value of crop seeds in China was 330 million USD and 290 million USD respectively, while the import value was 680 million USD and 570 million USD respectively. Using the formula: proportion = part/whole, we find that the proportion of crop seed exports in 2021 = 3.3/(3.3+6.8) = 3.3/10.1 ≈ 32.7%; the proportion in 2020 = 2.9/(2.9+5.7) = 2.9/8.6 ≈ 33.7%, thus the result = 32.7% – 33.7% = -1%, which means a decrease of less than 2 percentage points.
Thus, the correct answer is D.
04
Which of the following cannot be concluded from the above data ( )?
A. In 2021, the self-sufficiency rate of soybean seeds in China was less than 15%
B. In 2021, Xinjiang had the largest proportion of national-approved cotton varieties
C. In 2021, the market share of self-bred beet seeds in China was less than 10%
D. In 2021, the number of national-approved corn varieties was the highest, and domestic corn demand can be self-sufficient
Click below to get the answer
Answer: D
【Analysis】A: From the second paragraph of the text, it can be seen that in 2021, the dependence on imported soybean seeds in China reached 86%, thus the self-sufficiency rate of soybean seeds should be 1 – 86% = 14% < 15%, which is correct;
B: From the first paragraph of the text, it can be seen that in 2021, the largest number of national-approved cotton varieties was from Xinjiang with 12, followed by Henan with 6. Therefore, Xinjiang has the largest proportion, which is correct;
C: From the second paragraph of the text, it can be seen that in 2021, the dependence on imported seeds for carrots, eggplants, spinach, onions, high-end tomato varieties, and beets exceeded 90%, thus the market share of self-bred beet seeds should be < 1 – 90% = 10%, which is correct;
D: From the first paragraph of the text, it can be seen that in 2021, there were 919 national-approved corn varieties, but it does not specify whether this includes all varieties that passed the national examination, thus it cannot be determined whether corn varieties are the most. The second paragraph does not mention corn, only stating that rice and wheat are 100% self-sufficient, so it cannot be determined whether domestic corn demand is self-sufficient. Therefore, D cannot be concluded from the data, which is incorrect.
Thus, the correct answer is D.