
Is there an inherent connection between passive side-channel analysis and active fault injection?

Author | Shuyuan
Editor | Pan Qizhi
Background Introduction
Side-channel analysis of cryptographic algorithms refers to the process of inferring intermediate values of cryptographic operations by collecting and analyzing the physical information leaked by cryptographic chips during computation, thereby recovering the keys. Information such as energy consumption, electromagnetic radiation, execution time, and sound can all be utilized in side-channel analysis. Since any cryptographic operation or device will consume a certain amount of time, energy, radiate electromagnetic waves, and produce a certain sound (in frequencies inaudible to the human ear), side-channel analysis is highly universal and is recognized as the greatest threat to cryptographic terminal products. Literature [1] summarizes dozens of cases where commercial cryptographic products have been compromised through side-channel attacks.

Comparison of energy waveforms exhibited by 9 different Hamming weights in embedded systems. Image source: Side-channel analysis teaching and research experimental kit [2].
Fault analysis of cryptographic algorithms involves using injection devices such as lasers, electromagnetic pulses, power glitches, and clock glitches to interfere with the cryptographic chip during cryptographic operations, causing it to produce incorrect outputs. By analyzing both correct and incorrect outputs from the chip, the key can be recovered.
Side-channel analysis typically uses oscilloscopes to passively collect waveforms, while fault analysis usually employs specialized equipment to actively inject faults. For many years, people have been pondering: superficially, side-channel analysis and fault analysis seem unrelated, but essentially, is there a necessary connection between passive side-channel analysis and active fault injection?
In December 2020, researchers Spruyt, Milburn, and Chmielewski from Vrije Universiteit Amsterdam and Radboud University provided an answer to this question in the prestigious journal TCHES [3]: performing multiple encryptions on cryptographic algorithms and repeatedly injecting faults at each moment on the timeline, thecount of ciphertext errors can form a curve that shows a strong positive correlation with the energy waveform of the encryption. In other words, this fault curve can achieve a similar effect to that of an oscilloscope.
Fitting an energy waveform using fault injection results
The authors implemented the AES algorithm in a RISC-V architecture CPU using software and conducted a basic experiment to verify the correctness of this idea:
(1) For each moment during the first round of AES encryption, faults were injected at that moment, encrypting tens of thousands of times to see how many times the AES output an incorrect result.
(2) The counts of errors at each moment were used to create a curve (with time on the horizontal axis and error count on the vertical axis), yielding the results shown in the upper part of the figure below.
(3) The energy waveform of the first round of AES encryption was collected, yielding the results shown in the lower part of the figure below. The results indicate a strong correlation between the fault curve and the energy waveform.
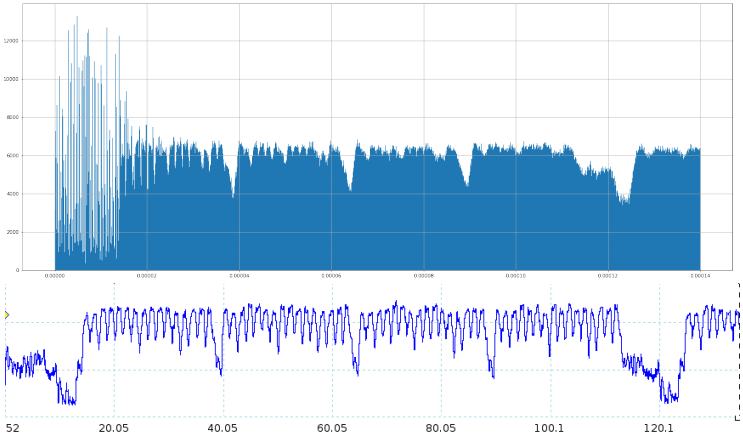
The upper figure shows the fault curve for the first round of the AES algorithm, with time on the horizontal axis and error count on the vertical axis; the lower figure shows the energy waveform for the first round of the AES algorithm, with time on the horizontal axis and power consumption on the vertical axis.
What causes this correlation? The editor attempts to explain this issue using the concept of “fault sensitivity” proposed by Dr. Li Yang from the University of Electro-Communications in Japan in 2010 [4]: The occurrence of faults depends on the strength and weakness of their physical conditions, which often have “data dependence”. For instance, in the case of power glitches, when a specific moment in a cryptographic operation requires consuming more energy due to specific data, if an attacker reduces its energy supply through a power glitch, a fault is likely to occur; whereas if the data being processed at that moment happens to consume less energy, injecting the same power glitch would make the fault less likely to occur. Thus, in this scenario, the count of errors is positively correlated with energy consumption.
Simple Fault Attacks and Related Fault Attacks
In classical energy analysis, there are simple power analysis (SPA) and correlation power analysis (CPA); can fault curves also be used for similar attacks?
The authors ran the avr-cryptoLib RSA algorithm library on the Xmega32a4u microcontroller, then used power glitches to perform multiple fault injections at each moment during its execution, resulting in the fault curve shown in the figure below. By conducting experiments similar to simple power analysis, it can be observed that the RSA keys 0 and 1 embedded in the fault curve can be distinctly separated, indicating that the RSA algorithm can be compromised through simple fault attacks.
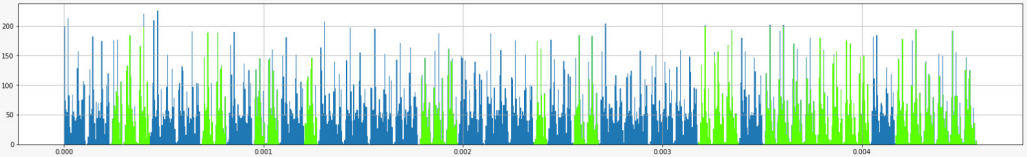
Results of simple fault analysis on the fault curve of the RSA algorithm in the Xmega32a4u microcontroller. (Note: The original text does not specify the meaning of the blue and green colors; based on the editor’s experience, green likely represents key 0 corresponding to square operations, and blue represents key 1 corresponding to square and multiplication operations; the correct key is binary
110001100100101111000111010011110001000000001000000)
Subsequently, the authors conducted related fault analysis similar to correlation power analysis on the AES algorithm across various platforms. The specific method involved:
(1) Randomly selecting 1000 plaintexts for encryption, while injecting faults during the encryption process. After encrypting each plaintext several times, a fault curve could be obtained based on the count of errors, resulting in 1000 fault curves from 1000 plaintexts.
(2) Investigating the first key byte of the AES algorithm, guessing its value from 0 to 255.
(3) Based on the current guess value of the key byte and the known 1000 plaintexts, calculating the corresponding Hamming weight of the S-box output for the first round yields 1000 Hamming weight values.
(4) Calculating the correlation between the 1000 Hamming weights and the 1000 fault curves; if the correlation is high, it indicates that the current key guess is correct; otherwise, it indicates that the guess is incorrect.
(5) Performing steps (2) to (4) for the remaining 15 key bytes to recover all 16 bytes of the key.
The figure below presents the efficiency evaluation results of performing related fault analysis on the Simple-AES algorithm library executed on the STM32F103C8T6 microcontroller. The experiment shows that 530,000 encryptions are required to recover 15 bytes of the key, and when the number of encryptions rises to 700,000, all 16 bytes of the AES key are correctly recovered.
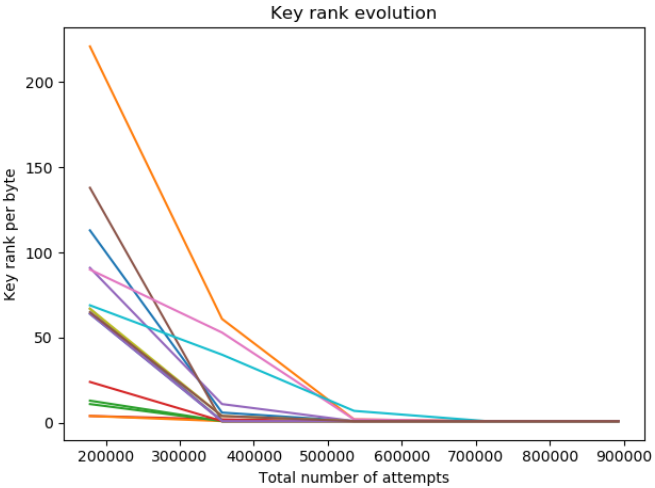
Experimental results of related fault analysis on the AES algorithm in the STM32F103C8T6 microcontroller; each curve corresponds to a key byte, with the horizontal axis indicating the number of encryptions used to recover the key, and the vertical axis indicating the guessing entropy of the current key byte; a smaller guessing entropy indicates a more accurate key recovery.
Summary and Outlook
The authors attempted similar experiments on various brands of chips, including STM32F103C8T6, gd32vf103cb, and Xmega32a4u, implementing software versions of the Simple-AES, Schwabe AES, avr-cryptoLib AES, and avr-cryptoLib RSA algorithm libraries, all yielding similar experimental results, indicating that the new method has strong universality.
While using fault injection techniques to “construct” an oscilloscope may seem inefficient, as each point on the fault curve requires tens of thousands of fault experiments to obtain, some may wonder why not simply encrypt once and collect an energy curve with an oscilloscope? The editor believes that this paper provides a new perspective on physical attacks on cryptographic chips, suggesting that fault attacks might be particularly effective when analyzing chips with countermeasures against energy attacks.
References
[1] Wang An, Ge Jing, Shang Ning, Zhang Fan, Zhang Guoshuang. Overview of Practical Cases of Side-Channel Analysis. Cryptography Journal, 5 (4): pp. 383-398, 2018.
[2] Shuyuan Technology, Side-Channel Analysis Teaching and Research Experimental Kit. http://www.mathmagic.cn/product_sca_set.htm, 2016.
[3] A. Spruyt, A. Milburn, Ł. Chmielewski. Fault Injection as an Oscilloscope: Fault Correlation Analysis. IACR Transactions on Cryptographic Hardware and Embedded Systems (TCHES), Vol. 2021, No. 1, pp. 192–216, 2021.
[4] Y. Li, K. Sakiyama, S. Gomisawa, et al. Fault Sensitivity Analysis. CHES 2010, LNCS 6225, pp. 320–334, 2010.