 Tip:Click the above“Our Happiness“↑Follow Us
 Written by/Qin Hongyan, Shu Zhaoxin
1. What is Chaos Engineering
With the development of microservices and cloud-native technologies, distributed systems have become prevalent in the industry, but they also bring many challenges, such as:
(1) Distributed systems are increasingly large, making it difficult to assess the impact of a single failure on the entire system.
(2) Complex dependencies between services, unreasonable configurations, and unavailability of individual services can collapse the entire service.
(3) Long request chains, inadequate monitoring alerts, and logging make it difficult to locate issues.
(4) Rapid business and technical iterations exacerbate the impact on system stability.
In complex distributed systems, we should strive to identify as many risks as possible before abnormal scenarios are triggered and then take targeted reinforcement measures. Chaos engineering is precisely a method that uses fault injection to help address the above issues. Chaos engineering aims to eliminate failures in their infancy by actively inducing faults, testing the system’s behavior under various pressures, identifying and fixing fault issues, and avoiding severe consequences.The testing department at BeiYan uses chaos engineering experimental tools for fault injection, conducting a series of testing explorations and practices for distributed architecture systems.
2. Chaosblade Chaos Engineering Experimental Tool
Chaosblade Application Scenarios
Chaosblade is an experimental execution tool that follows the principles of chaos engineering. It is built on nearly a decade of fault testing and rehearsal practices at Alibaba, combined with the best ideas and practices from various Alibaba businesses, and can provide rich fault scenario implementations to help distributed systems enhance fault tolerance and recoverability. Chaosblade can solve the following problems in practical applications:
(1) Measuring the fault tolerance of microservices
By simulating call delays, service unavailability, and full machine resources, we can check whether the failing nodes or instances are automatically isolated or taken offline, whether traffic scheduling is correct, and whether contingency plans are effective.
(2) Verifying the rationality of container orchestration configurations
By simulating pod kills, node kills, and increasing pod resource loads, we can observe the availability of system services and verify the rationality of replica configurations, resource limit configurations, and containers deployed under the pod.
(3) Verifying the timeliness of monitoring alerts
By injecting faults into the system, we can verify whether monitoring indicators are accurate, whether monitoring dimensions are complete, whether alert thresholds are reasonable, whether alerts are timely, whether alert access is correct, and whether notification channels are available, thereby enhancing the accuracy and timeliness of monitoring alerts.
(4) Testing the robustness of the Pass layer
By simulating upper-level resource loads, we can verify the effectiveness of the scheduling system; simulate the unavailability of dependent distributed storage to verify the system’s fault tolerance; simulate the unavailability of scheduling nodes to test whether scheduling tasks automatically migrate to available nodes; and simulate primary-backup node failures to test whether primary-backup switching is normal.
(5) Locating and resolving emergency capabilities
By conducting fault raids, randomly injecting faults into the system, we can assess the emergency capabilities of relevant personnel regarding issues, as well as the reasonableness of issue reporting and processing workflows, achieving a battle-tested approach to train the ability to locate and resolve issues.
Chaosblade Implementation Principle
From the design phase, Chaosblade considered ease of use and convenience for scene expansion, making it easy for everyone to use and expand more experimental scenarios according to their needs, which can be divided into the following areas.
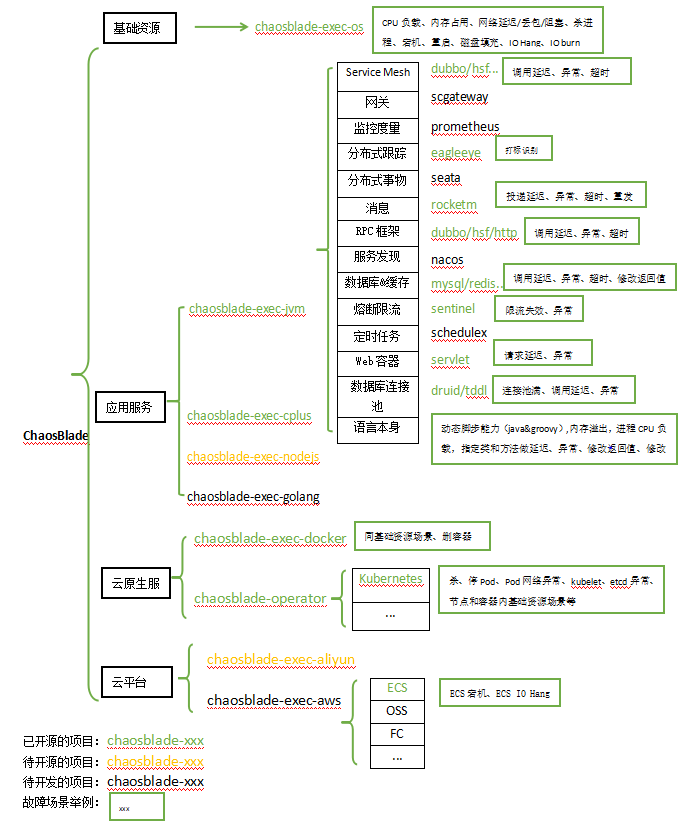
Figure 1 Chaosblade Abnormal Scenario Description
To better understand the implementation logic of Chaosblade, we obtained the source code of the open-source version of the tool and analyzed common commands, such as CPU faults, disk full, network blockage, and process hang-ups. Taking CPU faults as an example, we briefly analyze as follows.
(1) Command Description
Table 1 CPU Fault Command Description
|
CommandExample |
CPUFull Load |
./blade create cpu fullload |
|
CPULoad Percentage |
./blade create cpu load –cpu-percent 90 |
|
|
Parameter Description |
fullload |
Full Load |
|
cpu-percent |
Percentage, range(0-100) |
|
|
cpu-count |
Specify the number of CPUs to be fully loaded |
|
|
cpu-list |
Specify the specific cores of the CPU to be fully loaded, with core indexing starting from 0 |
(2) Implementation Principle
In the ./blade create cpu command, the CPU can be set to full load or a specific load percentage. The –cpu-count can specify the number of CPU cores to be fully loaded, and –cpu-list can specify the required CPU core numbers to be fully loaded. You can use forms like “1,3” to specify cores 1 and 3 to be fully loaded, or “0-3” to specify cores 0 to 3 to be fully loaded.
If you are not using the directly usable release version but the source code, then you need to compile the source code in front of Chaosblade, which will compile the files in the exec/bin/ directory into chaos_*** type executable files.
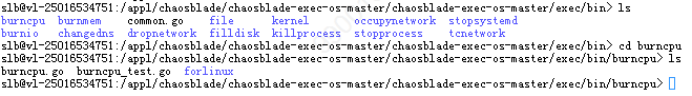
Figure 2 Chaosblade Source Code Version File Directory
By examining the source code, we find that the logic for implementing CPU full load in chaos_burncpu is simply to keep the CPU running. The code snippet is as follows:
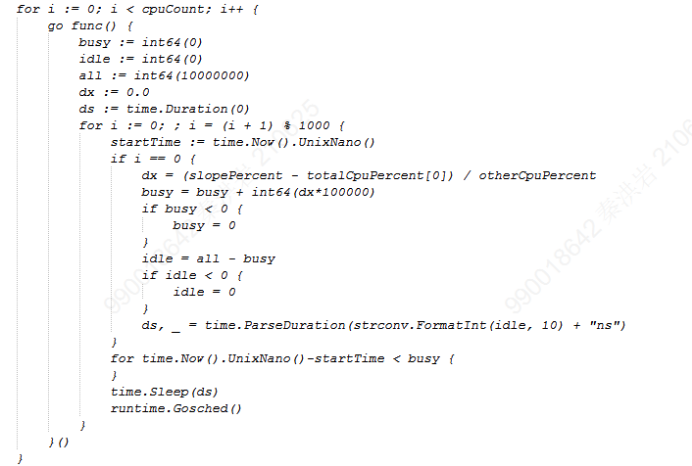
Figure 3 CPU Fault Code Snippet
Shutting down the CPU full load process is also relatively simple, divided into two steps:
Step 1: Use the command ps -ef | grep … to find the pid of chaos_burncpu.
Step 2: Use the kill -9 pid command to end it.
If it is the directly executable release version, you can see these chaos_*** executable files under the bin/ directory. Then, when using the ./blade create cpu fullload command, it actually transforms internally and directly calls bin/chaos_burncpu, while the blade executable file is just a CLI entry implemented using Cobra. (Cobra is a library for creating powerful modern CLI applications and a program for generating application and command files.)
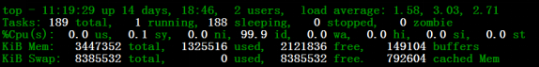
Figure 4 Chaosblade Release Version File Directory
Other faults, such as disk faults, are implemented using the dd command to achieve file copying, simulating high-speed disk read and write, and enhancing I/O load by adjusting block size. The principle for insufficient disk capacity is to create files in the specified path using the dd command or fallocate command. Network delays, packet loss, packet duplication, local port occupation, and packet reordering are matched against the parameter classRule in a source file based on user input commands. The implementation principle is the tc command, which is used for traffic control in the Linux kernel, primarily by establishing a queue at the output port to control traffic acceptance.
By analyzing the implementation principles, we can understand the underlying logic of fault generation and better simulate the production of business abnormal scenarios.
3. Fault Injection Testing Practice
We use Nginx as the load balancer to simulate the deployment architecture of a distributed business system, using passive health checks to detect server status. If a backend instance fails, Nginx is responsible for gradually removing the failed nodes. When the system is stable, we use the Chaosblade tool for fault injection and collect transaction requests and processing situations when the faults occur, testing the overall system’s stability and robustness in abnormal scenarios. The system deployment architecture is as follows:
The pressure client is Xmeter, and Nginx is deployed on two 4C8G PC servers, primarily performing 7-layer reverse proxy and gateway functions to distribute transaction request traffic to backend server boards.
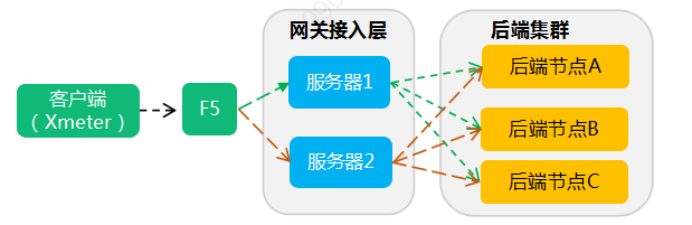
Figure 5 Nginx Testing Environment Deployment Architecture
Testing Scenarios
This test selects four common basic resource experimental scenarios from Chaosblade: CPU, disk, network, and processes. Referring to the Nginx testing environment deployment architecture, the fault node types are selected as backend servers and Nginx servers; for transaction requests, commonly used get and post requests are selected, totaling 48 test scenarios.
Table 2 Testing Scenarios
|
Serial Number |
Fault Node Type |
Request Type |
Abnormal Scenario Type |
Abnormal Scenario |
|
1 |
Backend Server/Nginx Server
|
getrequest/post request
|
CPU |
High CPU Load |
|
2 |
Disk |
High-speed Disk Read IO |
||
|
3 |
Insufficient Disk Space |
|||
|
4 |
Network |
Network Delay |
||
|
5 |
Packet Loss |
|||
|
6 |
Network Interruption |
|||
|
7 |
Process |
Process Hang |
||
|
8 |
Kill Process |
Testing Execution
Before executing the fault scenario tests, a good observation index should be designed for comparison with the experimental results to determine whether the experimental results meet expectations. The observation index should be easy to obtain and clearly reflect the issues in the distributed architecture system under abnormal scenarios. The experimental subject is the stability of the distributed architecture system Nginx after using the Chaosblade tool for fault injection, so the observation index is selected as the transaction error rate, with an error rate set to less than 1% as the stable state of the system, which can be generated using the pressure testing tool Xmeter.
The testing steps are to set the client timeout to 30 seconds, with a concurrency of 10, and Nginx using health check mechanism recommended parameter configurations, continuously applying pressure for 10 minutes, with normal operation for 3 minutes before the fault occurs. Additionally, after completing the fault injection test, remember to destroy the testing environment.
Below, taking a 90% CPU load as an example, we explain the fault injection and fault destruction execution. The TOP command can be used to observe the CPU occupancy to confirm the fault operation.

Figure 6 CPU Fault Injection
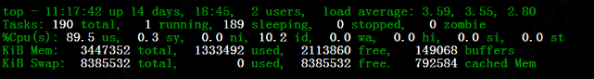
Figure 7 CPU Fault Injection Confirmation

Figure 8 CPU Fault Destruction

Figure 9 CPU Fault Destruction Confirmation
Testing Results Analysis
During the experiment, we set an error rate of less than 1% as the stable state of the system and compared the experimental results with the stable state for analysis: for the distributed architecture constructed in this article, under the above abnormal scenarios, the process hang (fault node being the backend server) did not reach the system’s preset stable state in terms of error rate, while other situations met expectations. Future focus needs to be placed on the process hang situation, requiring further analysis to confirm whether setting the error rate of less than 1% as the stable state of the system is reasonable, why there is a difference between the backend server and Nginx server, and whether program optimization is necessary.
Table 3 Testing Results Summary
|
Serial Number |
Abnormal Scenario |
Fault Node |
Request Type |
Success Rate |
|
1 |
High CPU Load |
Backend Server |
get |
100% |
|
post |
||||
|
Nginx Server |
get |
|||
|
post |
||||
|
2 |
High-speed Disk Read IO |
Backend Server |
get |
100% |
|
post |
||||
|
Nginx Server |
get |
|||
|
post |
||||
|
3 |
Insufficient Disk Space |
Backend Server |
get |
100% |
|
post |
||||
|
Nginx Server |
get |
|||
|
post |
||||
|
4 |
Local Delay 1 Second |
Backend Server |
get |
100% |
|
post |
||||
|
Nginx Server |
get |
|||
|
post |
||||
|
5 |
Local Delay 3 Seconds |
Backend Server |
get |
100% |
|
post |
||||
|
Nginx Server |
get |
|||
|
post |
||||
|
6 |
Local Delay 10 Seconds |
Backend Server |
get |
100% |
|
post |
||||
|
Nginx Server |
get |
|||
|
post |
||||
|
7 |
Local Packet Loss 30% |
Backend Server |
get |
100% |
|
post |
||||
|
Nginx Server |
get |
|||
|
post |
99.9999995% |
|||
|
8 |
Local Packet Loss 70% |
Backend Server |
get |
99% |
|
post |
99% |
|||
|
Nginx Server |
get |
99.75% |
||
|
post |
99.8% |
|||
|
9 |
Local Packet Loss 100% |
Backend Server |
get |
100% |
|
post |
99.9999987% |
|||
|
10 |
Network Interruption |
Backend Server |
get |
100% |
|
post |
99.99999963% |
|||
|
Nginx Server |
get |
99.999999% |
||
|
post |
99.999999% |
|||
|
11 |
Process Hang |
Backend Server |
get |
95% |
|
post |
85% |
|||
|
Nginx Server |
get |
99% |
||
|
post |
99% |
|||
|
12 |
Kill Process |
Backend Server |
get |
100% |
|
post |
99.999985% |
|||
|
Nginx Server |
get |
99.999999% |
||
|
post |
99.999999% |
4. Summary and Outlook
Testing Method Summary
Using the chaos engineering experimental tool Chaosblade for fault injection testing in the distributed architecture system Nginx can be roughly divided into ten steps:
(1) Determine the preliminary experimental requirements and subjects
Identify the distributed architecture system for abnormal scenario testing.
(2) Conduct feasibility assessments to determine the experimental scope
Conduct detailed assessments based on specific experimental requirements and subjects, usually including the following aspects: experimental indicators, experimental environment, experimental tools, fault injection scenarios, environmental recovery capabilities, etc., to determine a reasonable experimental scope.
(3) Design appropriate observation indicators
The design of observation indicators is one of the key factors for the success of the entire experiment. System observability has become a “mandatory function”; good system observability will provide strong data support for testing work, laying a solid foundation for subsequent experimental result interpretation, issue tracking, and final resolution.
(4) Design appropriate experimental scenarios and environments
Experimental scenarios: In actual production, fault scenarios vary widely, such as dependency faults, host faults, operating system faults, network faults, service layer faults, etc. When selecting experimental scenarios, it is important to base them on your experimental requirements and analyze where there may be weaknesses, thus designing fault scenarios for the experimental subjects accordingly to achieve precise fault generation.
Experimental environment: Choose an experimental environment applicable to the experimental subjects, such as development, testing, pre-production, or production environments. For non-production environments, simulate production traffic and architecture as closely as possible to verify the reliability of experimental scenarios and tools.
(5) Select appropriate experimental tools
Fault injection is a critical step in abnormal scenario testing. Currently, mainstream fault injection tools include Netflix’s open-source chaos engineering project – Chaos Monkey, PingCap’s open-source chaos engineering practice platform – Chaos Mesh, and Alibaba’s open-source chaos engineering experimental tool Chaosblade.
(6) Establish an experimental plan and execute the experimental process
The main purpose of the experimental plan is to determine relevant details, such as how the client simulates, how to set the server’s key parameters, whether there are requirements for the experimental duration, when the fault should occur, etc. After communicating with stakeholders and establishing the experimental plan, the experimental process can be executed according to the detailed steps.
(7) Collect experimental observation indicators
Collect the observation indicators designed in the early stage of the experiment. As mentioned earlier, observation indicators are key factors for determining the success of abnormal scenario testing; how to collect observation indicators in a timely and accurate manner should be determined during the early design phase, along with feasibility assessments.
(8) After the experiment is completed, clean up and restore the experimental environment
After completing the experiment, it is essential to clean up and restore the experimental environment; otherwise, the faults will persist and severely affect subsequent development and testing work. The Chaosblade experimental tool selected in this article requires manual execution of the fault destruction command unless the fault duration is set during the creation of the experiment. If other experimental tools are chosen, the fault destruction methods must also be strictly confirmed.
(9) Analyze experimental results
Compare the “experimental observation indicators” with the “stable state of the indicators”; the “stable state” refers to the state of normal system operation and can also be defined by certain indicators. Analyze whether the observation indicators collected under the abnormal scenarios of fault injection meet the requirements of the stable state; if they do, it indicates good system robustness, meaning that the system can still operate stably and without impact during faults; if not, the reasons and subsequent improvement measures need to be analyzed.
(10) Trace the root cause and resolve issues
For situations where the experimental observation indicators do not meet the stable state after fault injection, it is necessary to trace the root cause and resolve the issues. For cases that do not meet the stable state, further confirmation of the rationality of the stable state is required. If confirmed, then based on actual needs, targeted verification under other abnormal scenarios, fault nodes, request types, transaction types, etc. must be conducted to perform multi-angle comparative analysis to comprehensively analyze the reasons and identify the issues.
Outlook
Currently, how to verify the high availability principles of distributed architecture systems and how to quickly and comprehensively construct abnormal scenarios in distributed architecture systems are challenges in testing work. In the future, we will leverage chaos engineering experimental tools like Chaosblade to build a unified fault rehearsal platform, quickly providing fault injection capabilities covering basic resources, Java applications, C++ applications, Docker containers, Kubernetes platforms, and more; and establish standardized fault rehearsal processes and fault recovery standards, assisting in generating rehearsal tasks based on business system architecture will be our key research direction.

Qin Hongyan: Member of the Platform Application Testing Team at BeiYan, mainly responsible for testing work related to lightweight cloud application development platforms, integrated gateway platforms, external service platforms, and more.

Shu Zhaoxin: Functional Group Leader of the Platform Application Testing Team at BeiYan, has been working on the front lines of testing, uniting and leading team members to conduct testing on various technical middle platforms such as Taihang, Light Cloud, AIR, and intelligent anti-fraud platforms, database platforms, etc. He deeply explores testing highlights to provide stable and user-friendly platforms for developers in the center and the entire bank, striving to create more space and value for everyone.
Past Issues Review
19.【Woodpecker】Public DTO Joint Innovation Camp Series Report | Issue Seven
18.【Woodpecker】Public DTO Joint Innovation Camp Series Special Issue Six | Innovation Camp
17.【Woodpecker】”Three Steps” to Solve “Four Major Difficulties” – Taking You into the Testing Support Work Behind Insurance Business
16.【Woodpecker】Exploring City-level Dual-active Testing Methods to Assist Quick Payment Disaster Recovery Construction
15.【Woodpecker】Exploration and Practice of Testing Pre-movement Work
14.【Woodpecker】Public DTO Joint Innovation Camp Series Special Issue Five: Digital Treasury Performance Testing Practice
13.【Woodpecker】Full-link Production Pressure Test Practice – Wuyishan Commemorative Coin Production Pressure Test Record
12.【Woodpecker】2021, Qingtian Reaches New Heights
11.【Woodpecker】Construction of Security Testing System Processes
10.【Woodpecker】Party Building Empowerment of External Cooperation Management, Working Together to Improve Quality and Efficiency in Transformation
9.【Woodpecker】Public DTO Joint Innovation Camp Series Special Issue Four: Knowledge Workstation Construction
8.【Woodpecker】Woodpecker Forum DevOps Special Series Issue One – Excellent Practices of Personal Online Banking in DevOps Transformation
7.【Woodpecker】Discussing Functional Testing from a Technical Perspective
6.【Woodpecker】Public DTO Joint Innovation Camp Phase Results Series | Issue Three
5.【Woodpecker】Network Security Responsibility Heavy, Penetration Training Helps Improve – “Anti-Penetration Robot (RPA’s Network Security Application)” Special Training Successfully Held
4.【Woodpecker】Deepening Security Testing Skills Integration — “Innovative Youth, Empowering Security” Themed Technical Sharing Conference Successfully Held
3.【Woodpecker】New Measures for Total and Branch Linkage, Business and Technology Integration to Promote Transformation
2.【Woodpecker】Public DTO Joint Innovation Camp Phase Results Series | Issue Two Application View and Event Sharing Library Construction
1.【Woodpecker】New Year Message: New Day Shining with Original Intent, Horns Sounding to Start the Journey
Editor-in-Chief: Cao Ning
Editor: Ma Lin
Design: Zhang Na
Technical Support: Chen Xi, Li Zhenzhong


Our Happiness · Editorial Department
(Woodpecker)

Long press the QR code to follow us
■Welcome to submit: please name according to “Work Name – Author – Department” and send to [email protected]