Electrochemical Impedance Spectroscopy (EIS) can be used to analyze the internal electrochemical processes of lithium-ion batteries. The data is generally fitted using an Equivalent Circuit Model (ECM) to extract parameters related to specific electrochemical processes. Due to the difficulty in separating various electrochemical processes in EIS, the Distribution of Relaxation Times (DRT) method has been introduced in recent years to perform deconvolution analysis of the impedance curve in the time domain, allowing for the separation of polarization effects that typically overlap in the frequency domain. The DRT method reflects the complex physical processes within the battery through peaks of different amplitudes and time constants.
Although previous studies have explored the application of DRT in battery degradation analysis, limitations still exist, particularly in the attribution analysis of DRT peaks at different cycling stages. The authors of this paper experimentally validate and analyze the correlation between DRT peaks and specific degradation mechanisms during battery aging, using results from three-electrode battery measurements, which can provide references for the development of State of Health (SOH) estimation methods for batteries.
1 Experiment
1.1 Battery Fabrication
The 8 cm (width) × 10 cm (length) soft-pack lithium-ion battery used in the experiment employs nickel-cobalt-manganese oxide (LiNi6.5Co0.7Mn2.8O2) as the cathode material and graphite (battery grade) as the anode material. The electrolyte is 1 mol/L LiPF6/ EC+DEC+EMC (mass ratio 3:2:5). The separator is designed with one side coated with glue and the other with ceramic, using polyvinylidene fluoride (PVDF) as the binder and conductive carbon black SP (battery grade) as the conductive agent, and the battery is fabricated in a dry room with a dew point below -40 °C. The cathode and anode sheets are cut to sizes of 40 mm × 50 mm and 42 mm × 53 mm, respectively, with the separator measuring 50 mm × 60 mm. Copper wire with a diameter of 50 μm is prepared, and the soft-pack three-electrode battery is assembled in a glove box using a stacking method, following the order of anode-separator-copper wire-separator-cathode for a single-layer stack. 1 mL of electrolyte is injected, and the assembly is vacuum-sealed, with the copper wire inserted between the anode and cathode to form a reference electrode for subsequent lithium plating operations.
1.2 Testing Conditions and Methods
At 25 °C, the three-electrode battery is cycled until the capacity retention rate is approximately 80%. The battery is charged at a constant current of 1.00 C to 4.25 V, then switched to constant voltage charging at 0.05 C; it is discharged at a constant current of 1.00 C to 2.80 V. EIS, Incremental Capacity (IC), and Differential Voltage (DV) tests are conducted before cycling, during defined cycling steps (every 100 cycles), and after cycling, all at 25 °C in a temperature-controlled chamber. Both IC and DV tests are performed by charging at a constant current of 0.10 C to 4.25 V, resting for 0.5 h, and then discharging at a constant current of 0.10 C to 2.80 V. EIS tests are conducted under 0 to 100% State of Charge (SOC) conditions, measuring the impedance of the full battery, cathode, and anode every 10% SOC, applying a 5 mV sinusoidal perturbation voltage, with a frequency range of 10-2 to 106 Hz, measuring 10 frequency points per decade. For lithium plating operations on the three-electrode setup, a current of 30 μA is used to plate lithium onto the copper wire for 4 hours.
1.3 DRT Spectrum Analysis
All EIS measurement results are validated through Kramers-Kronig (KK) analysis to ensure that the residuals between the measured spectrum and the reconstructed KK spectrum are within an acceptable range (below 1.0%), ensuring the reliability of DRT calculations. The DRT calculation is based on the assumption of representing impedance as an infinite number of RC elements in series with a resistor, as shown in Equation (1):
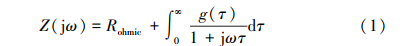
In Equation (1): Z is the impedance; Rohmic is the ohmic resistance; g(τ) is the time relaxation characteristic function of the evaluated electrochemical system, satisfying the non-negativity condition; j is the imaginary unit; ω is the angular frequency; τ is the time constant. The integral in Equation (1) is typically normalized, ultimately becoming:
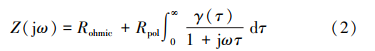
In Equation (2): Rpol is the total polarization resistance; γ(τ) / (1+jωτ) represents the relative differential contribution of a single ohmic-capacitive element. By decomposing the γ(τ) function into peaks of different amplitudes and time constants, different physical processes within the battery can be distinguished. Therefore, high-quality and time-invariant EIS measurement results are crucial; otherwise, the attribution of peaks in the γ(τ) function will be unreliable.
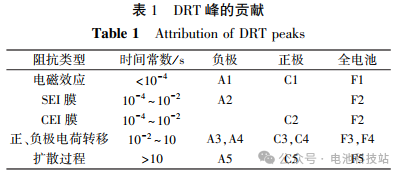
To accurately attribute the physical processes of DRT peaks, the DRT measurement results of the full battery, cathode, and anode in the soft-pack three-electrode battery are compared to distinguish the electrochemical processes of the cathode or anode. Based on the values of the time constants, specific peaks can be attributed to certain defined physical processes. DRT peaks can generally be divided into four main processes: ① Electromagnetic effects (τ<10-4 s); ② Li+ transport through the SEI film or the cathode electrolyte interphase (CEI) film (10-4 s ≤ τ ≤ 10-2 s); ③ Charge transfer processes of the electrodes (10-2 s < τ ≤ 10 s); ④ Diffusion processes (τ > 10 s).
2 Results and Discussion
2.1 Cycling Data
The cycling life test of the soft-pack three-electrode battery is conducted. The capacity change and retention rate of the battery during cycling are shown in Figure 1(a); the voltage-capacity curves of the soft-pack three-electrode battery at different cycle counts under 0.10 C charge-discharge are shown in Figure 1(b).
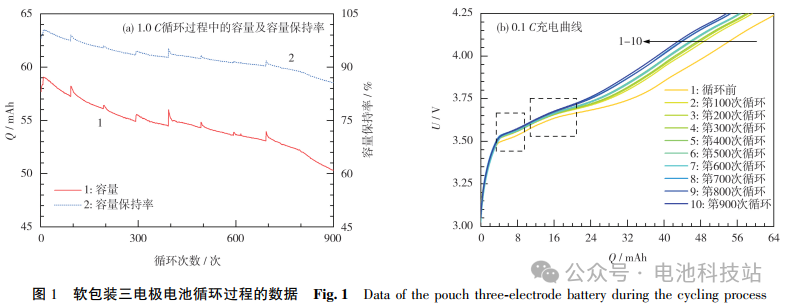
From Figure 1(a), it can be seen that the capacity of the battery decreases from 58.77 mAh in the first cycle to 50.32 mAh in the 900th cycle, with a capacity retention rate of 85.6%. Due to a 0.10 C small current charge-discharge performed every 100 cycles, slight fluctuations appear in the curve in Figure 1(a) at every 100 cycles. From Figure 1(b), it can be observed that as cycling progresses, the voltage plateau slightly shifts towards lower capacity, primarily due to the loss of battery capacity. The change in the voltage plateau during the charging process (black box) is related to the phase change of the materials during charging.
2.2 DRT Spectrum Analysis
Taking the 40% SOC condition as an example, the changes in the DRT curves of the full battery, cathode, and anode are shown in Figure 2. In the attribution analysis of DRT peaks, by comparing the DRT curves of the anode [Figure 2(c)] and cathode [Figure 2(b)] with that of the full battery [Figure 2(a)], the physical attributions of different DRT peaks are identified. In most cases, peaks 2, 3, and 4 show significant changes with increasing cycle counts, and these changes have a clear correlation with the increase in cycle counts.
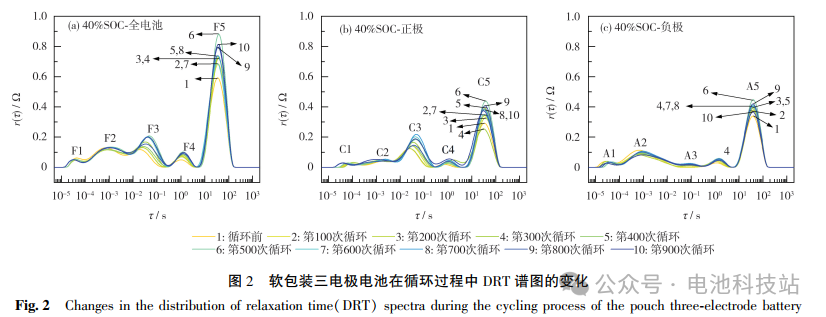
In Figure 2, each curve exhibits five distinct peaks. Peak 1: A1, C1, and F1 have the same time constant (approximately 5 × 10⁻⁵ s) and similar amplitudes (peak heights), showing little influence from SOC changes, typically attributed to electromagnetic effects between particles and between particles and current collectors; thus, peak 1 is related to these effects. Peak 1 shows no significant correlation with the cycling count (capacity retention rate), indicating that electromagnetic effects do not exhibit any specific degradation during cycling.
Peak 2: A2, C2, and F2 have similar time constants (approximately 1 × 10⁻³ s). Given its time constant, comparing the amplitudes of the peaks indicates that the F2 peak of the full battery is influenced by both the SEI layer of graphite and the CEI layer on the cathode surface. The amplitude of the F2 peak shows a fluctuating increase with the increase in cycle counts, possibly related to the growth or decomposition of the SEI film. Additionally, the amplitude of the A2 peak is slightly larger than that of the C2 peak, but neither shows a significant correlation with battery life degradation (capacity retention rate).
Peak 3: The A3 peak is minimal and shows no significant change with cycle counts, while the corresponding F3 peak aligns with the time constant range of the C3 peak (3 × 10⁻² ~ 8 × 10⁻² s). Given its time constant, the F3 peak is attributed to the C3 peak, which corresponds to the charge transfer process of the cathode. As the cycle count increases, the amplitude of the C3 peak shows an overall upward trend, and the time constant shifts towards larger values, indicating that cathode degradation becomes severe after a certain number of cycles. The F3 peak exhibits similar behavior, likely related to the degradation of the cathode material.
Peak 4: The A4 peak exhibits behavior similar to that of the C4 peak but with a lower amplitude, with the highest peak corresponding to a time constant of approximately 2 s. Based on its time constant range, the A4 peak can be attributed to the charge transfer process of graphite; similarly, the C4 peak is attributed to the charge transfer process of the NCM cathode (10-1 ~ 100 s); the F4 peak is attributed to the combined contributions of charge transfer processes between the anode and cathode. The amplitude of the A4 peak shows little variation with cycling, while the amplitude of the C4 peak shows a slight increasing trend. This phenomenon is related to electrode degradation, as it affects the charge transfer process. The F4 peak also shows a similar slight increasing trend.
By observing the amplitudes of the peaks, it can be seen that as cycling progresses, the A3/A4, C3/C4, and F3/F4 peaks all exhibit typical behaviors of charge transfer processes, indicating that with the increase in cycle counts, the overall trend of the peak amplitudes related to charge transfer processes increases. This is distinctly different from the A2, C2, and F2 peaks related to the SEI film.
Peak 5 shows the maximum amplitudes of the full battery, cathode, and anode as cycle counts change. Given its time constant greater than 10 s, this peak can be attributed to diffusion processes. Since the amplitudes of the A5/C5 peaks are similar, the F5 peak is attributed to the diffusion processes of both electrodes. As the cycle count increases, the overall trend of the F5 peak amplitude increases, possibly related to the overall slowdown of battery kinetics.
The physical process attributions of different DRT peaks are listed in Table 1.
Throughout the cycling process, an in-depth analysis of the DRT curves of the battery is conducted, focusing on the changes in film resistance (Rf) and charge transfer resistance (Rct). The Rf and Rct of the full battery, cathode, and anode at different cycle counts under 0 to 100% SOC conditions are shown in Figure 3. In Figure 2, the integral areas of peaks F2, C2, and A2 correspond to the Rf of the full battery, cathode, and anode, respectively; the sum of the integral areas of peaks 3 and 4 reflects the Rct of the corresponding electrodes.
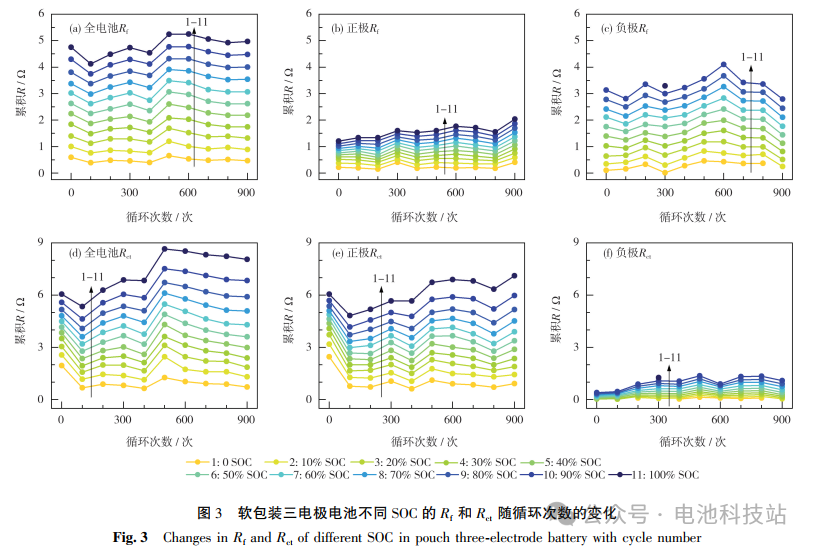
From Figure 3, it can be seen that Rf and Rct exhibit certain differences in distribution ranges under different SOC and cycle counts: Rf is related to the SEI layer, and within the tested SOC range, the trend of Rf for the full battery, cathode, and anode shows no significant change with cycle counts and is generally not related to SOC; the Rf of the full battery is primarily provided by the anode; Rct is closely related to the charge transfer process, and under all cycle counts, the Rct of the full battery and cathode shows a significant increasing trend with increasing cycle counts at low and high SOC conditions, exhibiting a typical U-shaped variation pattern with increasing SOC, and increasing with cycle counts, while the Rct of the anode shows a weaker correlation with cycle counts and SOC; the Rct of the full battery is primarily provided by the cathode. From Figure 1, it can be seen that the battery capacity generally exhibits a linear degradation process until the 700th cycle, when the slope of capacity degradation changes, possibly corresponding to the so-called “dive point.” This corresponds to a sudden increase in the Rct of the anode at the 700th cycle [Figure 3(c)]. At different cycle counts, the Rf of the anode [Figure 3(c)] shows only slight fluctuations with SOC changes. Similarly, for the Rf of the cathode [Figure 3(b)], the resistance is lower and shows less variation with SOC compared to other impedances. Therefore, the F2 peak in Figure 2(a) is almost entirely provided by the ionic transport resistance Rf in the graphite SEI layer.
The above results indicate that, except for before cycling, the Rf of the full battery remains relatively stable with fluctuations during the first 900 cycles, possibly related to the growth or decomposition of the SEI film; while Rct continuously increases with cycling, primarily influenced by the degradation of the cathode material. Overall, the impedance of the battery increases continuously during cycling, with the main influencing factor being the gradual increase of Rct, indicating that the decline in battery performance is mainly due to the degradation of the cathode material; at the same time, the cathode material has the greatest impact on the overall increase in impedance, thus improving the electrochemical performance of the cathode material is key to enhancing the overall performance of the battery. Additionally, the magnitude of the impedance has a certain relationship with SOC; during battery use, avoiding operation at the extremes of empty and full states can reduce the internal resistance of the battery, thereby minimizing performance degradation.
2.3 Differential Voltage (DV) AnalysisDuring the 900 cycles of the soft-pack three-electrode battery, the DV curves every 100 cycles are shown in Figure 4.
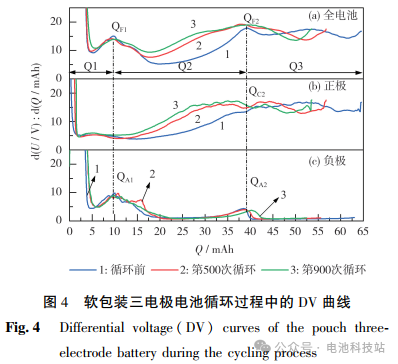
In Figure 4, during the charging process, the positions of peaks QF1 and QF2 of the full battery have not changed significantly, but the intensity and shape have changed noticeably. The change in peak QF1 corresponds to the change in the anode peak QA1, where it can be seen that the position of the anode peak QA1 has not changed significantly during cycling, mainly showing changes in shape and slight changes in intensity, possibly corresponding to minimal loss of active material in the anode. The change in peak QF2 corresponds to the changes in the cathode peak QC2 and the anode peak QA2. Since the intensity and size changes of the anode peak QA2 are relatively small, the changes are mainly due to the position and shape changes of the cathode peak QC2. The change in the cathode peak QC2 mainly shifts towards lower capacity, and the intensity continues to increase, indicating possible loss of active lithium and loss of active material in the cathode. Additionally, the distance between peak QF2 and the charging cutoff curve is represented by Q3. Q3 continuously decreases as charging progresses, corresponding to the loss of charging capacity during the cycling aging process. The changes in the anode peaks QA1 and QA2 are relatively small, while the changes in the cathode peak QC2 are significant, indicating that the main failure mode is the loss of active material in the cathode. This validates the results of the DRT analysis, indicating that the increase in charge transfer resistance of the cathode during cycling is the primary cause of the increase in overall battery impedance, thereby affecting the battery capacity.
2.4 Incremental Capacity (IC) Analysis
The charging IC curves of the full battery at different cycle counts in the soft-pack three-electrode battery are shown in Figure 5(a); the changes in intensity (U) and position (dQ/dU) of peaks V1 and V2 as the battery ages are shown in Figure 5(b).
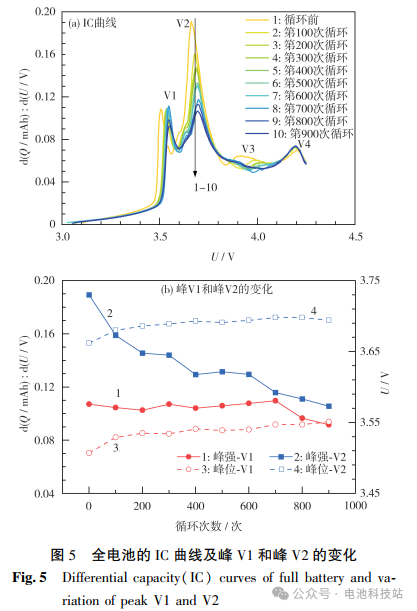
In the curve of Figure 5(a), four characteristic peaks (V1, V2, V3, and V4) can be observed. The initial maximum intensities of peaks V1, V2, V3, and V4 are approximately 3.51 V, 3.67 V, 3.97 V, and 4.20 V, respectively. Peak V1 is mainly influenced by the anode reaction, while peak V2 may be dominated by the phase change process of Ni2+ → Ni3+ → Ni4+ in the NCM cathode. The area of each peak represents the capacity related to the corresponding reaction during cycling. By recording the changes in intensity and position of these characteristic peaks, the changes in the mechanisms of the processes during battery degradation can be analyzed. From Figure 5(b), it can be seen that as the battery ages, the intensity of peak V1 remains relatively stable during the first 700 cycles; during the 700 to 900 cycles, it continuously decreases, with a change in intensity of 14%. The intensity of peak V2 decreases continuously with the worsening state of battery aging, dropping by 44% compared to the initial intensity at the 900th cycle, consistent with some studies based on NCM, further validating the critical impact of NCM cathode on the overall performance of the battery during aging. The change in V2 is greater than that of V1, indicating that the degradation of the cathode material is the main reason for capacity degradation, confirming the previous results of the DRT analysis. Through the analysis of IC and DV curves, it is further validated that the aging of NCM cathode material has a critical impact on the overall performance of the battery.
3 Conclusion
This paper integrates EIS and DRT analysis methods to explore the aging process of soft-pack lithium-ion batteries and reveals the time constants of different electrochemical processes and their impact on battery performance degradation. The DRT method is a powerful analytical tool that can separate overlapping polarization effects in the frequency domain through deconvolution of EIS measurement data, associating different electrochemical processes with their corresponding time constants. In the 900-cycle aging test, by analyzing the DRT curves of the cathode, anode, and full battery, the electrochemical processes of the cathode and anode are distinguished, and these processes are correlated with specific DRT peak values of the full battery. The experiments summarize five DRT peak-related physical processes and degradation mechanisms: Peak 1 is related to electromagnetic effects; Peak 2 is related to ionic transport through the SEI layer of the graphite anode; Peak 3 is related to the charge transfer process of the cathode; Peak 4 is related to the charge transfer reactions of both the graphite and the cathode; while Peak 5 is primarily attributed to diffusion processes. Through IC and DV analysis, it is further validated that the aging of NCM cathode material has a critical impact on the overall performance of the battery. These analytical results are consistent with the trends in peak changes obtained from the DRT method, validating the reliability of the method. The proposed method can be generalized to different types of lithium-ion batteries and is expected to provide theoretical support for the estimation of battery SOH and the construction of battery models, especially under high-rate cycling conditions. Future research can further optimize the DRT analysis method and explore its applicability in other battery chemical systems (such as lithium iron phosphate, nickel-cobalt-aluminum materials) to develop more reliable battery aging assessment tools.
[References] Cui Guanqi, Li Lijuan, Song Linfei, et al. Analysis of Lithium-Ion Battery Cycle Degradation Using DRT Method. Battery, 2025,(3):497-502. DOI: 10.19535/j.1001-1579.2025.03.012.