Today, we will analyze logs using Linux commands in a practical work scenario. This includes many useful tips that can significantly aid in performance testing, analyzing online logs, understanding user behavior, and troubleshooting issues.
1. Can we do this?
When we want to analyze an online file, the first question to consider is whether we can do this. You can start by using the htop command to check the current load.
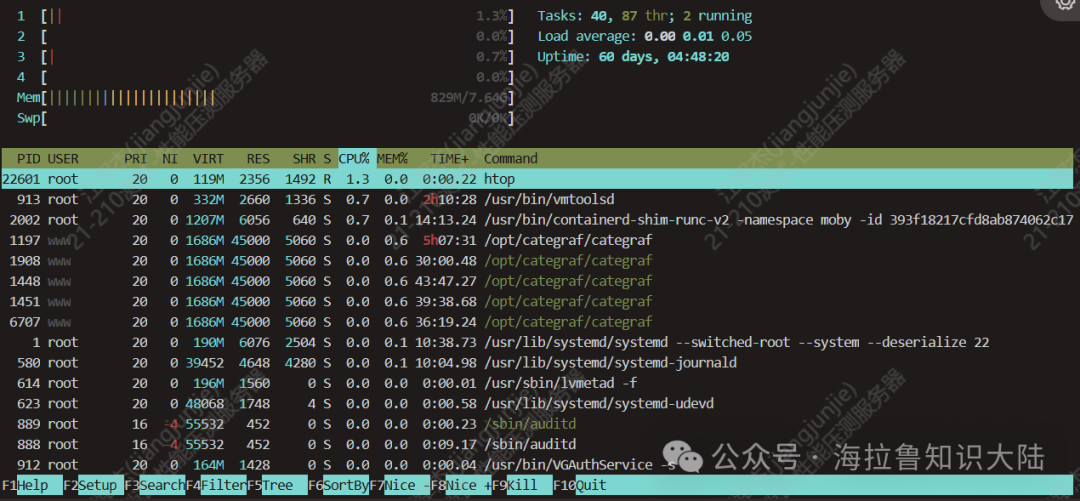
As shown in the figure above, my machine has 4 CPUs with almost 0 load and 1GB of memory used out of 8GB.
If we need to analyze the nginx logs, we first check the file size using ls. In the figure below, I used –block-size to display the file size in MB.
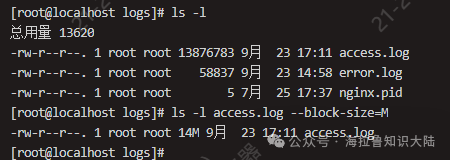
After confirming that the CPU and memory on the current machine allow for analysis, we can proceed to the second step. This file is only 14MB, so its impact on the online environment can be considered negligible. If the file is too large, it is recommended to use the scp command to copy the file to an idle server for analysis.
2. LESS log files
Before analyzing the logs, we should use less to view the contents of the log. As discussed previously, it is advisable to use less, which does not require reading the entire file, because executing cat online can be very risky and may lead to insufficient resources on the online server.
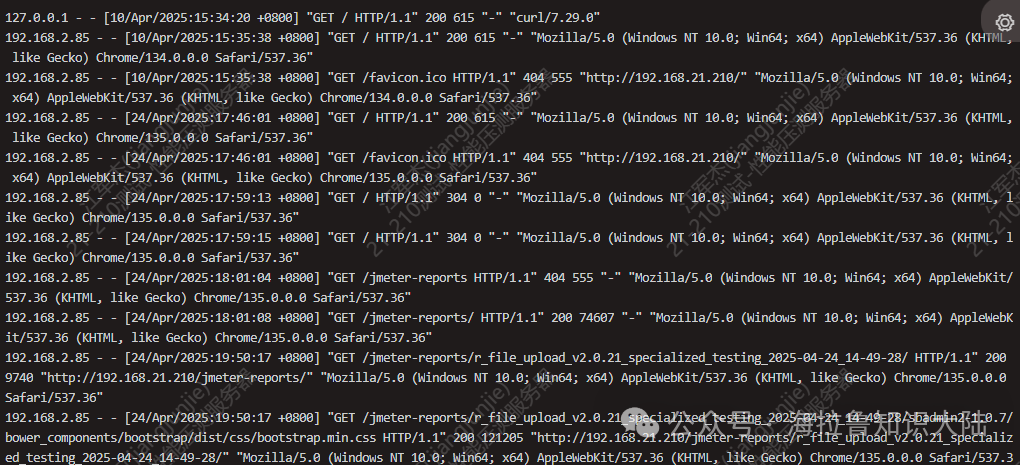
As shown in the figure above, we see that each line in the nginx access_log represents a user visit, with the following fields from left to right:
-
IP Address;
-
Time;
-
HTTP request method, path, protocol version, and returned status code;
-
User Agent.
3. PV Analysis
PV (Page View) refers to each time a user visits a page. For those involved in performance analysis, this is a familiar concept. For nginx’s access_log, analyzing PV is quite simple; we can directly use wc -l to see the total PV count.

As shown in the figure above, we see a total of 34,948 PVs.
4. Grouping PVs
Typically, a log may contain several days of PV data. To obtain more intuitive data, it is sometimes necessary to group by day. To simplify this problem, let’s first check which days of logs are present.
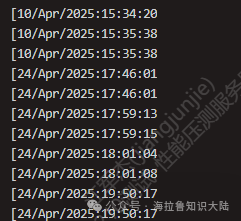
Using awk '{print $4}' access.log | less can yield the following results. Awk is a domain-specific language for text processing. This involves the concept of a Domain Specific Language (DSL), which is a language designed specifically for a particular domain. For example, awk is a DSL for analyzing and processing text, HTML is a DSL for describing web pages, and SQL is a DSL for querying data…
We can see that we use $4 to represent the fourth column of the text, which is the column containing the time, as shown in the figure below:
To count by day, we can utilize awk’s string manipulation capabilities.
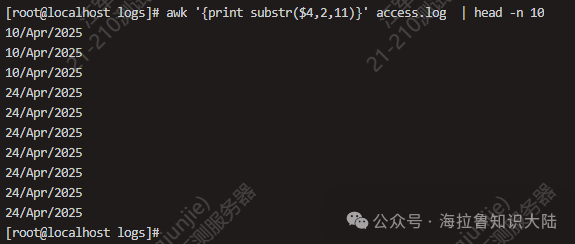
In the figure above, we use awk’s substr function, where the number 2 indicates starting from the second character, and the number 11 indicates extracting 11 characters.
Next, we can group and count the number of log entries per day.
awk '{print substr($4,2,11)}' access.log | sort | uniq -c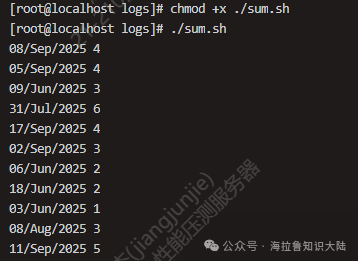
In the figure above, we use sort for sorting, and then uniq -c for counting. You can see the logs from different dates, and the daily PV count is generally between dozens to hundreds.
5. Analyzing UV
Next, we analyze UV. UV (Unique Visitor) refers to counting the number of visitors. Identifying users can be complex, but we can approximate UV using IP access.
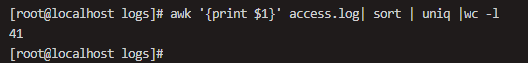
In the figure above, we use awk to print $1, which is the first column, then sort, and finally use uniq to remove duplicates, and wc -l to check the count. This way, we find that there are a total of 41 IPs in the log file, which means there are41 UVs.
6. Grouping UV Analysis
Next, we attempt to analyze the daily UV situation by grouping. This situation is more complex and requires more commands. We first create a bash script file named sum.sh and write the following content:
#!/usr/bin/bash
awk '{print substr($4, 2, 11) " " $1}' access.log |
sort | uniq |
awk '{uv[$1]++;next}END{for (ip in uv) print ip, uv[ip]}'
The specific analysis is as follows:
-
At the beginning of the file, we use #! to indicate that we will use /usr/bin/bash to execute this file.
-
In the first awk, we concatenate the date from the fourth column with the IP address from the first column.
-
The sort command sorts the entire file in dictionary order, effectively sorting first by date and then by IP.
-
Next, we use uniq to remove duplicates, keeping only one entry for rows with the same date and IP.
-
Finally, the last awk counts based on the first column (date) and the second column (IP).
To help understand the last line, let’s briefly understand how awk works.
Awk processes input line by line. Therefore, the next keyword tells awk to move to the next line of input. For each line of input, awk accumulates based on the string in the first column (the date). The END keyword represents a trigger; the statements enclosed in {} after END will execute after all input has been processed. After all input is processed, the results are accumulated in uv, and we can print the IP and its corresponding count by iterating through all keys in uv.
After writing the above script, we save and exit the editor. Then we execute chmod +x ./sum.sh to add execution permissions to sum.sh. We can then execute it as shown in the figure below to obtain results:

As shown, the IP addresses have been successfully grouped by day.
7. Conclusion
Today, we combined a simple practical scenario—nginx log analysis and statistics practice. In fact, there are mature templates available for directly monitoring nginx logs using ELK or other tools. Additionally, we learned about the powerful awk text processing language. In practice, we performed simple data analysis on an nginx access_log and visually observed the access situation.
In our daily work, we encounter various types of logs, including not only nginx logs but also application layer logs, frontend logs, monitoring logs, etc. We can perform data analysis and performance evaluations on these logs.