A Comprehensive Guide to Linux Server Performance Troubleshooting
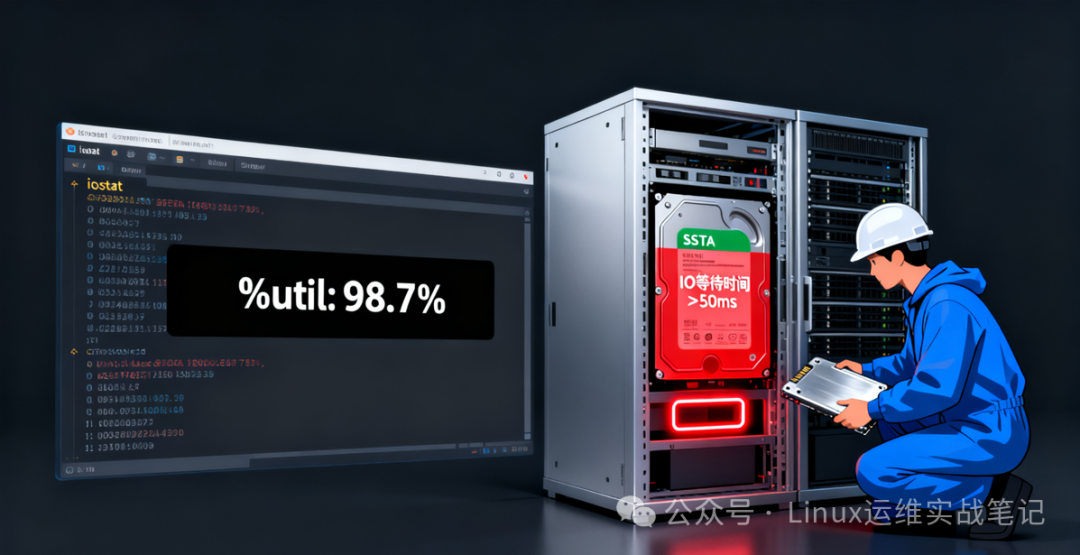
Introduction: At 2 AM, my phone suddenly buzzed—”CPU usage has soared to 95%!” As an operations engineer, have you ever experienced such a “firefighting” moment? Don’t panic! Master this set of performance troubleshooting “combination punches”, and you can identify the root cause in 3 minutes, calmly addressing various performance crises.
🥊 Step 1: Macroscopic Positioning (TOP Command)
Open the terminal, and the first reaction is to use <span>top</span>!
topKey Indicator Interpretation:
- • %Cpu(s): us (user) too high? → Might be an application issue; sy (system) too high? → Might be a kernel or I/O issue
- • KiB Mem: Check memory usage, pay attention to the difference between free and available
- • PID List: Sort by
<span>P</span>(CPU),<span>M</span>(memory),<span>T</span>(time) to quickly locate the “culprit” process
💡 Tip: Press
<span>1</span>to view the usage of each CPU core, and press<span>z</span>to enable color highlighting.
🔍 Step 2: In-Depth Drilling (Advanced Commands)
CPU Issues → <span>pidstat</span> & <span>vmstat</span>
# Output every 2 seconds, for a total of 5 times
pidstat -u 2 5

# View overall system status (context switches, interrupts, etc.)
vmstat 2 5- • Focus on:
<span>%usr</span>(user mode),<span>%system</span>(kernel mode),<span>%iowait</span>(I/O wait)
Memory Issues → <span>free</span> & <span>slabtop</span>
free -h
slabtop -s c # Sort by the number of cached objects- • free: Check
<span>available</span>for the actual available memory - • slabtop: Investigate if kernel objects (like dentry, inode) are consuming too much
I/O Issues → <span>iostat</span> & <span>iotop</span>
# View disk I/O
iostat -x 2 5

# Real-time view of process I/O
iotop -o- • Key Indicators:
<span>%util</span>> 80% indicates disk saturation;<span>await</span>indicates I/O wait time
🌐 Step 3: Network and Process Tracing
Network Issues → <span>ss</span> & <span>sar</span>
# View connection status (faster than netstat)
ss -tuln

# View historical network data (requires sysstat installation)
sar -n DEV 2 5- • Focus on: Too many TIME_WAIT? You may need to tune TCP parameters
Process Tracing → <span>strace</span> & <span>perf</span>
# Trace process system calls
strace -p <PID> -e trace=network

# Performance analysis (requires perf installation)
perf top -p <PID>- • strace: Diagnose process hangs and network call issues
- • perf: Analyze CPU hotspot functions (suitable for development collaboration)
🧩 Practical Case: PHP-FPM Process Pool Overloaded
Phenomenon: Nginx 502 error, server load spikes.
Troubleshooting Steps:
- 1.
<span>top</span>shows that<span>php-fpm</span>processes are consuming a lot of CPU - 2.
<span>pidstat -u 2 5</span>confirms high user mode CPU - 3.
<span>ss -tuln | grep :9000</span>confirms PHP-FPM port is normal - 4.
<span>strace -p <php-fpm PID></span>reveals many<span>connect</span>calls → possibly a database connection timeout - 5. Check database connection pool configuration, optimize SQL queries, and the problem is resolved!
🎁 Summary: Performance Troubleshooting Flowchart (Keep for Reference)
收到报警
执行 top
CPU高?
内存高?
I/O高?
网络异常?
pidstat/vmstat
free/slabtop
iostat/iotop
ss/sar
定位进程
strace/perf 深入分析
解决问题
Remember: Troubleshooting is not “guessing” but rather a scientific elimination method. Master this set of “combination punches”, and you will be the “performance Sherlock Holmes” in your team!
Save this article, and the next time you encounter a performance issue, you can directly follow the guide! What other troubleshooting techniques have you used? Feel free to share your “secret tips” in the comments! 👇