Click the image to learn more.
In last week’s chapter on ‘Setting Up MM32 Development Environment Based on Embedded Studio‘, we used the Ozone tool for debugging. Today, we will introduce how to use Ozone to debug the MM32 MCU in detail, and what conveniences Ozone can bring to everyone, allowing you to experience the power of this tool.
01
Introduction to Ozone
Ozone is a debugging tool developed by SEGGER, used for cross-platform debugging and performance analysis with J-Link and J-Trace. It features all common views (source code, memory, console/terminal, registers, disassembly, call stack, etc.).
Main Features
– Standalone graphical debugger
– Debug output from any toolchain and IDE
– C / C++ source-level debugging and assembly instruction debugging
– Debug information windows for any purpose: disassembly, memory, global and local, (real-time) watch, CPU and peripheral registers
– Source code editor for immediate bug fixes
– High-speed programming of applications to the target
– Direct use of J-Link built-in features (unlimited Flash breakpoints, Flash download, real-time terminal, instruction tracing)
– Scriptable project files that automatically set everything up
– New project wizard simplifies basic configuration for new projects
Supported compilers by Ozone: Embedded Studio, GCC, Clang, MDK, IAR.
02
Setting Up Ozone Environment
2.1
Software Download
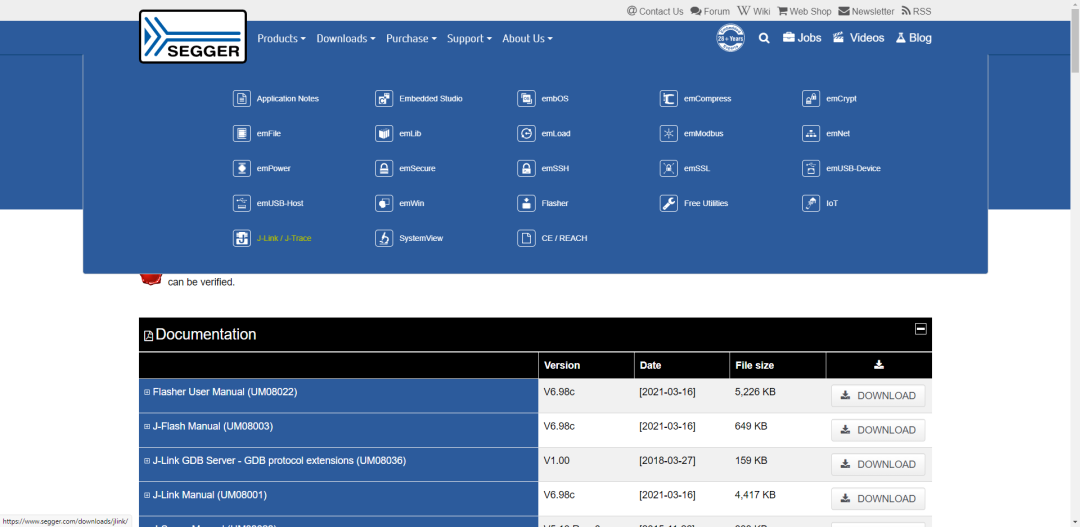
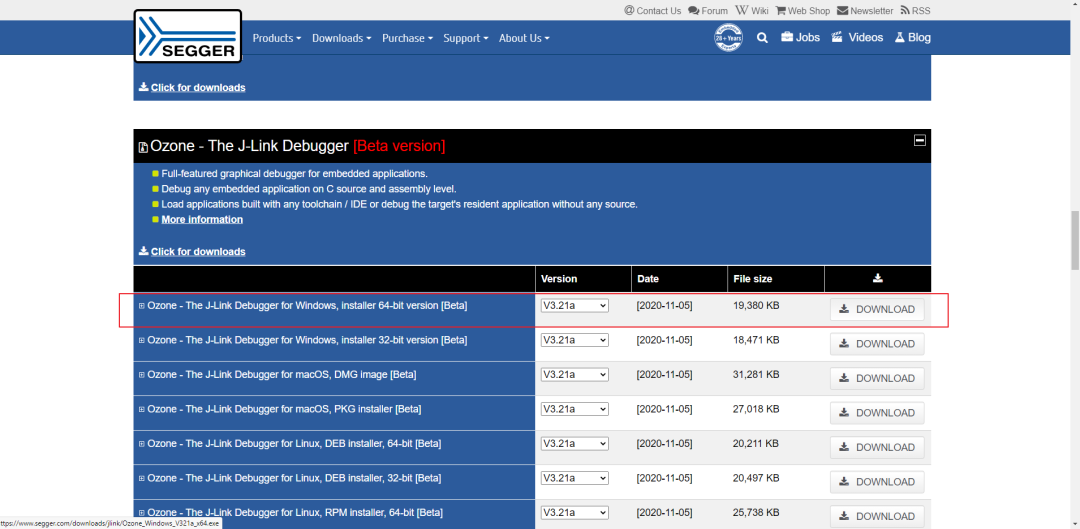
Download the latest Ozone software from SEGGER’s official website (https://www.segger.com/).
2.2
Software Installation
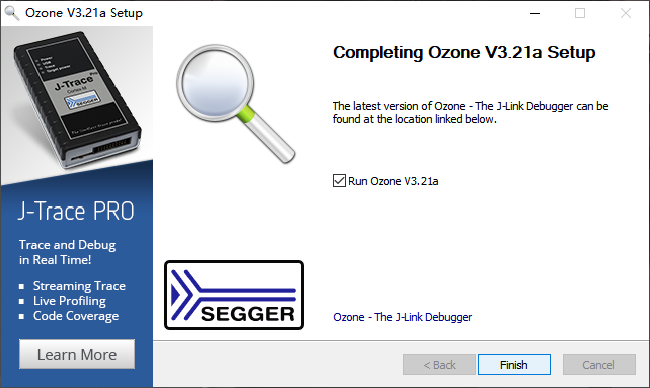
Double-click the Ozone software installation package to install it. The installation will complete as shown in the figure below, and a shortcut will be generated on the desktop.
03
Creating and Debugging a Project
There are two ways to debug with Ozone:
1. Directly call Ozone for debugging within an integrated IDE environment.
2. Create an Ozone project for debugging.
The first method can refer to ‘Setting Up MM32 Development Environment Based on Embedded Studio‘, and will not be elaborated here. Below, we will explain debugging the MCU by creating an Ozone project.
3.1
Creating an Ozone Project
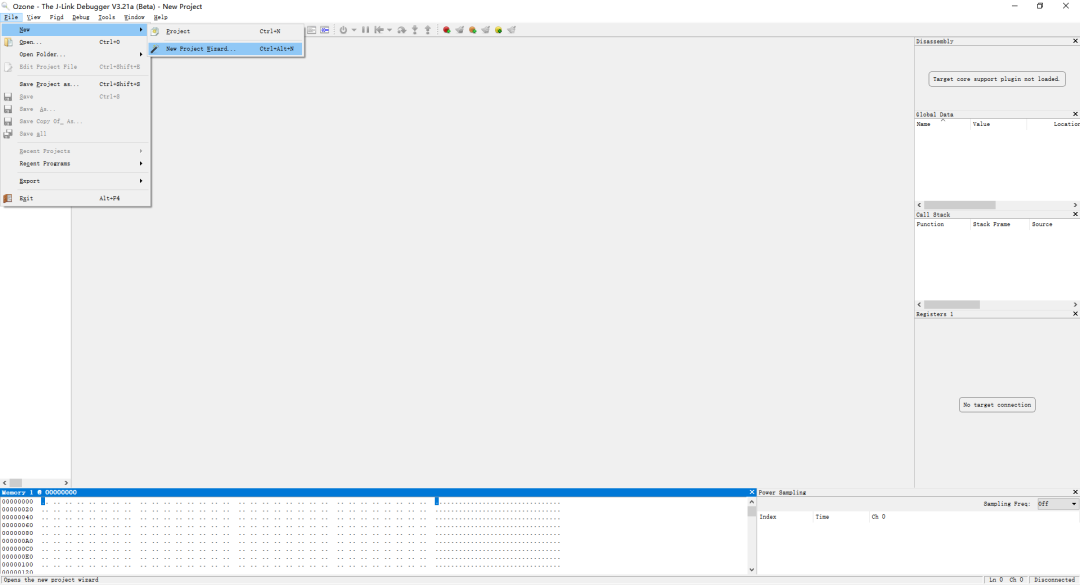
Open the Ozone software, as shown in the figure below:
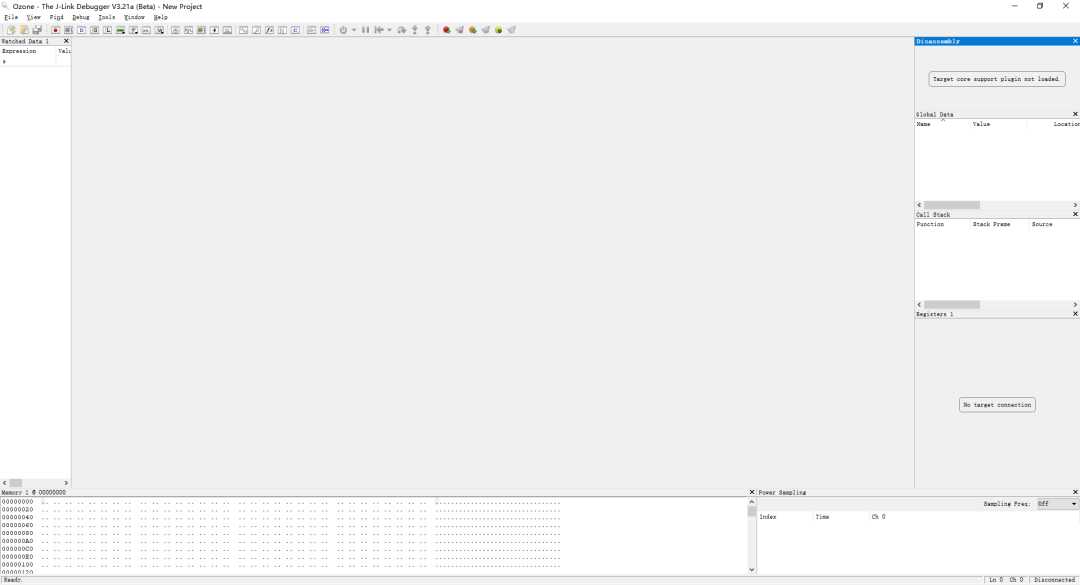
Click on the menu bar File->New->New Project Wizard.. to create a new project.
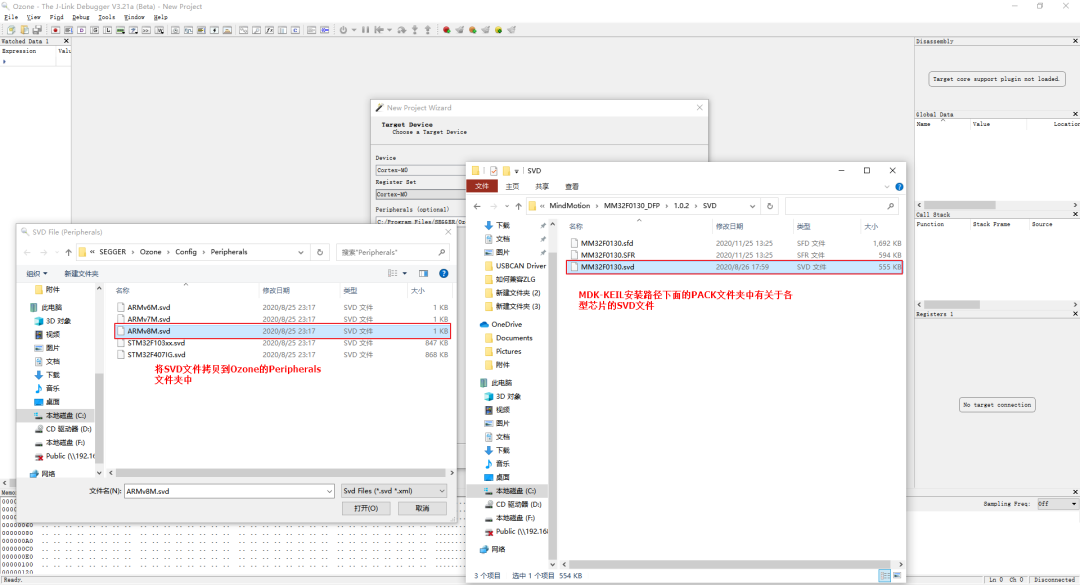
Then, in the popped-up New Project Wizard dialog box, select the Device option according to the specific model of the chip. For example, the chip used this time is MM2F013x, which has a Cortex-M0 core, so select M0 in the Device option. The model in the Register Set dialog will be automatically selected after the Device dialog is completed. In the Peripheral dialog, select the SVD file of the chip (so far, the SVD files included in the Ozone installation package are quite limited. If the SVD file for the chip we are using is not included in Ozone’s Peripheral folder, we can find the corresponding SVD file in the PACK folder under the MDK-Keil installation path and copy it to the Peripheral folder in the Ozone installation path, then select the SVD file of the chip).
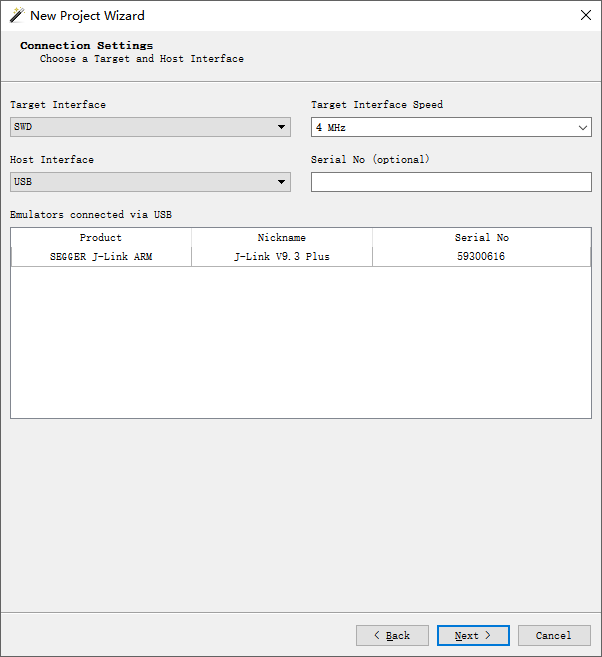
Then click Next to enter the Connection Settings tab to select the debugging interface and communication speed. The MM32F013x supports the SWD interface, so select the SWD interface in the Target Interface button, and select the communication speed of 4MHz in the Target Interface Speed option.
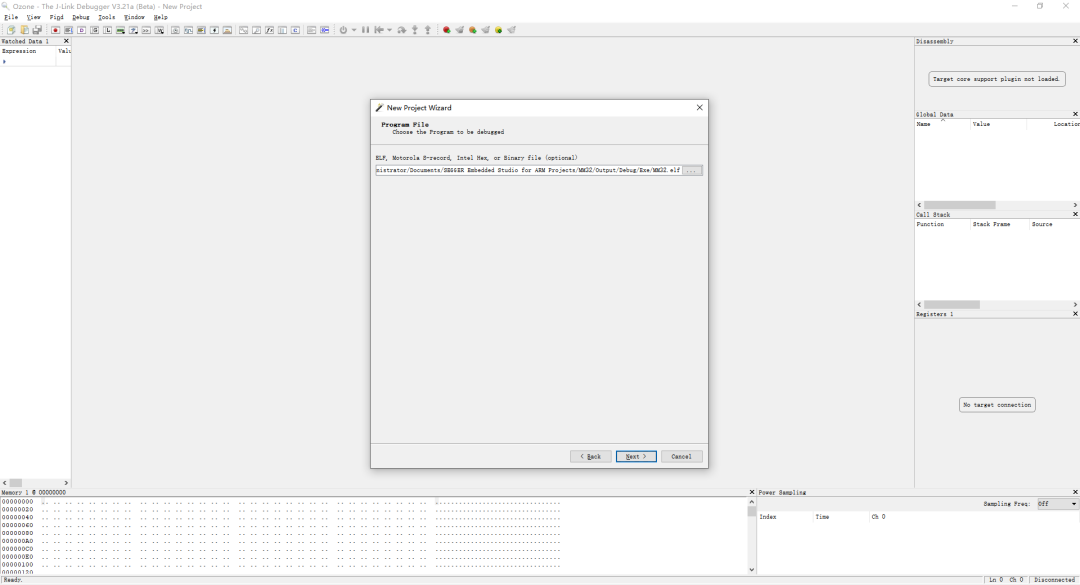
Click Next, then enter the Program File tab to select the .elf file that needs to be debugged.
For the subsequent configurations, select the defaults.
3.2
Download and Debug
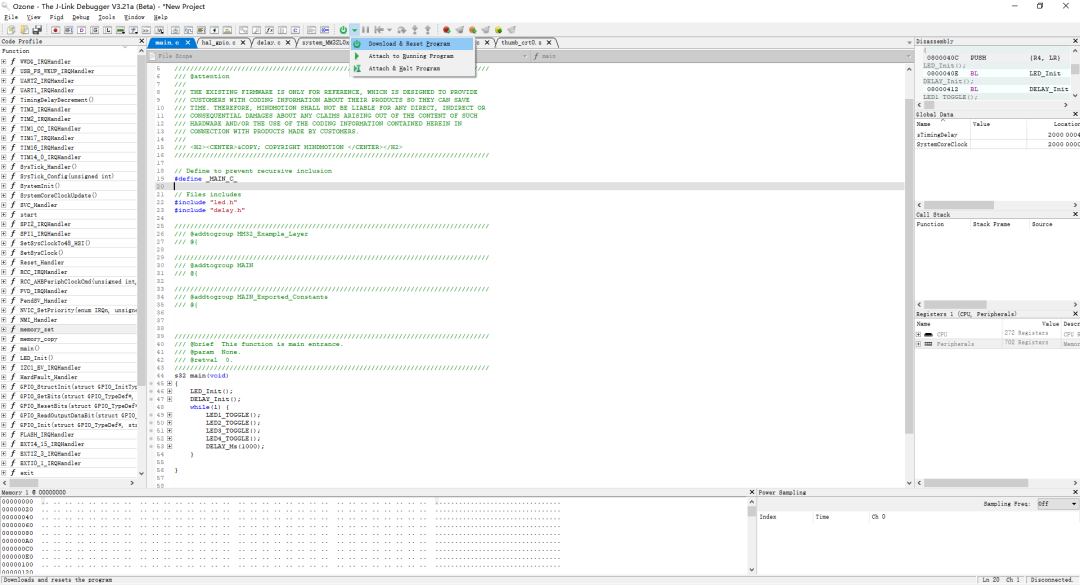
Select the Download & Reset Program option in the Debug tab to download the program to the MCU and enter the debugging interface. Users can select various windows in the View tab to assist with debugging.
3.2.1 Memory Window
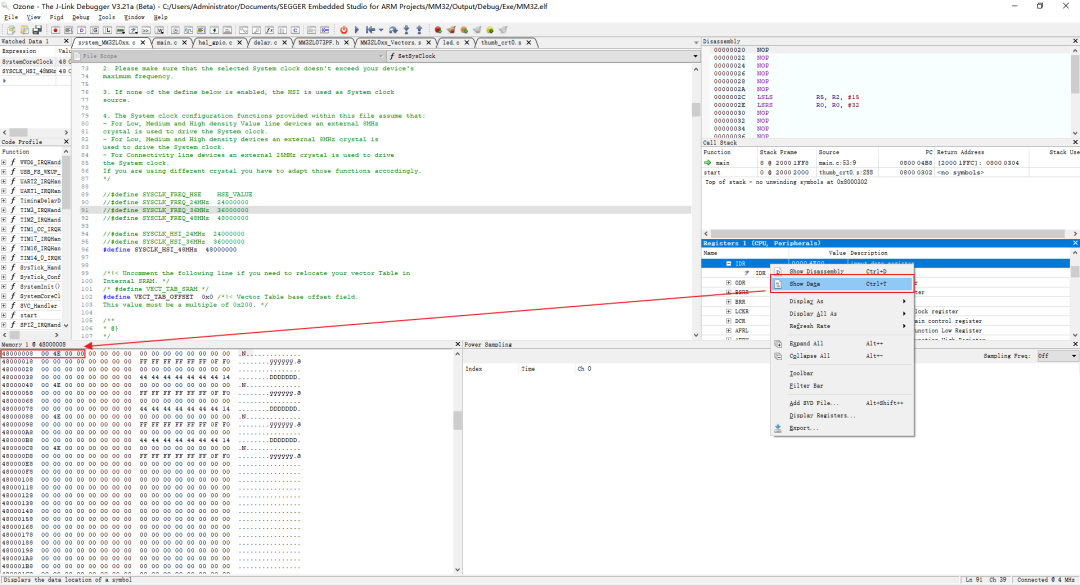
Ozone can directly show the memory status of variables or registers by right-clicking on the register or variable window and selecting Show Data.
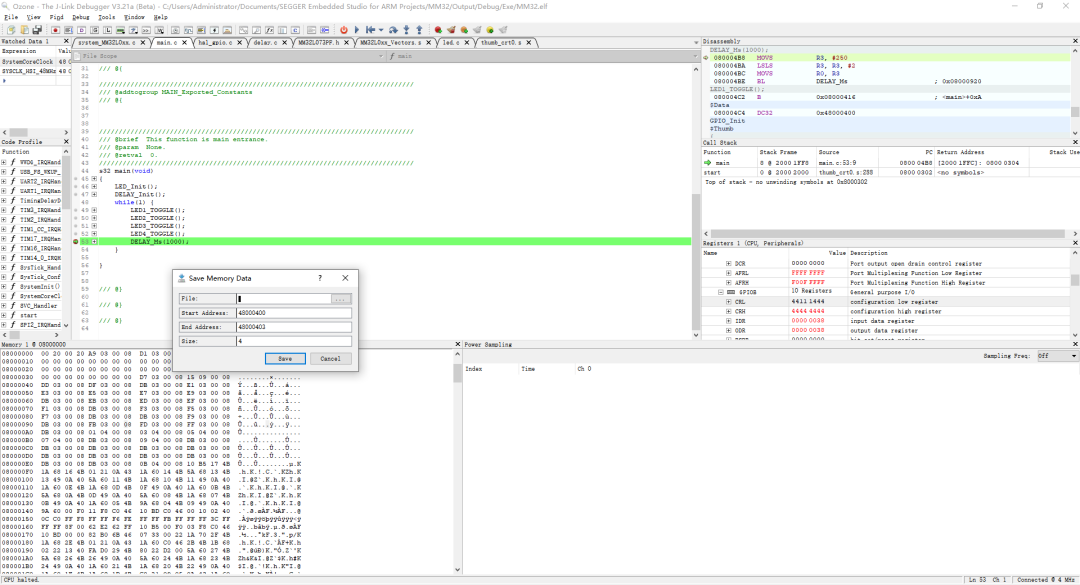
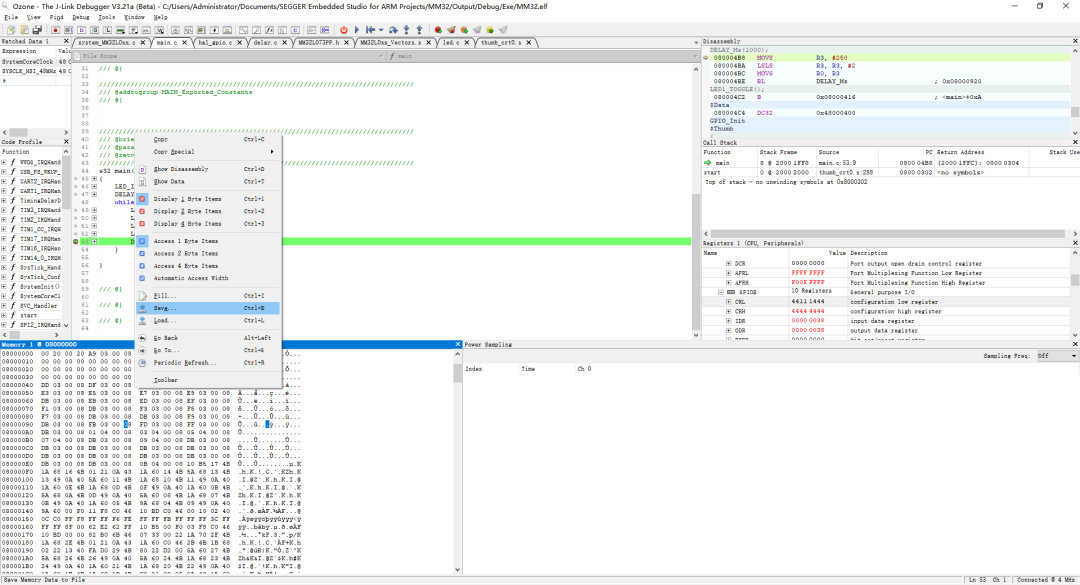
In Memory, users can choose to save data from a specified address range.

3.2.2 Watch Window
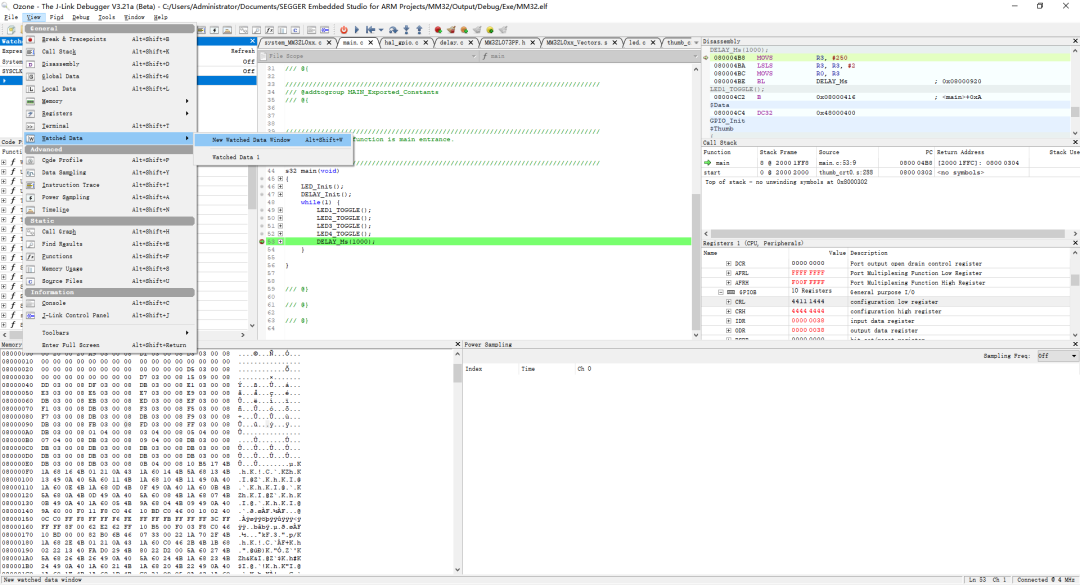
Users can select the New Watch Data Window option in the View tab to display the Watch window showing the values of variables.
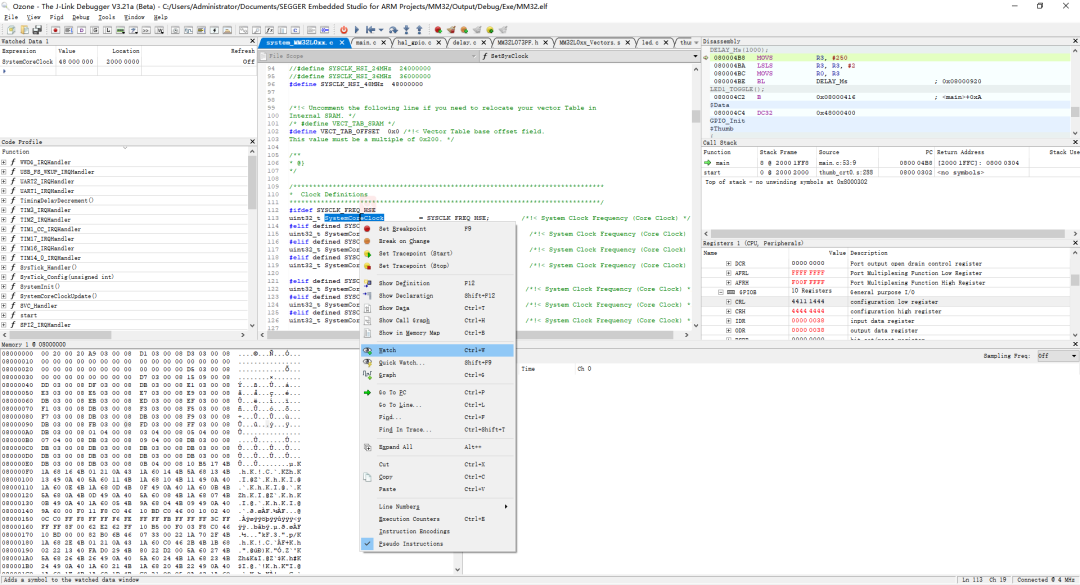
When users need to view the value of a specific variable, they can directly select the variable, right-click to pop up the related options, and then select the Watch option to add the variable to the Watch Data window.
3.2.3 Disassembly Window
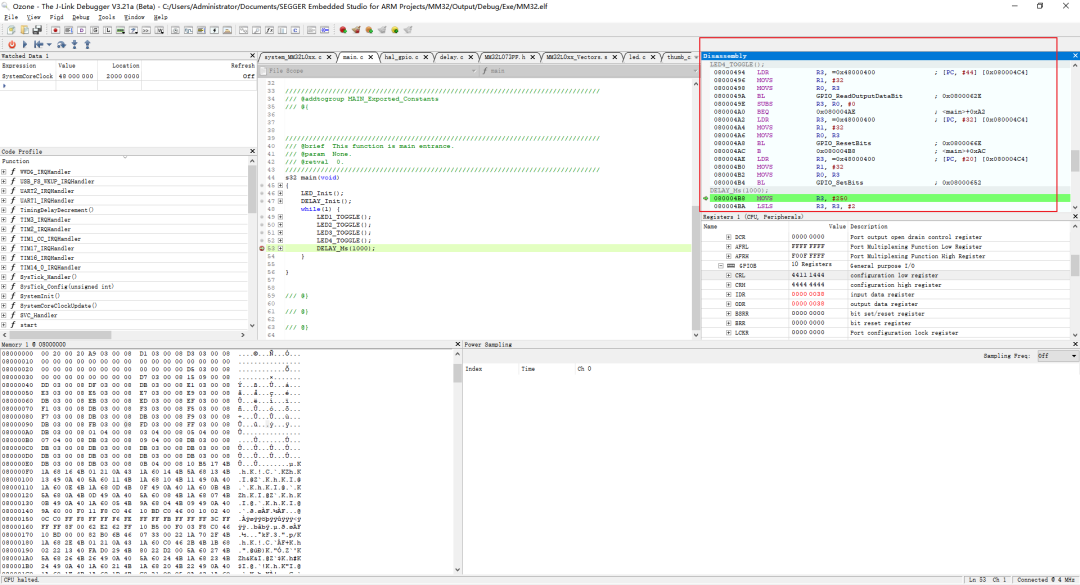
Users can select the Disassembly option in the View tab to display the assembly window. Users familiar with assembly can view assembly instructions in this window, and the instruction tracing shows the executed instructions, synchronized with the source code view.
3.2.4 Registers Window
Users can select the Registers option in the View tab to view the data being stored, where CPU refers to core-related registers and Peripheral refers to peripheral-related registers.
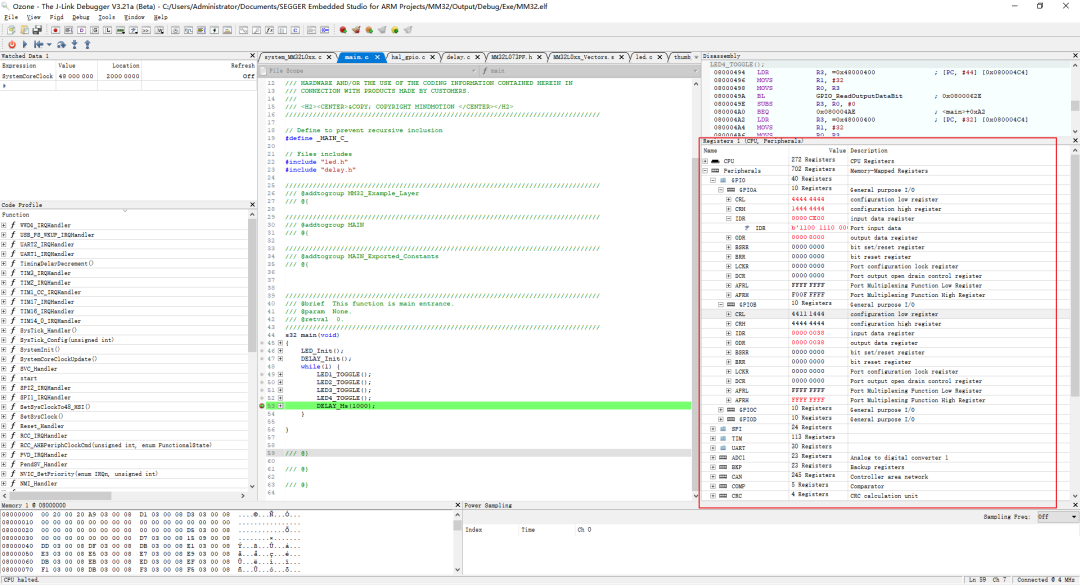
If users did not select the SVD file when creating the project, they will not be able to view the peripheral register data during debugging.
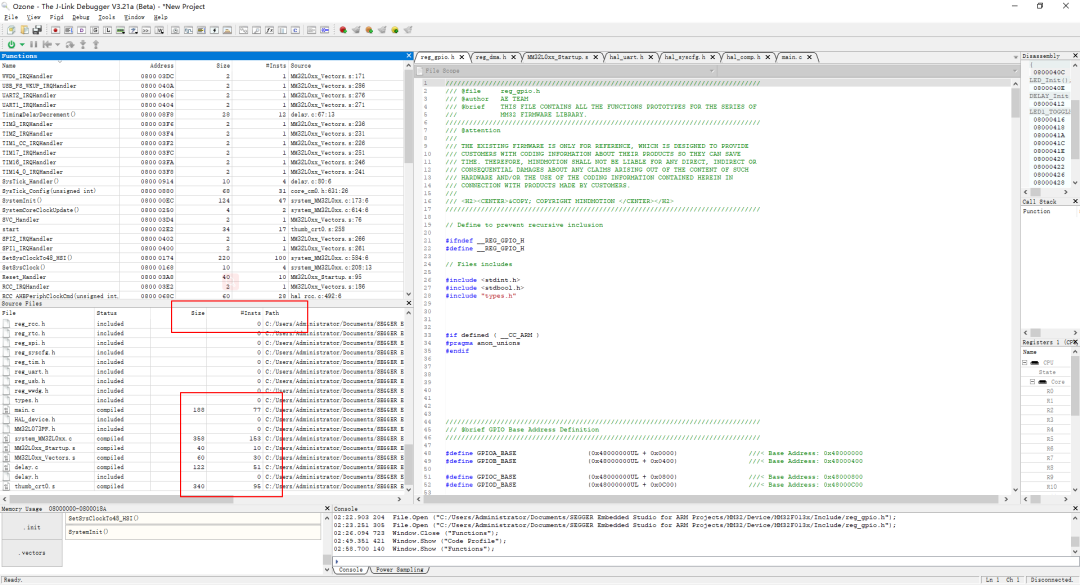
3.2.5 Source File Window
Users can select the Source File option in the View tab to view the related source files, including compiled C files and header files, which show program size, instruction count, location, and status (compiled, included, external calls).
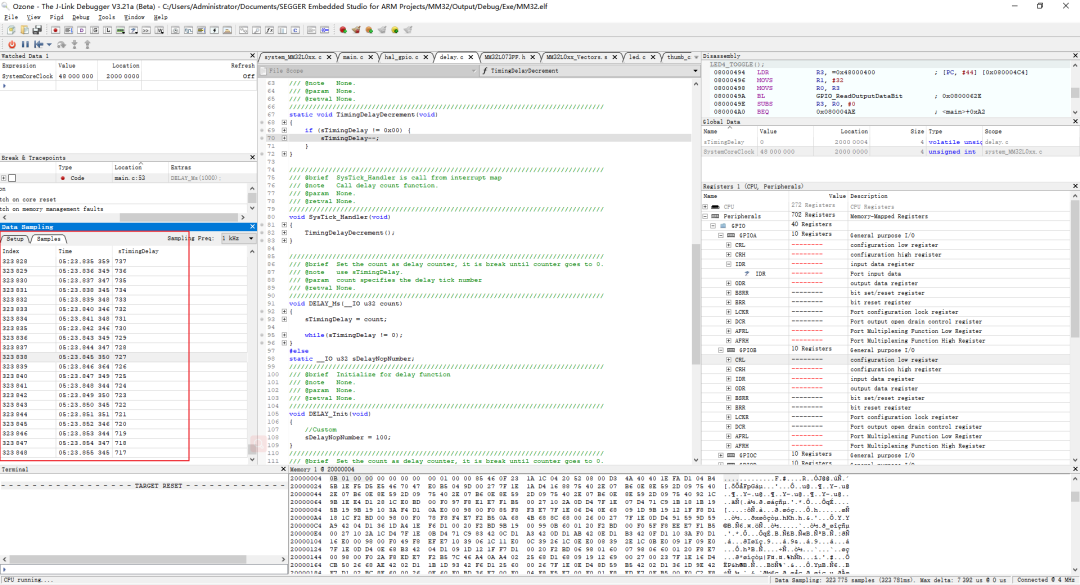
3.2.6 Data Sampling Window
Select the Data Sampling option to periodically view the data changes of a specific variable. As shown in the figure below, Index refers to the printed serial number, Times refers to the printed timestamp, and sTimingDelay refers to the variable name.
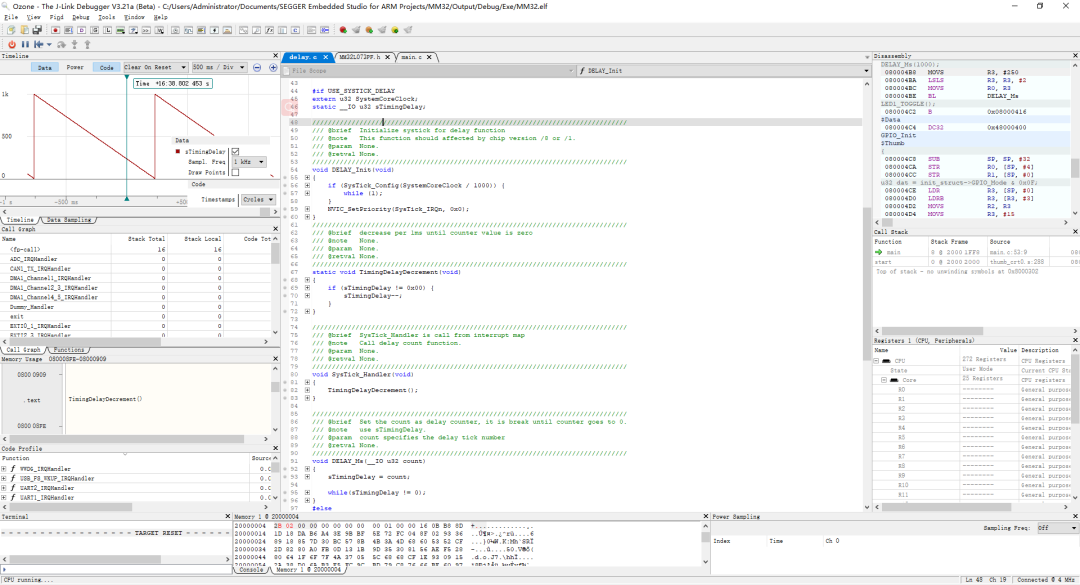
Use the Timeline to view the variable’s change curve:
3.2.7 Breakpoints
Users can add breakpoints on the left side of the source file in the IDE, which will sync to the Break & Tracepoints window. The Break & Tracepoints window displays the number of breakpoints, the files where the breakpoints are located, and basic information such as the line number.
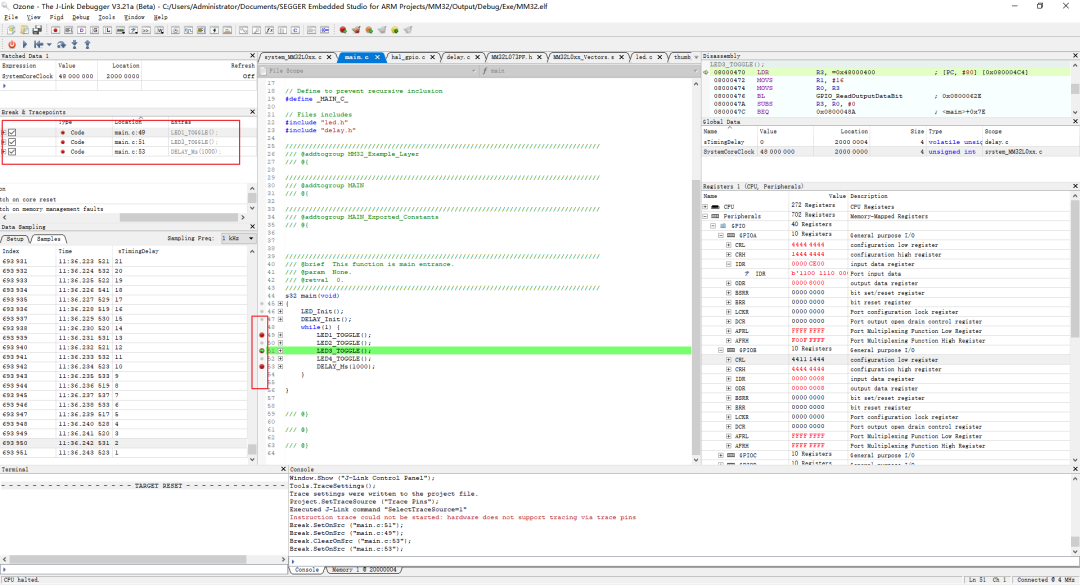
The views can be moved and placed relative to each other to create a ‘tabbed’ view, and views can be moved out of the main window, for example, placed on a separate monitor display.
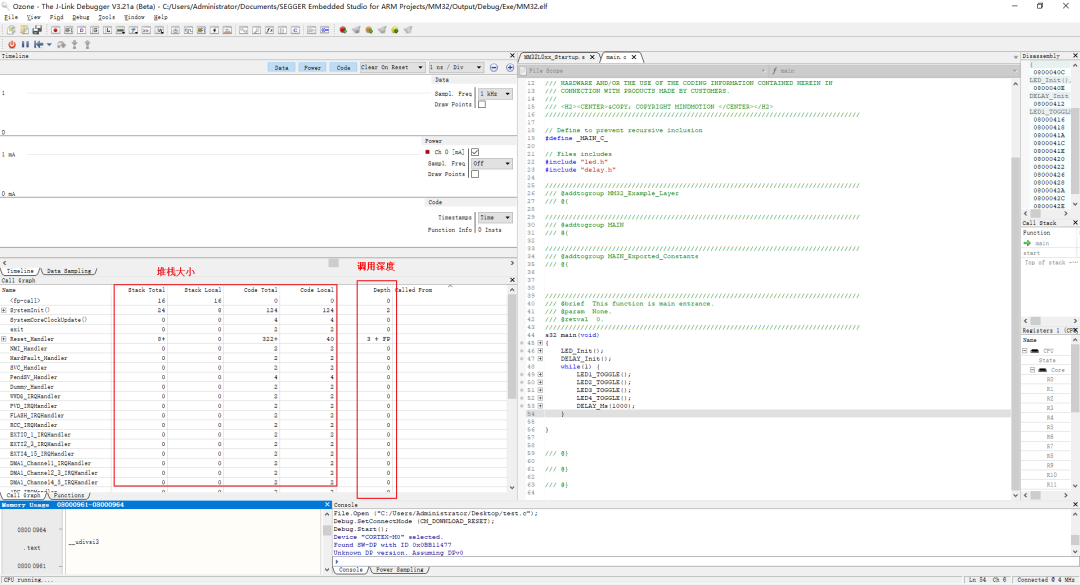
3.2.8 Call Window
This allows you to visually see the function call relationships between the compiled projects, as well as the call depth and related content. This is a static program diagram that describes the mutual reference relationships between functions and sub-functions, as well as the stack usage, total code size, call depth, etc., similar to the description found in the htm (Obj process file) in Keil.
3.2.9 Scripts
Ozone has a great scripting engine; almost everything is scriptable:
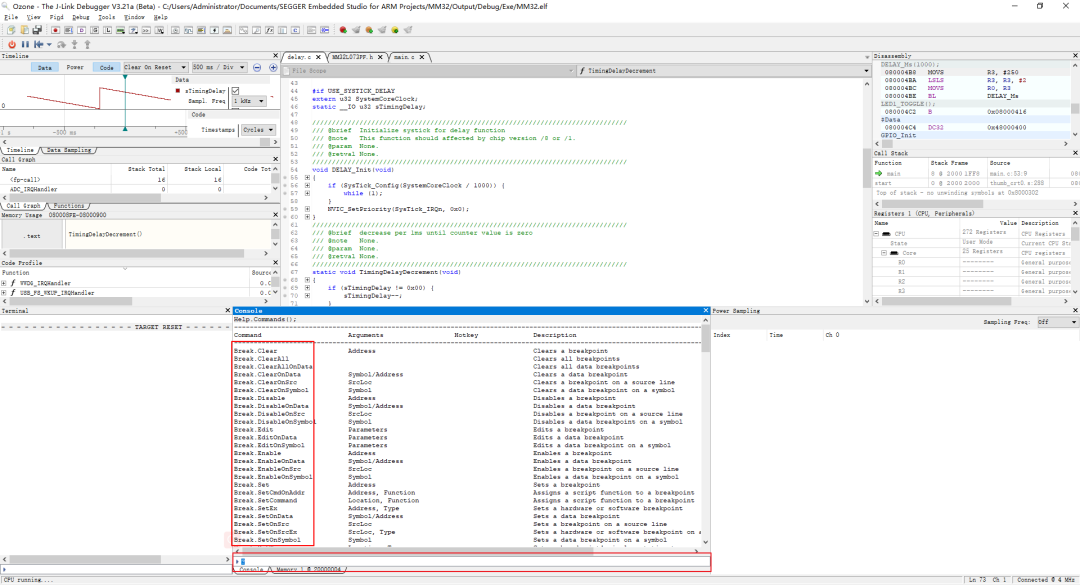
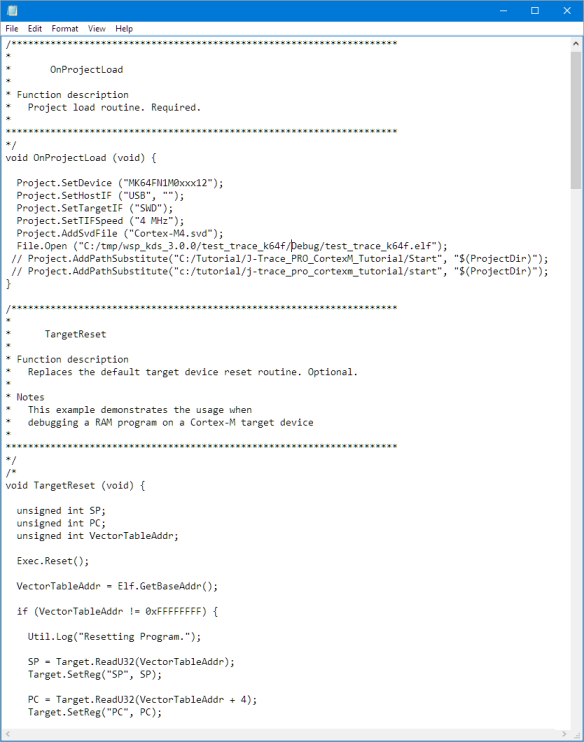
In fact, Ozone project files are written in a script language based on C, allowing for easy modifications to the debugging environment. In the script, we only need to follow the command format of the Ozone Console to write script commands. For example, if we need to open the Global Data window, we enter the command Window.Show (‘Global Data’); in the Console window to bring up the Global Data window. If we want to close this window, we can input Window.Close (‘Global Data’);.
Previous Highlights
MM32F013x – Setting Up MM32 Development Environment Based on Embedded StudioMM32F013x – Developing and Debugging MM32 Based on Eclipse in Windows EnvironmentMM32F013x – Setting Up Eclipse Development Environment in WindowsMM32F013x – Porting EasyLogger ComponentMM32F013x – Porting EasyFlash ComponentMM32F013x – Hardware Watchdog and Option Byte OperationsMM32F013x – RTC Alarm Timed Wake-UpMM32F013x – Perpetual CalendarMM32F013x – TIM1 Hardware Phase Shift FunctionMM32F013x – ADC Any Channel Working ModeMM32F013x – I2C Slave Multi-Address ApplicationMindMotion Micro Classroom Compilation
About MindMotion
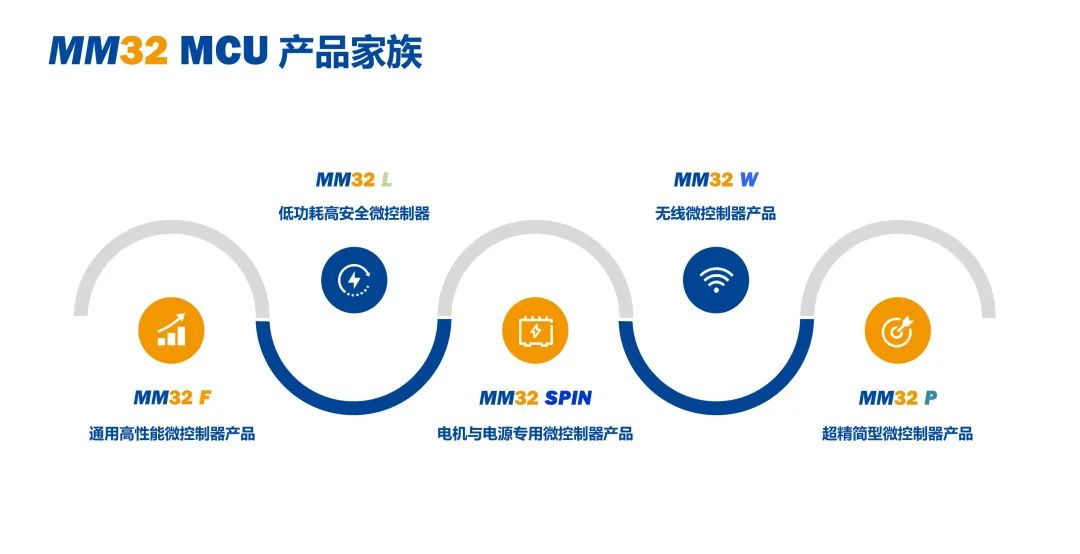
Founded in 2011, MindMotion is a leading local supplier of general-purpose 32-bit MCU products and solutions in China. The MM32 MCU products developed by the company based on the Arm Cortex-M series cores include five major series: F/L/SPIN/W/P, with over 200 models, delivering more than 200 million units cumulatively. MindMotion ranks among the top in local general-purpose 32-bit MCU companies. The MM32 MCU is widely used in smart industry, automotive electronics, communication infrastructure, medical health, smart home appliances, IoT, personal devices, and mobile and computer fields, with tens of millions of excellent products equipped with MindMotion MM32 MCU delivered to customers every year.
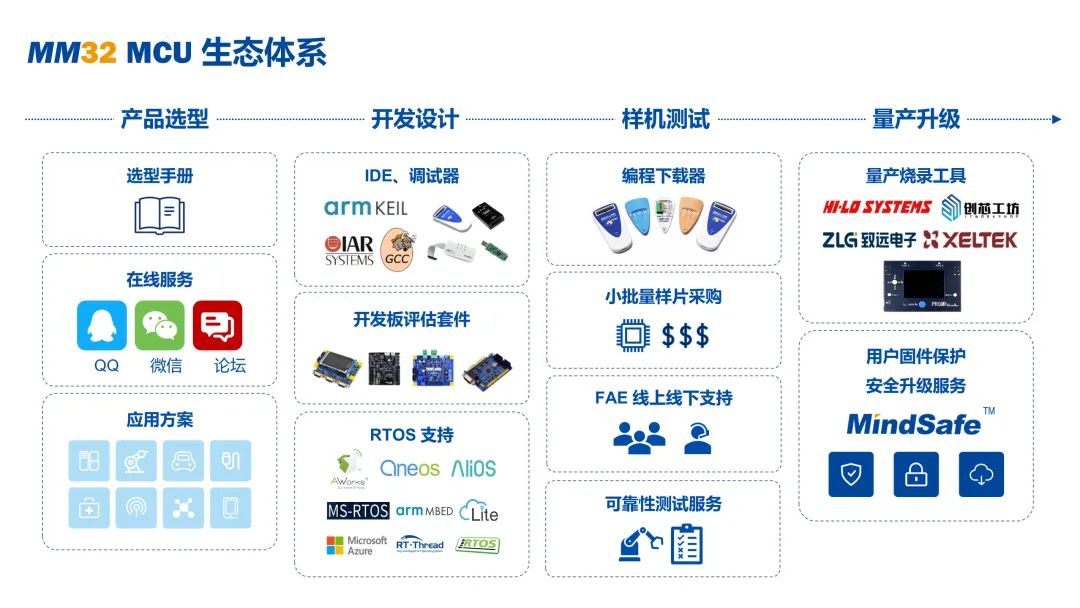
To date, MindMotion is the only local MCU company that has official support from development tools such as Arm-KEIL, IAR, and SEGGER, and is one of the few general-purpose MCU companies that have established an independent and complete ecosystem, dedicated to providing customers with comprehensive support from chip hardware to software algorithms, from reference solutions to system design, truly providing underlying technical drive and support for China’s electronic information industry.
MindMotion MM32 MCU
WeChat ID: MindMotion-MMCU


Long press to recognize the QR code to follow us
MORE
For more information, please visit: www.mm32mcu.com
WeChat public account search: MindMotion MM32 MCU
QQ Technical Discussion Group: 294016370
TaoBao Store: Shanghai MindMotion Microelectronics Co., Ltd.
MindMotion MM32 MCU Technical Forum: bbs.21ic.com