
Using J-Link Debugger
Visual Studio Code is a free source code editor developed by Microsoft. Through plugins, it can implement GDB + J-Link + GDBServer to debug embedded systems in VSCode.
In this article, we will introduce how to add debugging capabilities to Cortex core microcontrollers using J-Link. The example uses SEGGER’s emPower v2.0 evaluation board, which has an NXP MK66FN2M8xxx18 MCU. Please note that the following configuration will refresh the target application, reset, and connect to the debugger. If you want to add this option to a running target board, simply change “request”: “launch” to “request”: “attach” in launch.json.
System Requirements
1. Visual Studio Code (https://code.visualstudio.com/)
2. GNU ARM Embedded Toolchain(https://developer.arm.com/tools-and-software/open-source-software/developer-tools/gnu-toolchain/gnu-rm/downloads)
3. Visual Studio Code Plugins
· C/C++ for Visual Studio Code
· Cortex-Debug
· C/C++ Intellisense (optional)
4. SVD for NXP MK66F Device(https://keilpack.azureedge.net/pack/Keil.Kinetis_K60_DFP.1.5.0.pack)
Windows System Setup
After installing VSCode and the corresponding plugins, first open Visual Studio Code.
Open Project Folder
Under the File menu, select Open Folder and choose the downloaded emPower project folder(https://www.segger.com/downloads/eval/SeggerEval_K66_SEGGER_emPower_CortexM_EmbeddedStudio).
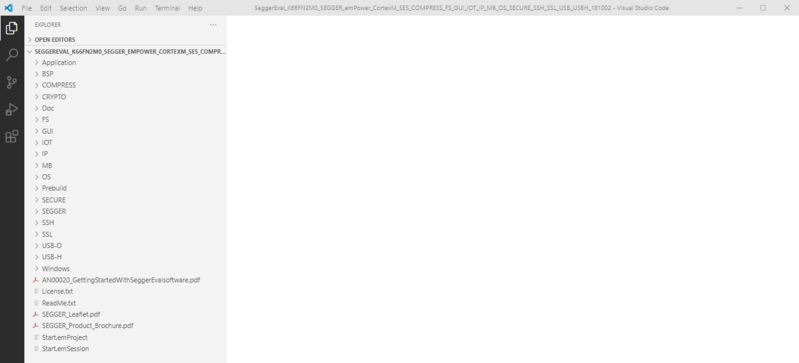
Through the Run and Debug button, select “Cortex Debug”, and create a launch.json file in the .vscode directory of the project folder.
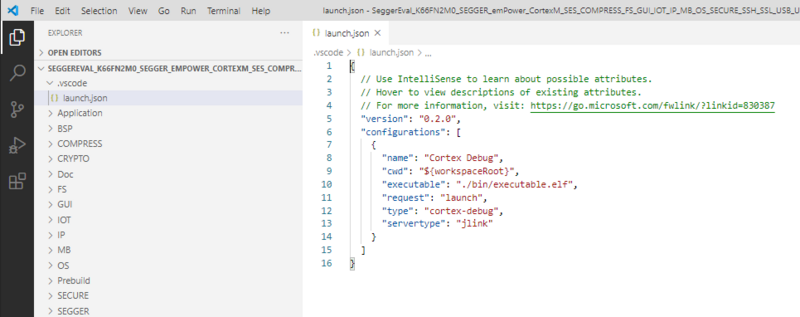
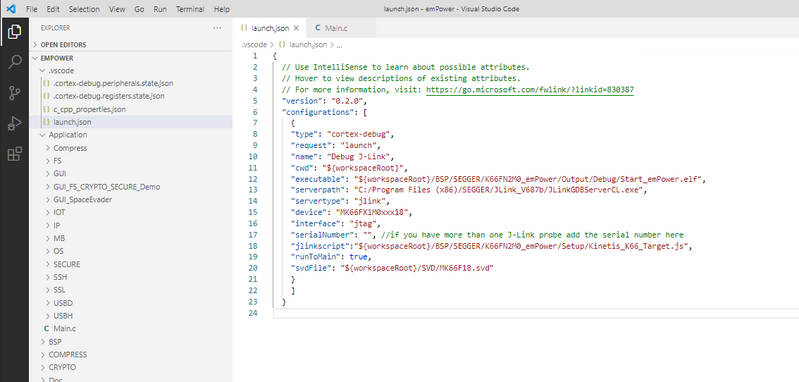
Edit the .json file as follows:
{ // Use IntelliSense to learn about possible attributes. // Hover to view descriptions of existing attributes. // For more information, visit: https://go.microsoft.com/fwlink/?linkid=830387 "version": "0.2.0", "configurations": [ { "type": "cortex-debug", "request": "launch", "name": "Debug J-Link", "cwd": "${workspaceRoot}", "executable": "${workspaceRoot}/BSP/SEGGER/K66FN2M0_emPower/Output/Debug/Start_emPower.elf", "serverpath": "D:/Program Files /SEGGER/JLink_V788e/JLinkGDBServerCL.exe", "servertype": "jlink", "device": "MK66FN2M0xxx18", "interface": "jtag", "serialNumber": "", //If you have more than one J-Link probe, add the serial number here. "jlinkscript":"${workspaceRoot}/BSP/SEGGER/K66FN2M0_emPower/Setup/Kinetis_K66_Target.js", "runToMain": true, "svdFile": "${workspaceRoot}/SVD/MK66F18.svd" }]}“serverpath” should be the specific installation directory of your J-Link GDB server. If your computer is connected to multiple J-Link devices, you need to add the J-Link serial number. If you are only debugging one target, you can comment out this entry.
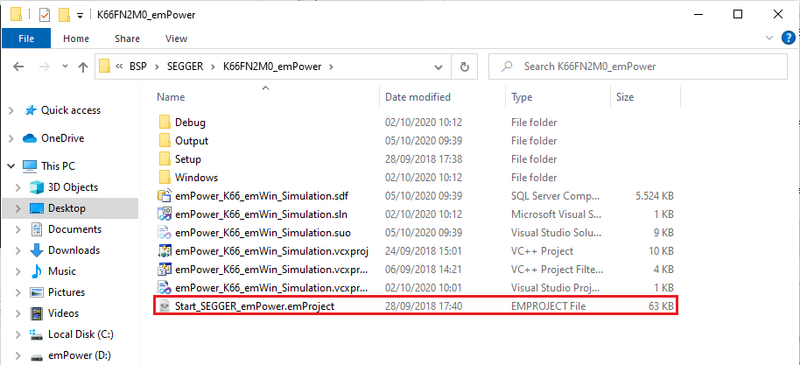
In the project BSP/SEGGER/K66FN2M0_emPower directory, open Start_SEGGER_emPower.emProject project with SES and build to generate Start_emPower.elf.
Note:
After extracting the downloaded SVD for the NXP MK66F device, the MK66F18.svd file is located in Keil. kinetis_k60_dfp .1.5.0/ SVD. Copy this folder to the emPower folder.
The last step is to set up the ARM GDB toolchain. Press F1, type “config”. From the dropdown menu, select C/C++: Edit Configurations (JSON)
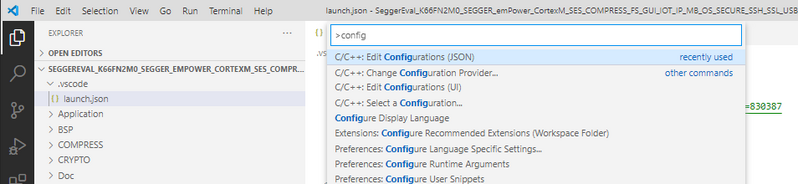
In the JSON configuration file, you need to add the compiler path as follows:
{ "configurations": [ { "name": "Win32", "includePath": [ "${workspaceFolder}/**", "${workspaceFolder}/GUI/Inc" ], "defines": [ "_DEBUG", "UNICODE", "_UNICODE" ], "intelliSenseMode": "gcc-x64", "compilerPath": " D:\Program Files (x86)\GNU Arm Embedded Toolchain\10 2020-q4-major\bin\arm-none-eabi-gcc.exe" } ],"version": 4}Final Result:
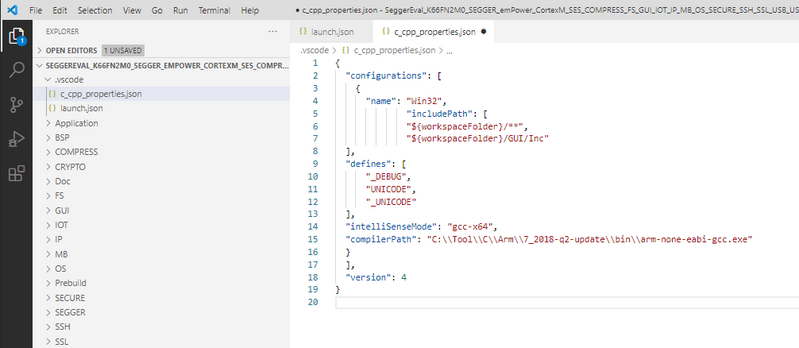
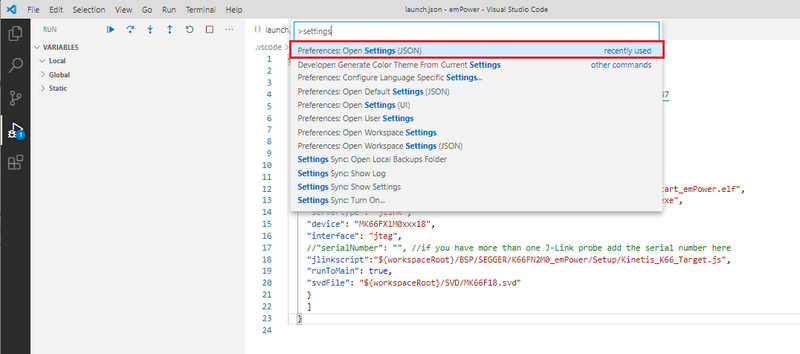
In the settings file, we must specify armToolchainPath. Press F1 and type “settings”, select “Open settings (JSON)”:
“cortex-debug.armToolchainPath”: “C:\Tool\C\Arm\7_2018-q2-update\bin” line
should point to the folder where arm-none-eabi-gdb.exe is located:
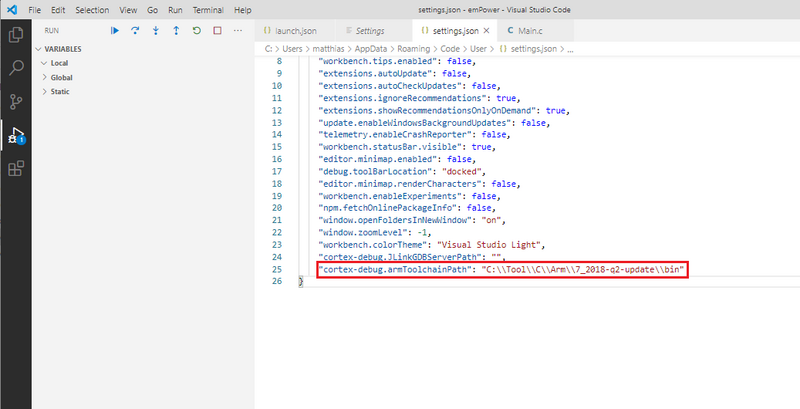
Now the setup is complete. You can start debugging by pressing F5 or from the RUN menu → Start Debugging.
Once in debugging, the output is as follows:
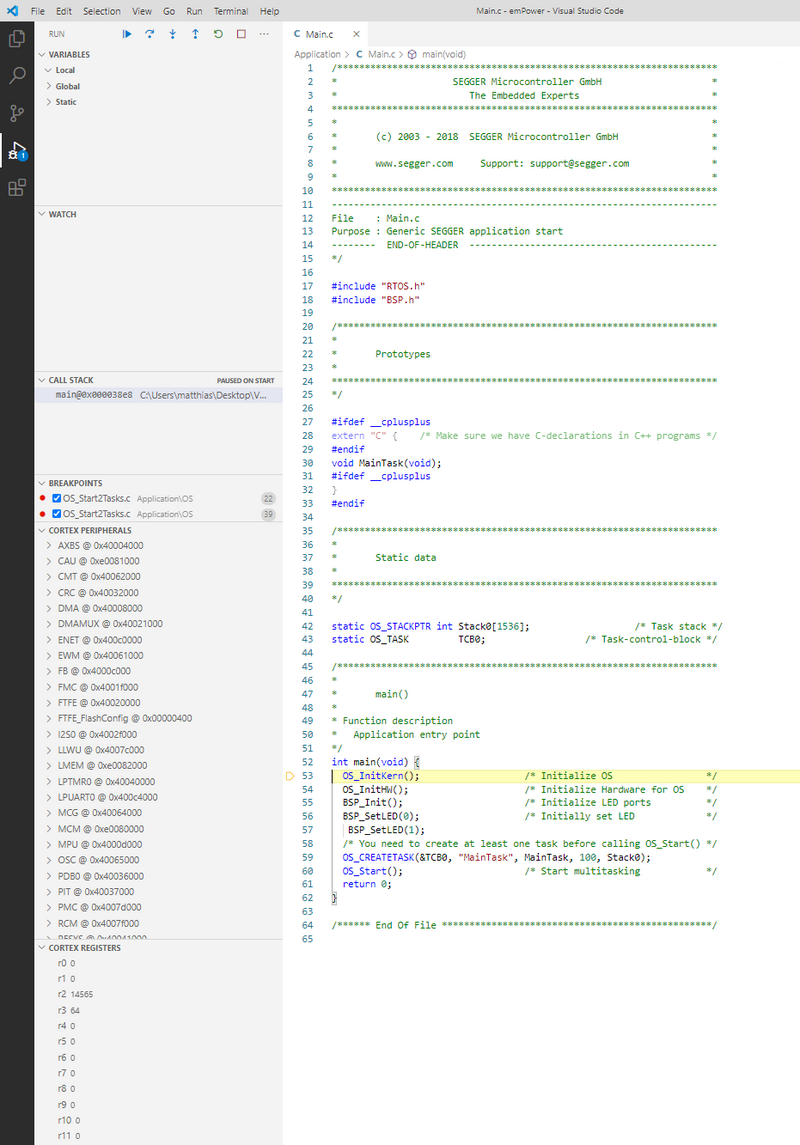
On the left panel, you can view debugging variables (local, global, and static), call stack, breakpoints, MCU peripherals, and kernel registers, as well as information needed for debugging.
You can now debug the target application in Visual Studio Code.
When you add and set up extensions for debugging and compiling, Visual Studio Code is a great choice. In the configuration above, we added the “request”:”launch” option, but if you want to connect to a running target, you can simply set it to “request”:”attach”. Alternatively, you can add an extra.json file to connect to the target. With the above configuration, you can debug using J-Link in Visual Studio Code.
Join the group