4. Understanding tasks.json
When running the program for the first time, the C++ extension will create a <span>tasks.json</span> file, which can be found in the project’s <span>.vscode</span> folder. The purpose of <span>tasks.json</span> is to define tasks such as compilation, building, and cleaning, which can be triggered by <span>Ctrl+Shift+B</span>. The automatically generated <span>tasks.json</span> file should look similar to the following JSON:
{ "tasks": [ { "type": "cppbuild", "label": "C/C++: g++.exe build active file", "command": "d:\msys64\ucrt64\bin\g++.exe", "args": [ "-fdiagnostics-color=always", "-g", "${file}", "-o", "${fileDirname}\${fileBasenameNoExtension}.exe" ], "options": { "cwd": "d:\msys64\ucrt64\bin" }, "problemMatcher": [ "$gcc" ], "group": { "kind": "build", "isDefault": true }, "detail": "Task generated by the debugger." } ], "version": "2.0.0"}<span>type</span> specifies the task type.<span>label</span> specifies the task label, which is what we will see in the task list; we can name it as we wish. However, if we want to achieve the effect of pressing<span>F5</span> to compile and debug, then the <span>preLaunchTask</span> in <span>launch.json</span> must match this.<span>command</span> is the main command, specifying the program to run; in this case, it is g++.<span>args</span> is an array specifying the command-line arguments passed to the program specified in <span>command</span> (in this case, g++). These parameters are listed in the specific order expected by the compiler.<span>-fdiagnostics-color=always</span> enables colored diagnostics, <span>-g</span> requests the generation of debug information, <span>${file}</span> indicates that the current file is to be compiled, <span>-o</span> indicates the creation of an output file, <span>${fileDirname}\${fileBasenameNoExtension}.exe</span> indicates that the created output file is located in the current directory, with the filename being the current file’s name (without the extension), and the extension being .exe.<span>args</span> array also includes some common parameters, such as <span>-Wall</span> to enable all warnings, <span>-Wextra</span> to enable extra warnings, <span>-std=c++17</span> to specify the C++ standard, <span>-I<include directory></span> to specify include directories, <span>-L<library directory></span> to specify library directories (without angle brackets), and <span>-l<library name></span> to link libraries (library names without angle brackets). (The above <span>${file}</span>, <span>${fileDirname}</span>, <span>${fileBasenameNoExtension}</span>, etc. are all <span>tasks.json</span> variables, which will be briefly introduced here and will be seen later. <span>${file}</span> refers to the currently opened file, <span>${fileDirname}</span> refers to the folder path of the currently opened file, <span>${fileBasenameNoExtension}</span> refers to the base name of the currently opened file (without the file extension). Another commonly used variable is <span>${workspaceFolder}</span>, which indicates the path of the folder opened in VS Code. If you want to reference environment variables in <span>tasks.json</span>, you can use the format <span>${env:environment_variable_name}</span>. For more details, you can refer to the official VS Code documentation: https://code.visualstudio.com/docs/reference/variables-reference)<span>options</span> contains the <span>cwd</span> which specifies the working directory.<span>options</span> also has a common parameter called <span>env</span> used to temporarily define or override environment variables, which we use to solve the encoding issues caused by the temporary file paths containing Chinese characters due to Windows usernames.<span>problemMatcher</span> selects the output parser to find errors and warnings in the compiler output. For GCC, using the $gcc problem matcher will yield the best results.<span>detail</span> is the value that describes the task we will see in the task list. We can rename this value to distinguish it from similar tasks.From now on, the play button will read <span>tasks.json</span> to understand how to build and run our program. We can define multiple build tasks in tasks.json, and the task marked as the default task will be called by the play button. If we need to change the default compiler, we can run <span>**Tasks: Configure Default Build Task in the Command Palette**</span>. Alternatively, we can modify the <span>tasks.json</span> file and remove the default value by replacing the following segment:
"group": { "kind": "build", "isDefault": true },with
"group": "build",5. Customizing Debugging with launch.json
We can set breakpoints by clicking on the editor margin or using <span>F9</span> on the current line.
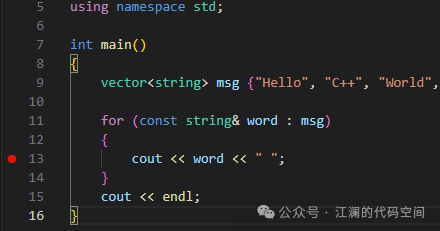
Then, from the dropdown list next to the play button, select Debug C/C++ File.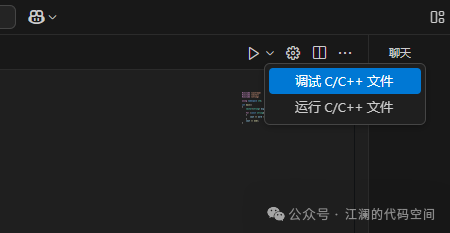
Then it will start debugging automatically. The play button has two modes: "Run C/C++ File" and "Debug C/C++ File". It will default to the last used mode. If you see the debug icon in the play button, just select the play button to debug without using the dropdown list. However, if we want to customize the run and debug, we need to use Ctrl+Shift+D to switch to the "Run and Debug" view, and click to create a launch.json file: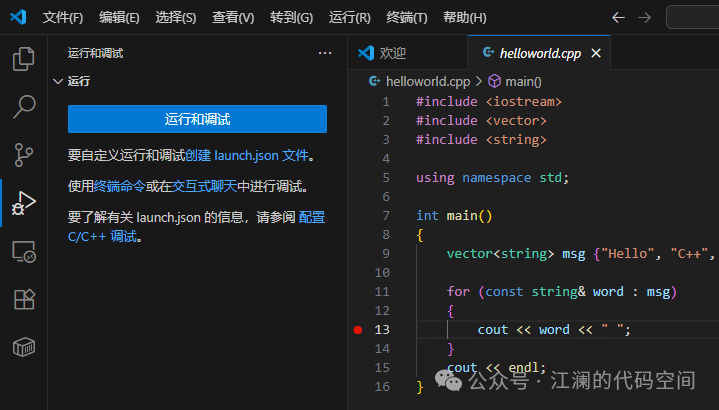
Then select C++ (GDB/LLDB):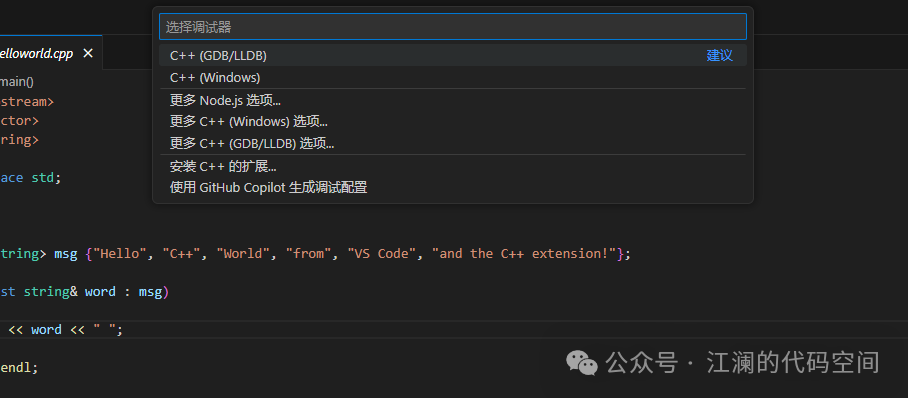
Then select C/C++: (gdb) Launch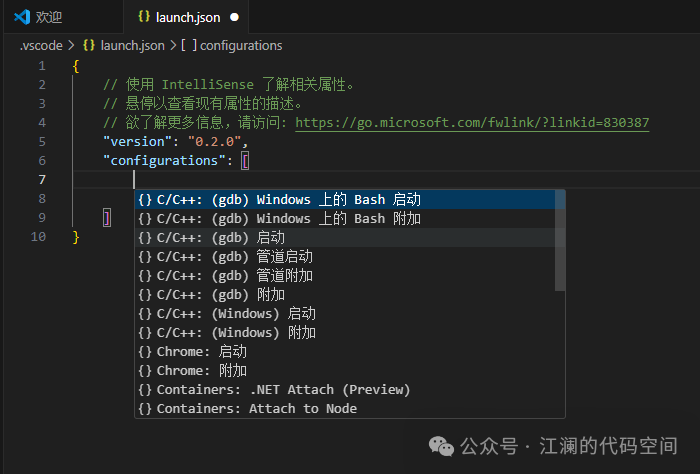
The generated launch.json file will look something like this:{ // Use IntelliSense to learn about related properties. // Hover to view descriptions of existing properties. // For more information, visit: https://go.microsoft.com/fwlink/?linkid=830387 "version": "0.2.0", "configurations": [ { "name": "(gdb) Launch", "type": "cppdbg", "request": "launch", "program": "Enter program name, e.g., ${workspaceFolder}/a.exe", "args": [], "stopAtEntry": false, "cwd": "${fileDirname}", "environment": [], "externalConsole": false, "MIMode": "gdb", "miDebuggerPath": "/path/to/gdb", "setupCommands": [ { "description": "Enable pretty printing for gdb", "text": "-enable-pretty-printing", "ignoreFailures": true }, { "description": "Set disassembly flavor to Intel", "text": "-gdb-set disassembly-flavor intel", "ignoreFailures": true } ] } ]}Next, let's analyze its content: name is the configuration name. type is the debugger type. The request property has two possible values: "launch" and "attach". These two values determine how the debugger connects to the program, with "launch" (start debugging) indicating that a new program instance is started for debugging, and "attach" (attach debugging) indicating that the debugger attaches to an already running program process. Generally, we choose the "launch" value. program specifies the program to debug. We will change it to "${fileDirname}\${fileBasenameNoExtension}.exe", meaning the active folder (${fileDirname}) and the active file name, with the extension .exe (${fileBasenameNoExtension}.exe). args are command-line arguments, usually left empty. The stopAtEntry value indicates whether to pause at entry. By default, the C++ extension does not add any breakpoints to the source code, and the stopAtEntry value is set to false. If we change the stopAtEntry value to true, the debugger will stop at the main method when starting debugging. cwd sets the working directory. environment sets environment variables, usually left empty; if you want to add, the format is as follows:"environment": [ {"name": "DEBUG_MODE", "value": "1"} ],The above content indicates that an environment variable named DEBUG_MODE is set with a value of 1. externalConsole controls whether to use an external console, allowing the program to run in a separate external terminal window during debugging instead of the built-in terminal in VS Code. MIMode indicates whether the debugging engine is gdb or lldb. miDebuggerPath indicates the path to the debugger; here we need to change it to D:\msys64\ucrt64\bin\gdb.exe (since the author's MSYS2 is installed in D:\msys2, readers should modify it according to their situation; if the default settings were used during installation, this should be C:\msys64\ucrt64\bin\gdb.exe). setupCommands are initialization commands. After setupCommands, we need to add a preLaunchTask value, which should be set to match the label in tasks.json. Otherwise, if we want to debug, we must first compile to generate the .exe file. The modified launch.json will be:{ // Use IntelliSense to learn about related properties. // Hover to view descriptions of existing properties. // For more information, visit: https://go.microsoft.com/fwlink/?linkid=830387 "version": "0.2.0", "configurations": [ { "name": "(gdb) Launch", "type": "cppdbg", "request": "launch", "program": "${fileDirname}\${fileBasenameNoExtension}.exe", "args": [], "stopAtEntry": false, "cwd": "${fileDirname}", "environment": [], "externalConsole": false, "MIMode": "gdb", "miDebuggerPath": "D:\msys64\ucrt64\bin\gdb.exe", "setupCommands": [ { "description": "Enable pretty printing for gdb", "text": "-enable-pretty-printing", "ignoreFailures": true }, { "description": "Set disassembly flavor to Intel", "text": "-gdb-set disassembly-flavor intel", "ignoreFailures": true } ], "preLaunchTask": "C/C++: g++.exe build active file" } ]}Now you can <span>Ctrl+S</span> to save the <span>launch.json</span> file.
From now on, when starting the program for debugging, both the play button and
<span>F5</span>will read from the<span>launch.json</span>file.
Conclusion of Part 2
In this issue, we have analyzed the most important <span>tasks.json</span> and <span>launch.json</span> files, and we will continue to analyze the other two files in the future. Readers can follow my WeChat public account, where I will also share my essays and life insights from time to time. Thank you~