
Learn about the time domain and frequency domain of signals, Fast Fourier Transform (FFT), windowing, and how these operations deepen your understanding of signals.
Understanding Time Domain, Frequency Domain, FFT
The Fourier Transform helps to understand common signals and how to identify errors within them. Although the Fourier Transform is a complex mathematical function, understanding the concept through measuring a signal is not complicated. Essentially, the Fourier Transform decomposes a signal into sine waves of different amplitudes and frequencies. Let’s analyze the significance of this statement.
All Signals Are a Sum of Several Sine Waves
We usually regard a practical signal as a voltage value that changes over time. This is viewing the signal from the time domain perspective.
The Fourier theorem states that any waveform in the time domain can be represented as a weighted sum of several sine and cosine waves. For example, if there are two sine waves, one with a frequency three times that of the other, adding the two sine waves results in a different signal.
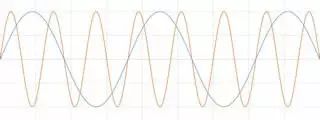
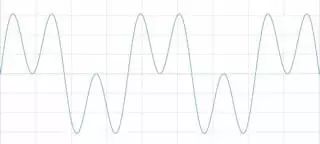
Figure 1 Adding two signals results in a new signal
Assuming the amplitude of the second waveform is also 1/3 of the first waveform, only the peaks are affected at this point.
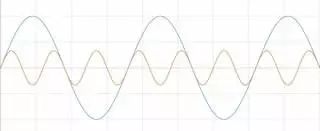
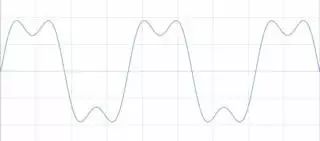 Figure 2 Adjusting amplitude while adding signals affects the peaks
Assuming you add a signal with an amplitude and frequency that is only 1/5 of the original signal. Continuing to add in this way until you touch the noise boundary, you may recognize the resultant waveform.
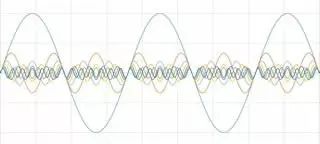
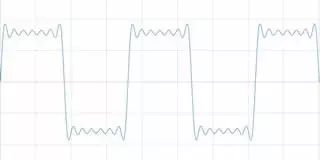
Figure 3 A square wave is a sum of several sine waves
You have created a square wave. In this way, all signals in the time domain can be represented as a set of sine waves.
Even if signals can be constructed in this way, what does it mean? Because signals can be constructed from sine waves, similarly, signals can also be decomposed into sine waves.
Once a signal is decomposed, you can observe and analyze the signals of different frequencies within the original signal. Please refer to the following examples of signal decomposition:
-
Decomposing broadcast signals allows you to select specific frequencies to listen to (radio stations).
-
Decomposing audio signals into different frequency signals (e.g., bass, treble) can enhance specific frequency bands and remove noise.
-
Decomposing seismic waveforms based on speed and intensity can optimize building designs to avoid strong vibrations.
-
When decomposing computer data, you can ignore the data with the lowest frequency importance, thus utilizing memory more compactly. This is the principle of file compression.
Using FFT to Decompose Signals
The Fourier Transform converts a time domain signal into a frequency domain signal. The frequency domain signal shows the voltage corresponding to different frequencies. The frequency domain is another perspective for observing signals.
Digital oscilloscopes sample waveforms and then convert the samples into discrete values. Because a transformation has occurred, the Fourier Transform cannot be applied to this data. Discrete Fourier Transform (DFT) can be used, resulting in a discrete form of the frequency domain signal. FFT is an optimized implementation of DFT, requiring less computation, but essentially it is a decomposition of the signal.
Please look at the signal in Figure 1. There are two signals with different frequencies. In this case, the frequency domain will show two vertical lines representing different frequencies.
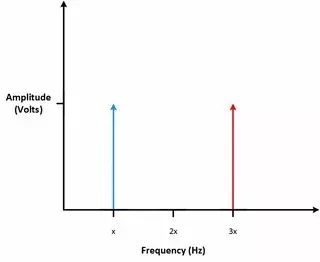 Figure 4 When two sine waves of the same amplitude are added, they appear as two frequency vertical lines in the frequency domain
The amplitude of the original signal is represented on the vertical axis. There is a signal with a different amplitude in Figure 2. The highest vertical line in the frequency domain corresponds to the sine signal with the highest voltage. Observing the signal in the frequency domain, you can intuitively see where the highest voltage occurs at which frequency.
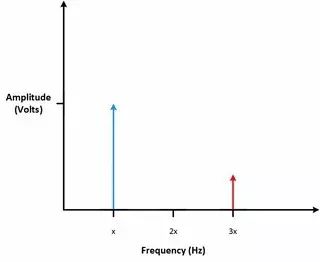 Figure 5 The highest vertical line corresponds to the frequency with the highest amplitude
You can also observe the shape of the signal in the frequency domain. For example, the shape of a square wave signal in the frequency domain. A square wave is created using sine waves of different frequencies. It can be expected that in the frequency domain, these signals will be represented as a vertical line, each line representing the sine waves that make up the square wave. If the vertical lines in the frequency domain appear as a gradient, it indicates that the original signal is a square wave signal.
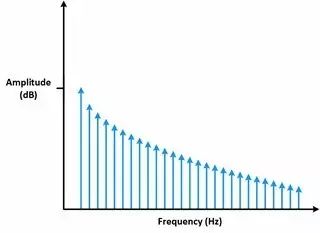 Figure 6 The vertical lines representing sine waves in the frequency domain appear as a gradient
What does it look like in real life? Many Mixed Signal Oscilloscopes (MSOs) have FFT capabilities. In the figure below, you can observe how the square wave FFT is displayed in the mixed signal graph. Zooming in allows you to observe the peaks in the frequency domain.
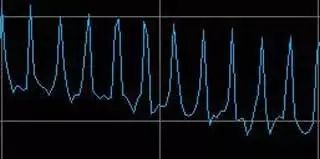
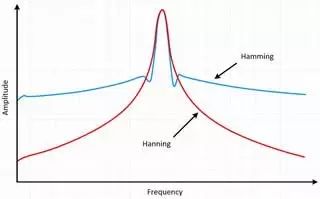
Figure 7 The top image shows the original sine wave and its FFT, while the bottom image is an enlarged view of the FFT, allowing observation of the frequency peaks
Observing signals in the frequency domain helps to verify and discover issues within the signals. For example, assume there is a circuit outputting a sine wave. You can view the time domain output signal on an oscilloscope, as shown in Figure 8. It appears to have no issues!
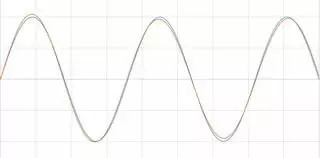 Figure 8 If two very similar waveforms are added, you will still get a perfect sine wave
When viewing the signal in the frequency domain, if the output sine wave frequency is stable, it should only appear as a single vertical line in frequency. However, you can see that there is still a vertical line at a higher frequency, indicating that the sine wave is not as perfect as observed. You may try to optimize the circuit to remove noise at specific frequencies. Displaying signals in the frequency domain helps to detect interference, noise, and jitter within the signals.
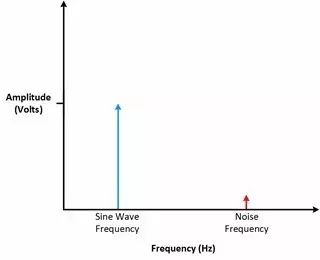 Figure 9 Observing the seemingly perfect sine wave in Figure 8 reveals a jitter in the waveform
Signal Windowing
FFT provides a new perspective for observing signals, but it also has various limitations that can be enhanced through windowing to increase signal clarity.
What is Windowing?
When using FFT to analyze the frequency components of a signal, a finite data set is analyzed. FFT assumes that the waveform is a collection of finite data points, and a continuous waveform is composed of several small waveforms. For FFT, both time and frequency domains are topologically circular. In time, the endpoints of the waveform are connected. If the measured signal is periodic and the collection time captures an integer number of periods, then FFT’s assumption is valid.
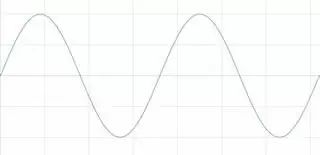
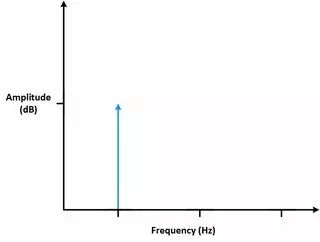 Figure 10 Measuring an integer number of periods (top image) yields an ideal FFT (bottom image)
In many cases, it is not possible to measure an integer number of periods. Therefore, the measured signal will be cut off from the middle of the period, displaying different characteristics compared to the time-continuous original signal. Finite data sampling can cause drastic changes in the measured signal. This drastic change is called discontinuity.
When the collected period is a non-integer, the endpoints are discontinuous. These discontinuous segments appear as high-frequency components in FFT. These high-frequency components do not exist in the original signal. These frequencies may far exceed the Nyquist frequency, causing aliasing in the frequency range from 0 to half the sampling rate. The frequencies obtained from FFT are not the actual frequencies of the original signal, but altered frequencies, similar to energy from a certain frequency leaking into other frequencies. This phenomenon is called spectral leakage. Frequency leakage causes good spectral lines to spread over a wider signal range.
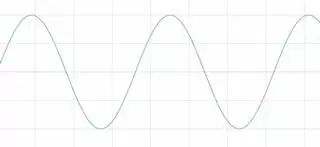
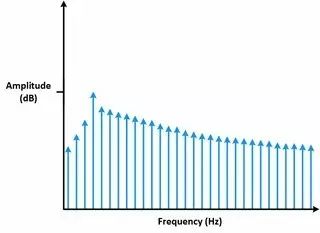 Figure 11 Measuring a non-integer number of periods (top image) adds spectral leakage to FFT (bottom image)
Windowing can be used to minimize the errors produced by performing FFT on non-integer periods as much as possible. The boundaries of the finite sequence collected by the digital instrument will exhibit discontinuities. Windowing can reduce the amplitude of these discontinuous parts. Windowing involves multiplying the time record by a finite-length window, where the amplitude of the window gradually decreases to zero at the edges. The result of windowing is to present a continuous waveform as much as possible, reducing drastic changes. This method is also known as applying a window.
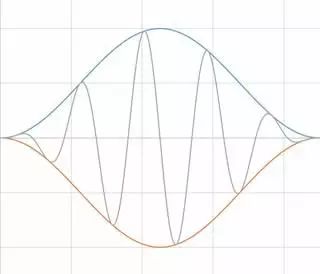
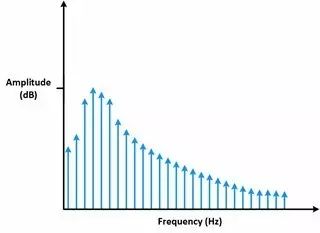 Figure 12 Windowing can minimize spectral leakage
Window Functions
According to the different signals, you can choose different types of window functions. To understand how windows affect the frequency of signals, you must first understand the frequency characteristics of the windows.
The waveform of the window shows that the window itself has a continuous frequency spectrum, with a main lobe and several side lobes. The main lobe is central to the frequency components of the time-domain signal, while the side lobes approach zero. The height of the side lobes indicates the effect of the window function on the frequencies surrounding the main lobe. The side lobe response to strong sine signals may exceed that of the main lobe response to nearby weak sine signals.
Generally speaking, low side lobes reduce FFT leakage but increase the bandwidth of the main lobe. The side lobe fall-off rate is the gradual attenuation rate of the side lobe peak. Increasing the side lobe fall-off rate can reduce frequency spectrum leakage.
Choosing a window function is not easy. Each window function has its characteristics and applicable range. To select a window function, you must first estimate the frequency components of the signal.
-
If your signal has strong interference frequency components that are far away from the components of interest, choose a smooth window with a high side lobe fall-off rate.
-
If your signal has strong interference frequency components that are close to the components of interest, choose a window with low maximum side lobes.
-
If the frequency of interest contains two or more signals that are very close together, frequency spectrum resolution becomes very important. In this case, it is best to use a smooth window with a narrow main lobe.
-
If the amplitude accuracy of one frequency component is more important than the precise location of the signal components within a certain frequency range, choose a window with a wide main lobe.
-
If the signal spectrum is relatively flat or the frequency components are wide, use a uniform window or no window at all.
-
In summary, the Hanning window is suitable for 95% of cases. It not only has good frequency resolution but also reduces spectral leakage.If you are unsure of the signal characteristics but want to use a smooth window, then choose the Hanning window.
Even without using any window, the signal will convolve with a highly consistent rectangular window. Essentially, this is equivalent to taking a screenshot of the time-domain input signal and is also effective for discrete signals. This convolution has a frequency spectrum characteristic of a sine wave function. For this reason, not using a window is called a uniform window or rectangular window.
The Hamming and Hanning windows both have a sine wave shape. Both windows produce a result with a wide peak and low side lobes. The Hanning window is zero at both ends of the window, eliminating all discontinuities. The Hamming window does not equal zero at both ends, resulting in continuity in the signal. The Hamming window excels at reducing the nearest side lobes but is not as effective at reducing other side lobes. The Hamming and Hanning windows are suitable for noise measurements where high frequency accuracy is required but side lobe requirements are low.
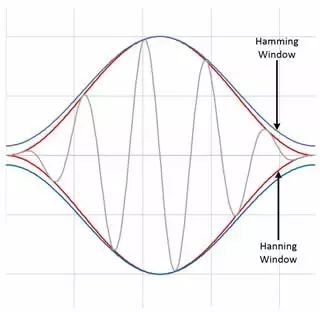
Figure 13 Both Hamming and Hanning produce results with wide peaks and low side lobes
The Blackman-Harris window is similar to the Hamming and Hanning windows. The resulting frequency spectrum has a wider peak and compressed side lobes. This window mainly has two types. The 4th-order Blackman-Harris is a general-purpose window that has side lobe suppression at high 90s dB and has a wide main lobe.The 7th-order Blackman-Harris window function has a wide dynamic range and a wide main lobe.
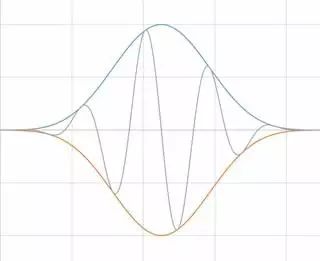
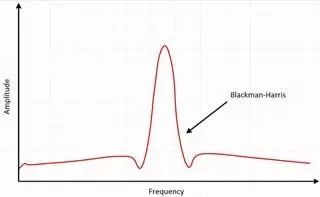 Figure 14 The result of the Blackman-Harris window is a wider peak with compressed side lobes
The Kaiser-Bessel window achieves a good balance between amplitude accuracy, side lobe distance, and side lobe height. The Kaiser-Bessel window is similar to the Blackman-Harris window, with higher nearby side lobes and lower distant side lobes for the same main lobe width. Choosing this window often leads to signal leakage close to noise.
The Flat Top window is also a sine wave that crosses the zero line. The result of the Flat Top window is to produce a significantly wide peak in the frequency domain, closer to the actual amplitude of the signal compared to other windows.
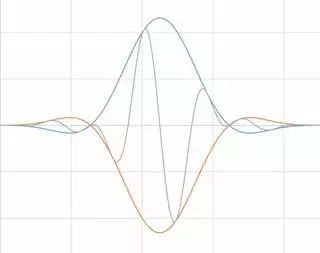
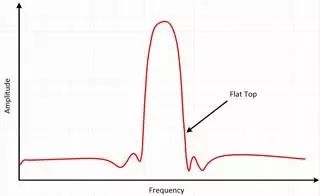 Figure 15 The Flat Top window provides more accurate amplitude information
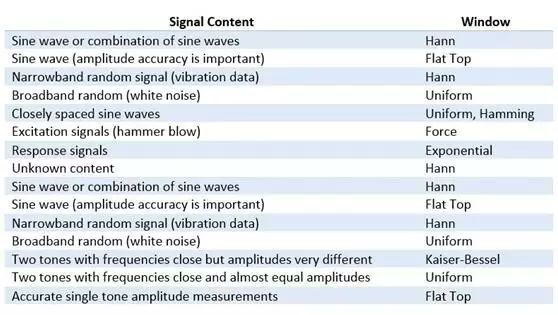
The above lists several common window functions. There is no universal method for choosing a window function. The following table can help you make an initial selection. Always compare the performance of window functions to find the most suitable one.
Summary
-
All signals in the time domain can be represented as a set of sine waves.
-
The FFT transform decomposes a time domain signal into a representation in the frequency domain, analyzing different frequency components within the signal.
-
Displaying signals in the frequency domain helps to discover interference, noise, and jitter within the signals.
-
If a signal contains a non-integer number of periods, frequency leakage will occur. This can be improved through windowing.
-
The boundaries of the finite sequences collected by digital instruments exhibit discontinuities. Windowing can reduce the amplitude of these discontinuous parts.
-
No window is called a uniform window or rectangular window because the effects of windowing still exist.
-
In general, the Hanning window is suitable for 95% of cases. It not only has good frequency resolution but also reduces spectral leakage.
-
Always compare the performance of window functions to find the most suitable one.

This article is sourced from the technical white paper section of the National Instruments website (ni.com).

The statement: This WeChat reprinted article is for non-commercial educational and research purposes and does not imply endorsement of its views or verification of its content’s authenticity. Copyright belongs to the original author. If the reprinted article involves copyright issues, please contact us immediately, and we will change or delete related articles to ensure your rights!