
Electron Paramagnetic Resonance (EPR) is a magnetic resonance technique derived from the magnetic moment of unpaired electrons. It can be used to qualitatively and quantitatively detect unpaired electrons contained in the atoms or molecules of substances, as well as to explore the structural characteristics of their surrounding environment. For free radicals, the orbital magnetic moment has little effect, and more than 99% of the total magnetic moment comes from the electron spin, which is why electron paramagnetic resonance is also referred to as “Electron Spin Resonance (ESR)”.
01
# EPR Models and Components
Common EPR models: Bruker A300, EPR200-Plus, EMXmicro.
Components: Control chassis, microwave bridge, magnet, electronics cabinet, resonant cavity, etc.
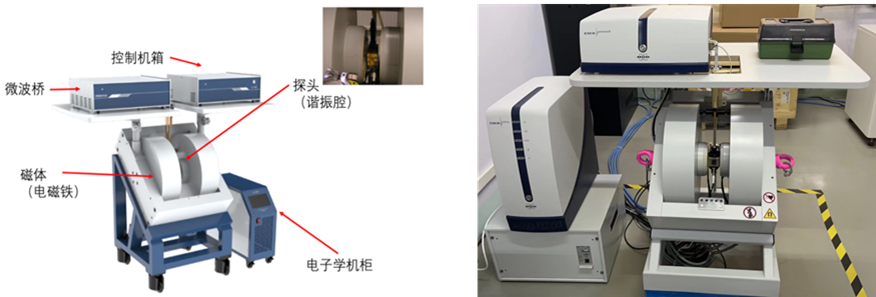
Figure 1: EPR instrument model construction diagram (left) and actual EPR instrument photo (right)
02
# EPR Testing Principles
In the EPR instrument, the magnetic field generated by the electromagnet system is perpendicular to the electromagnetic waves transmitted to the resonant cavity via the microwave bridge, and is also perpendicular to the scanning coil. When the frequency of the electromagnetic wave v and the magnetic field strength B meet the resonance absorption condition, the sample placed in the resonant cavity will resonate and absorb energy. The absorption signal is amplified in the resonant cavity and can be displayed on an oscilloscope after being processed by a phase-sensitive detector and recorded automatically.
Electromagnetic waves with frequency v are applied in a direction perpendicular to B. When hv=gβB is satisfied, the electrons between two energy levels undergo stimulated transitions, causing some electrons in the low energy level to absorb the energy of the electromagnetic waves and transition to the high energy level, which is the paramagnetic resonance phenomenon. The absorption signal generated by the stimulated transition can be processed by the electronics system to obtain the EPR absorption spectrum line.
In the basic conditions for generating electron paramagnetic resonance mentioned above, h is Planck’s constant, v is the microwave frequency, g is the spectral splitting factor (also known as the g-factor or g-value), β is the Bohr magneton, and B is the magnetic field strength. For free electrons, g=2.00232, β=9.2710×10⁻²¹erg/Gauss, and h=6.62620×10⁻²⁷erg·sec. Substituting these into the equation gives the relationship between the electromagnetic wave frequency and the resonance magnetic field (in MHz) = 2.8025B (Gauss).
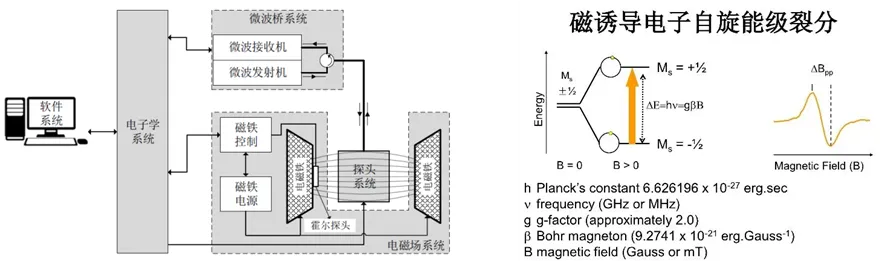
Figure 2: EPR instrument working principle diagram (left) and magnetic induced electronic spin energy level splitting schematic (right)
03
# Types of Samples That Can Be Detected
● Free radicals: Substances containing an unpaired electron in a molecule, commonly such as hydroxyl radicals (·OH) and superoxide radicals (O2·-).
● Biradicals or polyradicals: Compounds containing two or more unpaired electrons in a single molecule, but with their unpaired electrons being relatively far apart and having weak interactions.
● Triplet molecules: These compounds have two unpaired electrons in their molecular orbitals, but unlike biradicals, the two unpaired electrons are very close to each other, leading to strong interactions, such as in oxygen molecules. They can exist in either the ground state (triplet oxygen) or the excited state (singlet oxygen).
● Transition metal ions and rare earth ions: These molecules have unpaired electrons in their atomic orbitals, such as Ti3+ (3d1), V4+ (3d1), Mn2+ (3d5), Fe2+ (3d6), and Cu2+ (3d9).
● Lattice defects in solids: One or more electrons or holes fall into defects or nearby, forming a substance with a single electron, such as face-centered and body-centered defects.
● Atoms with an odd number of electrons and molecules containing single electrons: such as hydrogen, nitrogen, and alkali metal atoms.
First Order Discount200 Yuan Off!Scan to Consult ImmediatelyEPR/ESR and Other Testing
04
# Sample Requirements and Testing Conditions
4.1 Sample Requirements
● Liquid: Provide 2 mL for testing according to the plan.
● Powder samples: 10~20 mg, which do not affect tuning, placed in a 3 mm paramagnetic tube for testing; those affecting tuning, such as ferromagnetic samples, absorbing materials, etc., can be first placed in a 50 uL capillary tube and then into a 3 mm paramagnetic tube for testing.
● Films or sheets: Must be cuttable, such as films, electrode sheets can be cut into thin strips and placed in a 3 mm paramagnetic tube for testing. Hard-to-cut solids need to provide dimensions of 2 mm×2 mm, directly placed in a 3 mm paramagnetic tube for testing.
4.2 Testing Conditions
● Common capture agents for free radicals: DMPO (to test hydroxyl and superoxide radicals, use water as solvent for hydroxyl radical testing, and methanol for superoxide radical testing), BMPO (to test superoxide radicals), TEMP (to test singlet oxygen), TEMPO (to test photogenerated holes).
● Light source: Xenon lamp (300 W), mercury lamp (300 W and 500 W), and UV lamp. The xenon lamp simulates sunlight across all wavelengths; if specific wavelengths are needed, filters must be added.
● If testing for free radical scavenging, detailed testing steps must be provided. For example, for hydroxyl generated by the Fenton reaction: taking a total volume of 50 μL as an example: 1. The blank control is 25 μL H2O + 5 μL 100 mM DMPO + 10 μL 10 mM Fe2+ + 10 μL 100 mM H2O2; 2. The test sample group can replace all or part of 25 μL H2O with the catalyst.
● Testing temperature: The testing temperature range can be provided from 4 K to 600 K; under normal circumstances, testing at room temperature is sufficient. In special cases, such as testing metal valence states, low temperature testing may be better, which can be referenced in literature.
● Regarding quantification: Quantification must be activated before testing; it cannot be processed based on data after testing.
05
# Sample and Testing Process
5.1 Testing Free Radical Sample Preparation and TestingFree radicals generated by test samples: Mix 50 μL (5 μL of 1 mg/mL catalyst, 5 μL capture agent, 40 μL water) into a quartz capillary with an inner diameter of 0.9 mm, sealing the bottom end with a wax seal. Insert the capillary into the EPR test cavity, and collect the spectrum after a certain exposure time. 250 mM BMPO captures superoxide radicals (using water as solvent). 100 mM DMPO is used to capture hydroxyl radicals, 100 mM TEMP for singlet oxygen, and 100 mM TEMPO for capturing photogenerated electrons. Testing parameters are 20 dB microwave attenuation, 2 mW microwave power, center magnetic field 3510, scan range 100 G, magnetic field modulation of 1 G. The above is the conventional testing process, which can also be adjusted according to actual requirements. Testing for free radical scavenging: Detailed testing steps need to be provided based on the actual research system. For example, for hydroxyl generated by the Fenton reaction: taking a total volume of 50 μL as an example: 1. The blank control is 25 μL H2O + 5 μL 100 mM DMPO + 10 μL 10 mM Fe2+ + 10 μL 100 mM H2O2; 2. The test sample group can replace all or part of 25 μL H2O with the catalyst. Scavenging superoxide radicals, singlet oxygen, etc. requires providing a complete reaction system and testing time.5.2 Sample Preparation and Testing for Defects and Transition Metals Place an appropriate amount of sample into the sample tube, set the instrument parameters, and conduct the test. If comparing signal intensities between different samples, the same mass of samples must be taken under the same conditions.
06
# EPR Spectral Information
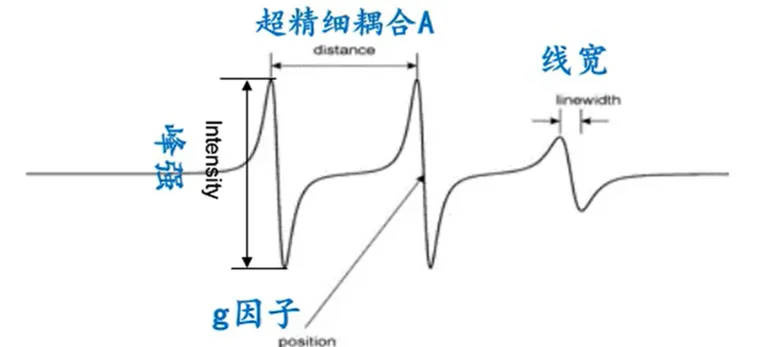
Figure3:EPR Spectral Information Example
◆ The position of the spectral line is related to the magnetic field and frequency (g factor, g=hv/βB) ◆ The number of spectral peaks and the spacing between them (hyperfine coupling constant A) ◆ Line width (mobility, spin coupling, and anisotropic effects) ◆ Linearity, shape of the spectral line (mobility, spin coupling, and anisotropic effects) ◆ Strength of the spectral line (concentration or relaxation effects)
07
# Common Free Radical Testing Principles and Spectral Analysis
7.1 DMPO Captures Hydroxyl and Superoxide Radicals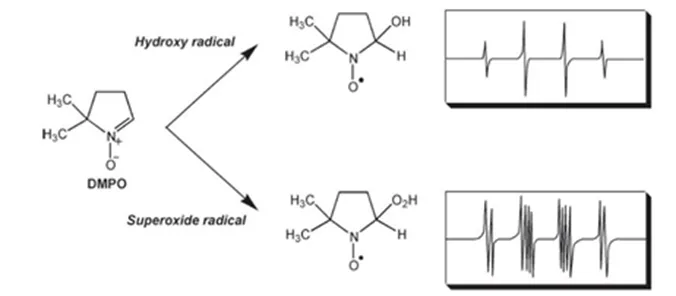
Figure 4: The reaction process of DMPO capturing hydroxyl and superoxide radicals
Figure 4 shows that using H2O as a solvent, DMPO easily reacts with hydroxyl to produce a 1:2:2:1 peak. Therefore, using H2O as a solvent, DMPO is more likely to capture hydroxyl radicals and less likely to capture superoxide radicals. Using DMPO to capture superoxide radicals is suitable to be conducted in methanol solvent. 7.2 BMPO Captures Hydroxyl and Superoxide Radicals
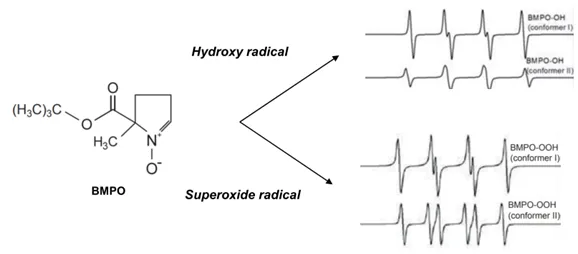
Figure 5: The reaction process of BMPO capturing hydroxyl and superoxide radicals
Figure 5 shows that using H2O as a solvent, BMPO captures hydroxyl and superoxide producing a 1:1:1:1 peak, but for the capture of superoxide, the two middle peaks will split into distinct small peaks. (Note: To accurately determine whether hydroxyl or superoxide is produced, it is recommended to add masking agents. For example, DMSO and ethanol can be used to scavenge hydroxyl; superoxide dismutase (SOD) can be used to validate superoxide.)
7.3 TEMP Captures Singlet Oxygen
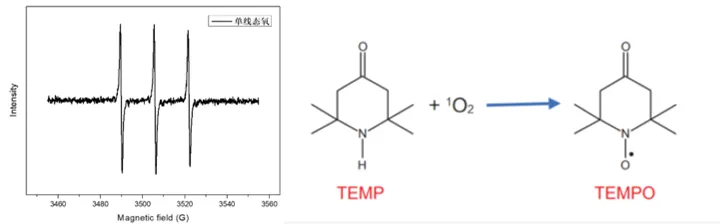
Figure 6: The reaction process of TEMP capturing singlet oxygen
Figure 6 shows that using H2O as a solvent, TEMP captures singlet oxygen generating TEMPO.
08
# EPR Spectral Horizontal Coordinate Unit Explanation
◆ Common horizontal coordinates have three units: Magnetic field (G), B (mT), g value (g factor is a dimensionless unit).
◆ Relationship: 10000 G (Gauss) = 1000 mT (Tesla) = 1 T (Tesla); g = hv/βB ◆ Generally, for free radical testing data, Magnetic field (G) or B (mT) is chosen; for vacancy, defects, and transition metal valence state testing data, the g factor is selected.
09
# Common Questions
Question 1: Do different free radicals require fixed solvents for testing?
Answer: This varies by system. Superoxide radicals are tested in methanol systems, hydroxyl radicals in water systems; different free radicals are tested in different systems and solutions because the binding force of water with DMPO is greater than that of superoxide radicals with DMPO. If superoxide radicals are tested in water, the binding speed of water with DMPO is faster than that of superoxide radicals with DMPO, making it difficult to capture superoxide radicals. This is the principle behind why they cannot be produced; however, if the production amount is particularly large, they may still be captured by DMPO. Therefore, the appropriate capture agent and testing environment must be selected for testing. Question 2: Is the signal strength of vacancies related to the quality of the sample? Answer: Yes, but not in a direct correlation. The situation is complex; first, the instrument design considers the signal saturation state, so more samples do not necessarily mean stronger signals. Sometimes, more samples can lead to weaker signals. Second, the sample volume’s occupation of the paramagnetic cavity must be considered; in cases of equal weight, larger volumes tend to have higher signal strength. Question 3: Is the relative content of vacancies determined by peak intensity or peak area? Answer: It is determined by peak intensity; peak width is related to material structure. Additionally, bulk samples are affected by volume and mass, making comparison difficult. For powder samples, under the same mass, if the volume difference is not large, samples with higher peak intensity generally have a higher relative vacancy content. Question 4: When testing photogenerated electrons (holes), why is the signal under light conditions weaker than in dark conditions? Answer: Because the signal measured in the dark is actually the signal of the capture agent TEMPO, not the signal of electrons (holes), which is stronger at that time; after exposure to light, electrons (holes) are generated, and the generated electrons are captured by the capture agent, reducing the amount of the capture agent, thereby weakening its signal. Thus, the signal weakening after light exposure indicates the generation of electrons (holes). (Electrons and holes appear in pairs; the generation of electrons inevitably leaves holes, so if the capture agent captures electrons, it indicates that holes have been generated, which is why the signal strength decreases.)
10
# EPR Application Fields
◆ Chemistry: Types of free radical generation, catalytic mechanisms, redox, Fenton reactions, transition metal oxides, polymerization reaction mechanisms.
◆ Biomedical: Structure of macromolecules (nucleic acids, proteins), ROS-related oxidative stress diseases, aging and diseases, occupational disease prevention and research. ◆ Environmental: Photocatalysis, Fenton reaction wastewater treatment, atmospheric pollution research, soil pollution. ◆ Physics and Materials: Metal fullerenes, defects, polymer materials, defect materials (optical fibers, gemstones), magnetic materials.
10.1 Detecting Free Radicals: Detecting Enzyme Activity in Biology
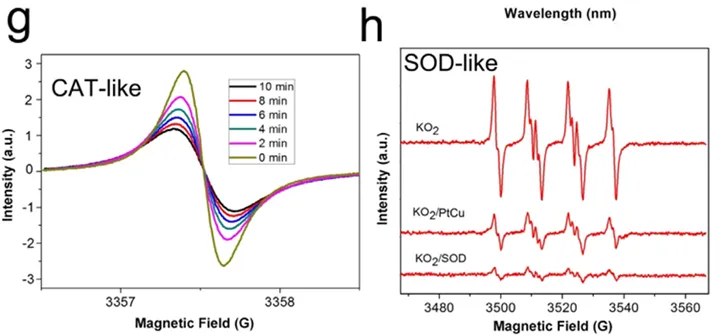
Figure 7: (g) Electron spin resonance (ESR) blood oxygen meter shows the CAT-like activity of PtCu NPs in reducing H2O2, and the evolution of ESR spectra over time in the presence of PtCu NPs in a closed chamber under 2 mm H2O2. (h) ESR spectral analysis confirms that PtCu NAs have SOD-like activity in reducing superoxide.
To further determine whether molecular oxygen is produced, this paper combines the spin label 4-oxo-2,2,6,6-tetramethylpiperidine-d16-15N-1-oxygen (15N-PDT) for ESR blood oxygen measurement. ESR blood oxygen measurement is based on the physical collision between molecular oxygen (O2) and the spin label (here using 15N-PDT). Because O2 is paramagnetic, the collision of PDT molecules with O2 generates spin exchange, shortening the relaxation time, thus broadening the ESR spectral line and reducing peak intensity. The degree of spin exchange depends on the concentration of O2; subtle changes in O2 concentration will lead to responses in the ESR spectral line width. When PtCu NAs are mixed with H2O2, the line width of the ESR signal increases over time and the peak intensity decreases, indicating the production of O2 (Figure 7g).
SOD is a specific enzyme that degrades superoxide, serving as an antioxidant to protect cellular components from oxidative damage caused by superoxides. To validate SOD-like activity, superoxide was generated in situ using a classic KO2 system in a non-proton solvent in the presence of crown ethers. Using 5-tert-butoxy-5-methyl-1-pyrroline N-oxide (BMPO) as a typical superoxide spin trap, ESR technology further validated SOD-like activity. Adding KO2 to the solution with BMPO produces a strong ESR signal caused by BMPO/•OOH (Figure 7h). As expected, when SOD or PtCu NAs are added, the ESR signal intensity significantly decreases, again indicating their catalytic ability to scavenge O2•−. The scavenging rate of 10 μg/mL PtCu NAs is comparable to that of 5 U/mL natural SOD, indicating that PtCu NAs have good SOD-like activity.
(Reference: https://doi.org/10.1016/j.nantod.2020.101027)
10.2 Detecting Free Radicals: Detecting Free Radicals Generated During Photocatalysis
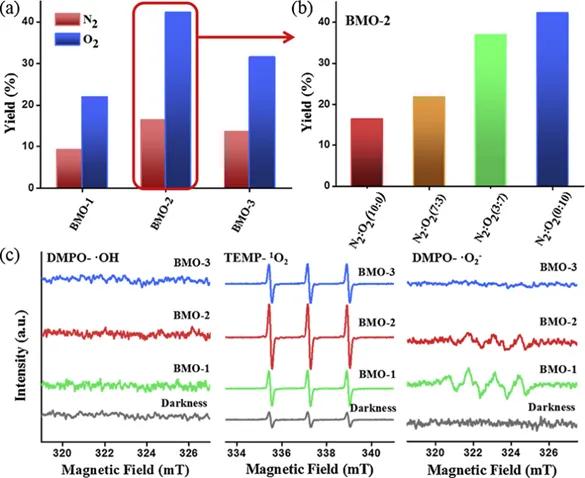
Figure 8: Under saturated N2 and O2 atmospheres (a), different ratios of N2/O2 gas mixtures (b), and the ESR spectra of DMPO-·OH, TEMP-1O2, and DMPO-O2·- under BMO samples (c) during the photocatalytic oxidation of glycerol to DHA
Electron spin resonance (ESR) measurements were used to determine the possible reactive oxygen species (ROS) generated. As shown in Figure 8c, in the presence of BMO samples, light irradiation can generate O2·– and 1O2, and negligible ·OH signals can be observed in the ESR spectra of all BMO samples. Among them, BMO-2 has the strongest ability to oxidize glycerol to DHA, and under the same conditions, BMO-2 produces the highest amount of oxygen. It is known that 1O2 is a highly reactive oxygen species that can act as a mild oxidant for selective oxidation. Therefore, it is believed that the high selectivity of BMO-2 in oxidizing glycerol to DHA is closely related to the large amount of produced 1O2. Consequently, this paper conducted scavenging experiments to elucidate the role of 1O2 in the selective oxidation of glycerol to DHA. However, in the presence of NaN3 (a 1O2 scavenger), the yield of DHA sharply decreased, indicating that 1O2 is the main reactant in the photocatalytic oxidation of glycerol to DHA.
(Reference: https://doi.org/10.1016/j.apcatb.2018.11.047)
10.3 EPR Detection of Defects: Detecting Oxygen Vacancies
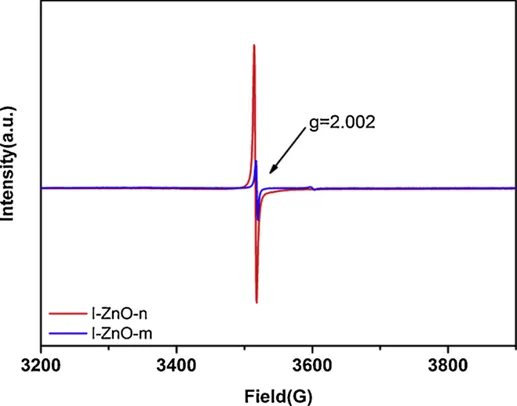
Figure 9: Solid electron magnetic resonance spectra confirm the oxygen vacancies on I-ZnO-n and I-ZnO-m
As shown in Figure 9, the paramagnetic signal near g = 2.002 is generally attributed to the bound single electron (VO+) caused by surface defects of the sample. From the spectrum, it can be seen that the signal intensity of I-ZnO-n is much stronger than that of I-ZnO-m, indicating that I-ZnO-n has more oxygen vacancies on its surface. This difference may lead to different concentrations of free radicals generated by the two catalysts during photocatalysis.
(Reference: 10.1016/j.apcatb.2019.117873)
10.4 EPR Detection of Transition Metals: Mo5+
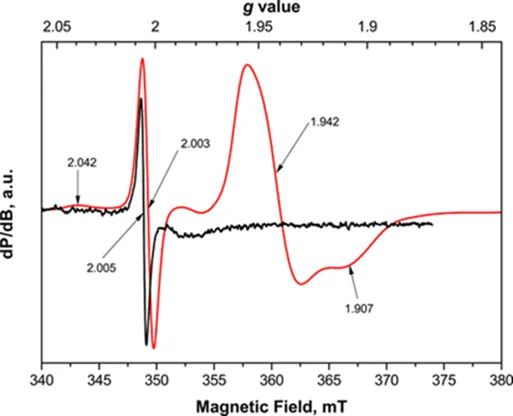
Figure 10: ESR detection of original bulk (multi-layer) and exfoliated (few-layer) MoS2 samples, analyzing changes in electronic structure
Figure 10 shows significant changes in the spectrum after exfoliation treatment of MoS2. The two signals were compared after normalization in intensity. The spectrum of the original material consists of a relatively narrow asymmetric signal with characteristic g = 2.005, attributed to sulfur-coordinated defects (sulfur-Mo5+). In the exfoliated sample, three different signal components can be observed. A broad low-intensity resonance appears at g = 2.042, a sharp and nearly symmetric resonance appears at g = 2.003, and a broad axial resonance appears at g⊥ = 1.942 and g∥ = 1.907. Compared to the multi-layer samples, the nearly symmetric line in the region near the free electron (ge) value has shifted slightly to a higher magnetic field, attributed to defects with the same structure. The signal at g = 2.042 in the exfoliated treatment can be attributed to paramagnetic sulfur stabilized in the structure of poorly crystallized MoS2. g = 1.942 is similar to previously reported oxygen-containing Mo5+ species (g = 1.94 and 1.89) that bond with oxygenated Mo5+ (g = 1.91). In the exfoliated treatment, the particle size decreases, and many Mo–S bonds may be broken, leading to the formation of unsaturated Mo atoms bonding with oxygenated Mo5+.
(Reference: https://doi.org/10.1021/acs.chemmater.7b01245)
10.5 In Situ EPR Accurately Identifying Free Radicals During UV Oxidation Processes
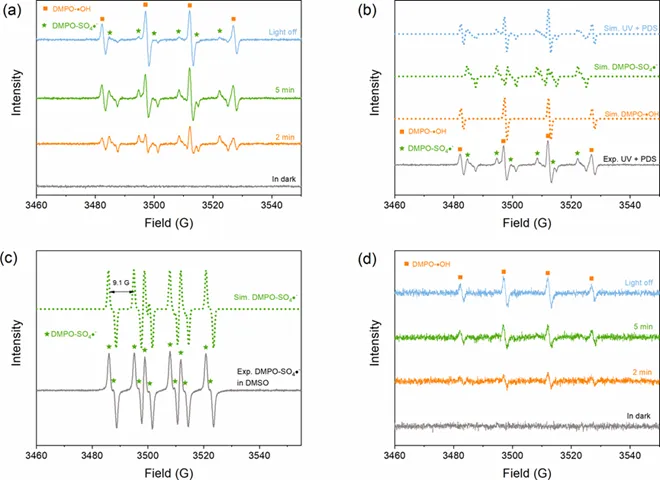
Figure 11: EPR spectra of free radicals captured by DMPO in the UV/PDS (UV/S2O82-) or UV/PMS (UV/HSO5–) systems: (a) signals captured in PDS (10 mM) water before and after switching the UV lamp; (b) experimental UV/PDS (5 min), simulating DMPO-⋅OH and simulating DMPO- SO4⋅− signals
EPR testing clearly indicates that in the UV/PDS system, SO4⋅− is generated first, and over time, the signal of SO4⋅− gradually converts to ⋅OH signal (Figure 11a). After turning off the light for 5 minutes, almost all SO4⋅− signals convert to DMPO-⋅OH, indicating that DMPO-⋅OH is more stable than DMPO- SO4⋅−. Therefore, in UV/PMS or UV/PDS systems, conclusions regarding the production of ⋅OH may be misleading because: (i) the DMPO-⋅OH signal may be attributed to the conversion from SO4⋅− to ⋅OH; (ii) DMPO-SO4⋅− can also be converted to DMPO-⋅OH through nucleophilic substitution and intramolecular cleavage reactions. However, in the UV/PMS and UV/PDS reactions, these two conversions (from SO4⋅− to HO⋅ or from DMPO-SO4⋅− to DMPO-HO⋅) are difficult to distinguish. After turning off the light, the increase in DMPO-HO⋅ signal can only be attributed to the conversion of DMPO-SO4⋅−, due to the longer half-life of DMPO-SO4⋅− (at 1 minute) compared to SO4⋅− (30 – 40 μs). Through simulation, combining ⋅OH spectral (AN=AH= 14.9 G) and SO4⋅−(AN = 13.8G、AH = 10.1 G, Hγ= 1.4 G, Hγ= 0.8 G) also yields similar results (Figure 11b).
(Reference: https://doi.org/10.1016/j.watres.2022.118747)
Synchrotron Radiation | Spherical Aberration Electron Microscopy | FIB-TEM
In Situ XPS, In Situ XRD, In Situ Raman, In Situ FTIRExpedited Testingwww.xueyanhui.com

If there are any misreads or errors in the above content, please kindly correct us.
Thank you for your understanding.