Perface
When locating issues, strong skills are naturally required, but having a powerful tool will definitely help us a lot.
The official IDE may not meet our needs, and we may need to look for other professional tools. Among them, the debugging tools provided by Lauterbach are highly regarded.This company specializes in providing high-end debugging solutions for various chips and processors, and its tools are powerful and easy to use, but relatively expensive.
For certain specific fields or large projects, the complexity and scale of the system require more powerful debugging tools. At this point, Lauterbach becomes a trustworthy choice.
Their debugging tools can capture sporadic issues, perform crash debugging, code analysis, function runtime testing, and other operations, which are very practical features during the development process.
I believe many friends have used or heard of it at work, but for small businesses and individual developers, Lauterbach’s debugging tools are still too costly.
Of course, this is not about the tools themselves, but rather about CoreSight, which closely cooperates with these tools.
This article mainly introduces: a discussion about CTI, ETM, PTM, ITM, HTM, ETB in CoreSight…
Understanding Common Terms in ARM Debugging: CoreSight, ETM, PTM, ITM, HTM, ETB
When using Lauterbach, we will have the following printout:
++++++++++++ DAP Discovery        -> Guessed Debugger Setup ++++++++++++++++++
AP#0         APB2/3-AP            -> SYStem.CONFIG DEBUGACCESSPORT  0. 0xxxxxxxxx  ROMTABLE             -> no setup required 0xxxxxxxxx  DEBUG Cortex-A55     -> SYStem.CONFIG.COREDEBUG.Base   0xxxxxxxxx   0xxxxxxxxx  CTI                  -> SYStem.CONFIG.CTI.Base         0xxxxxxxxx   0xxxxxxxxx  PMU Cortex-A55       -> SYStem.CONFIG.BMC.Base         0xxxxxxxxx   0xxxxxxxxx  ETM/PTM              -> SYStem.CONFIG.ETM.Base         0xxxxxxxxx   0xxxxxxxxx  DEBUG Cortex-A55     -> SYStem.CONFIG.COREDEBUG.Base   0xxxxxxxxx   0xxxxxxxxx  CTI                  -> SYStem.CONFIG.CTI.Base         0xxxxxxxxx   0xxxxxxxxx  PMU Cortex-A55       -> SYStem.CONFIG.BMC.Base         0xxxxxxxxx   0xxxxxxxxx  ETM/PTM              -> SYStem.CONFIG.ETM.Base         0xxxxxxxxx
AP#3         AXI-AP               -> SYStem.CONFIG AXIACCESSPORT  3. 0x00000000  ROMTABLE             -> no setup required
++++++++++++++++++++++++++++++++++++++++++++++++++++++++++++++++++++++++++++++•AP#0: Indicates the process number of the application, where “0” represents the first process.•APB2/3-AP: Indicates applications on APB bus 2 and APB bus 3. APB (Advanced Peripheral Bus) is an advanced external bus used to connect peripherals in embedded systems.•SYStem.CONFIG: Represents system configuration, and this log records information related to system configuration.•DEBUGACCESSPORT: Represents the debug access port used for remote debugging and accessing the device.•ROMTABLE: Represents the ROM table used to store configuration information and address mapping for the device.•Cortex-A55: Represents the ARM Cortex-A55 processor, which is suitable for high-performance, low-power applications.•CTI: Represents the Cortex Test Interface (CTI), used for testing and debugging on Cortex-A processors.•PMU: Represents the Power Management Unit (PMU), used to manage the power state of the processor.•ETM/PTM: Represents the Embedded Trace Macrocell (ETM) and Processor Trace Macrocell (PTM), used for tracing and debugging within the processor.•SYStem.CONFIG.COREDEBUG.Base and SYStem.CONFIG.CTI.Base, etc.: Represent the base addresses of different modules in the system configuration used for debugging and accessing these modules.•BMC.Base: Represents the base address of the Baseboard Management Controller (BMC), used for hardware management controllers (typically in service processors).
Let’s first take a look at what these keywords mean?
CoreSight
•CoreSight
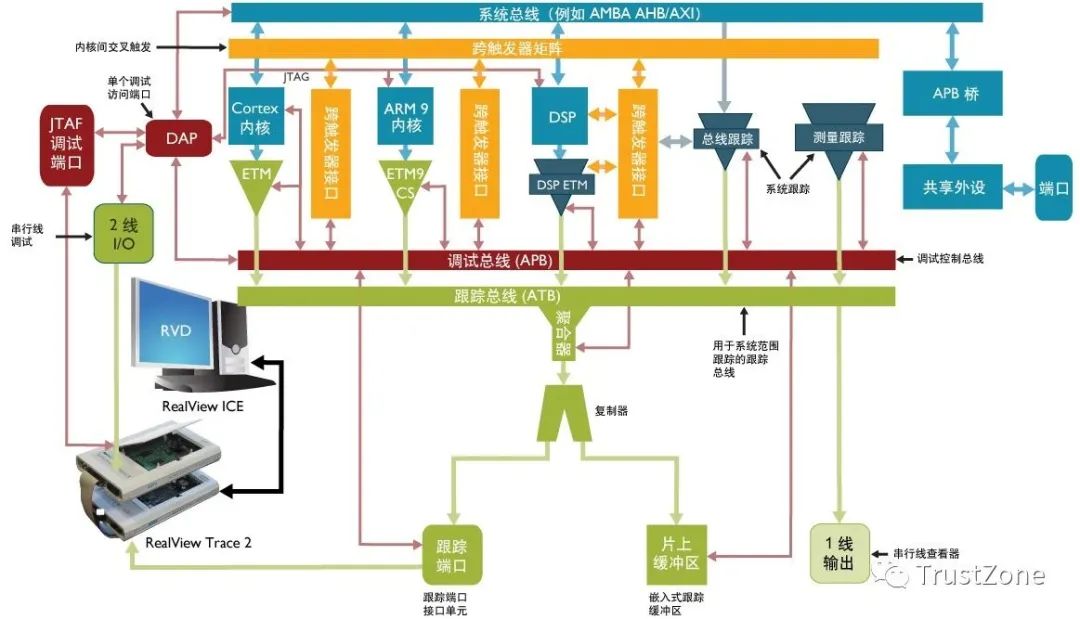
CoreSight is an infrastructure that provides debugging, monitoring, and optimization of the performance of complete System on Chip (SoC) designs. CoreSight™ tracing macro units provide comprehensive non-intrusive visibility within the SoC.
By following the CoreSight architecture specifications, it is easy to integrate partner-specific tracing macro units into the CoreSight system. CoreSight is an architecture proposed by ARM for debugging and tracing complex SoCs (System on a Chip). It is a collection of hardware and software components designed to provide powerful debugging and testing capabilities to help developers develop and maintain complex embedded systems.
The main components of CoreSight include:
•CTI (Cross-Trigger Interface): Used to transmit trigger signals between processors and other components to control execution flow and trigger debugging events.•CTM (Cross-Trigger Matrix): Used to implement the mutual sending and receiving of trigger signals between multiple CTIs to support multi-processor debugging and testing.•ETM (Embedded Trace Macrocell): Used to trace the address and data of instructions executed by the processor, generating trace data for debugging and testing purposes.•PTM (Processor Trace Macrocell): Used to implement tracing functions within the processor, recording the state and events of the processor for debugging and testing purposes.•TMC (Trace Memory Controller): Used to control the storage and retrieval of trace data, saving trace data to external memory or reading trace data from external memory.•DCC (Debug Communication Controller): Used to implement communication between the debugger and the target device, including sending debugging commands to the target device or reading data from the target device.•DMC (Debug Memory Controller): Used to control access to the memory of the target device, including writing data to or reading data from the target device memory.
Through the combination and configuration of these components, CoreSight can achieve debugging and tracing functions for complex SoCs. Developers can use debugging toolchains to access and process the trace data generated by CoreSight for troubleshooting, performance optimization, security analysis, and other operations.
CTI
The CoreSight CTI is a debugging and testing interface for ARM Cortex-A series processors. It provides a hardware trigger signal mechanism for testing the internal state of the processor and implementing tracing and debugging functions.
In terms of hardware structure, the CTI interface connects to the debug port of a Cortex-A processor and is connected to one or more other CTI interfaces or debugging tools. It consists of a set of trigger signal lines used to send trigger signals to the processor or receive trigger signals from the processor.
Trigger signals are electrical signals used to control the processor to perform specific operations. By using CTI trigger signals, debugging tools can control the execution flow of the processor, allowing it to pause execution under specific conditions or place the processor in a debugging state.
CTI trigger signals come in various types, including software trigger signals, hardware trigger signals, and trace trigger signals.
Among them,
•Software trigger signals are used to place the processor in debugging mode through debugging commands;•Hardware trigger signals are used to trigger the processor to perform specific operations based on preset conditions or events;•Trace trigger signals are used to generate trace data while the processor executes code.
In addition to trigger signals, CTI also provides some other debugging and testing features. For example, it can read and write data by accessing the internal registers and memory of the processor to check the processor’s state or control the processor to perform specific operations. Additionally, CTI can generate interrupt signals to interrupt the processor’s execution under specific conditions.
Types of CTI Trigger Signals
•Input triggers: These trigger signals are sent from the processor to the CTI to trigger events input to the CTI. When the processor detects a specific event, it sends the trigger signal to the CTI through the Input triggers signal line. These signals can be used to control the execution flow of the processor, such as pausing the processor’s execution under specific conditions or placing it in a debugging state.•Output triggers: These trigger signals are sent from the CTI to the processor to trigger events output to the processor. When the CTI detects a specific event, it sends the trigger signal to the processor through the Output triggers signal line. These signals can be used to control the execution flow of the processor, such as triggering the processor to perform specific operations under specific conditions or placing it in a debugging state.•Input channels: These signals are channel events input to the CTI. When the CTM (Cross-Trigger Matrix) detects a specific event, it sends the signal to the CTI through the Input channels signal line. These signals can be used to control the execution flow of the processor, such as triggering the processor to perform specific operations under specific conditions or placing it in a debugging state.•Output channels: These signals are channel events output to the CTM. When the CTI detects a specific event, it sends the signal to the CTM through the Output channels signal line. These signals can be used to control the execution flow of the processor, such as triggering the processor to perform specific operations under specific conditions or placing it in a debugging state.
These types of trigger signals provide fine control over the execution flow of the processor, allowing developers to more easily perform debugging and testing. By using these trigger signals, debugging tools can flexibly control the execution flow of the processor to check the processor’s state or perform specific operations under specific conditions.
CTM: The CoreSight CTM (Cross-Trigger Matrix) is a cross-trigger matrix used to implement the mutual sending and receiving of trigger signals between multiple CTIs (Cross-Trigger Interface). It can send trigger signals from one CTI to another CTI to propagate events between devices. Each core and DSP has a CTI component connected, and the CTI can send trigger signals to the processor (DSP) and receive trigger signals from the processor (DSP). All CTIs are connected to the CTM, allowing the mutual sending and receiving of trigger signals between multiple CTIs. This information is very helpful for understanding and using the CoreSight CTM.
ETM, Embedded Trace Macrocell
The ETM macrocell provides real-time instruction tracing and data tracing for ARM microprocessors. Tracing software tools use the information generated by ETM to reconstruct the execution of all or part of the program.
ETM (Embedded Trace Macrocell) is a hardware unit used in ARM microprocessors, mainly for providing real-time instruction tracing and data tracing. This tracing information is very useful for debugging and performance analysis tasks.
The main functions of the ETM macrocell are as follows:
•Real-time instruction tracing: ETM can trace every instruction executed by the microprocessor. This allows developers to precisely understand the behavior of the program during execution, which is particularly important for debugging and performance optimization.•Data tracing: ETM can also trace the flow of data within the microprocessor. This allows developers to clearly see which data is read, written, and modified, which is very helpful for understanding the data usage of the program.
Using the information generated by ETM, developers can use tracing software tools to reconstruct all or part of the program’s execution. This allows developers to gain deeper insights into how the program operates, helping to identify potential errors or performance bottlenecks.
A Moment of Plain Language
ETM is like a “spy” inside the microprocessor, quietly observing and recording what the microprocessor is doing. For programmers, it’s like having a personal assistant who tells them when, where, and how the program runs.
•Instruction tracing: Imagine you have a friend helping you write a program, but the code they wrote has issues, causing the program to behave abnormally. At this point, ETM is like a hidden camera that records every line of code your friend writes. By looking at the information recorded by ETM, you can pinpoint where the program went wrong, just like watching a replay.•Data tracing: ETM can also track the flow of data during program execution. For example, if your program needs to read a file and then process it. With ETM, you can see when the program read the file, which data was read, and how that data was processed later. This allows you to better understand the program’s execution process and see if there are areas for improvement.
ETM acts like a “monitoring camera” for the microprocessor, silently recording every behavior of the program. With this recorded information, programmers can better understand the program’s behavior, identify potential issues, and optimize performance.
How Does ETM Help Optimize Program Performance?
•Identifying performance bottlenecks: By using the data tracing information provided by ETM, developers can clearly see which parts of the code are the slowest during program execution, thus identifying performance bottlenecks. This allows them to target these bottlenecks for optimization to improve overall program performance.•Understanding data usage: Through ETM’s data tracing capability, developers can clearly see how data is read, written, and modified during program execution. This helps them better understand the program’s data usage, allowing them to optimize data structures, algorithms, or data processing flows to enhance program performance.•Instruction optimization: By observing every instruction executed by the program using ETM’s instruction tracing capability, developers can optimize these instructions, such as using more efficient instruction sets or optimizing instruction ordering, to improve program execution speed.•System-level optimization: The information provided by ETM can help developers optimize not only the program itself but also the entire system. For example, through data provided by ETM, developers can better understand the program’s status in terms of memory, CPU utilization, etc., allowing them to optimize system configuration or adjust system parameters to enhance overall system performance.
What Data Tracing Information Does ETM Provide?
ETM provides the following types of data tracing information:
•Instruction tracing information: ETM records every instruction executed by the microprocessor. This allows developers to understand the complete process of program execution, including the order of instruction execution, execution time, etc. This information is very useful for debugging programs and performance optimization.•Data tracing information: ETM also records the reading, writing, and modification of data within the microprocessor. This allows developers to understand how data changes during program execution, thus gaining better insights into the program’s operation.•Exception and interrupt information: When the program encounters exceptions or interrupts, ETM records related information, including the type of exception, occurrence time, location, etc. This helps developers better understand the program’s exception handling and interrupt response mechanisms.•System-level information: In addition to instruction and data tracing information, ETM can also provide some system-level information, such as CPU utilization, memory usage, etc. This helps developers better understand the program’s operating environment and system resource configuration.
The Instruction Tracing Information Recorded by ETM Includes:
•Instruction address: The address of each instruction in memory.•Instruction opcode: The opcode of the instruction, which indicates what operation the instruction performs.•Instruction parameters: Parameters required by the instruction, such as operands, offsets, etc.•Instruction execution time: The time when the instruction is executed.•Instruction source: Where the instruction is read from, such as a register, memory address, or external device.•Instruction target: Where the result of the instruction is stored, such as a register or memory address.•Instruction execution result: The result of the instruction after execution, such as calculation results, jump targets, etc.
PTM, Program Trace Macrocell
PTM is a module that performs real-time instruction stream tracing based on the Program Flow Trace (PFT) architecture. Tracing tools use the information generated by PTM to reconstruct all or part of the program’s execution.
PTM is a hardware or software module designed to perform real-time instruction tracing during program execution. It records the sequence of instructions executed by the program, enabling developers to understand all the details of program execution.
This sequence of instructions or “tracing information” can serve various purposes:
•Program debugging: By examining the instruction sequence generated by PTM, developers can accurately understand when, where, and how each instruction is executed. This is very helpful for identifying errors, exceptions, or performance issues within the program.•Performance analysis: The instruction sequence provided by PTM can also be used for performance analysis. By analyzing this information, developers can identify which parts of the program consume the most computational resources, thus pinpointing potential performance bottlenecks.•Program reconstruction: Tracing tools can use the information generated by PTM to reconstruct the program’s execution. This allows developers to review the state and behavior of the program after it runs or during specific program states (e.g., when an error occurs).•System-level optimization: The information provided by PTM can be used not only to optimize the program itself but also to optimize the entire system. For example, by analyzing the information provided by PTM, system administrators can understand the program’s memory usage, CPU utilization, etc., thus optimizing system resource allocation.
A Moment of Plain Language
PTM is like a recorder that diligently “listens” to every instruction while the program runs and records it. This recorded information is like a book that documents how the program runs step by step.
So, what information does PTM record?
•Instruction order: PTM records the order of instructions executed by the program. It’s like knowing the sequence of every shot in a movie.•Instruction content: PTM also records the content of each instruction. It’s like knowing what happens in every shot of a movie.
What is the use of the recorded information from PTM?
•Finding errors: If the program’s output is incorrect, the recorded information from PTM acts like a “live broadcast” replay, helping developers identify where the problem lies.•Optimizing performance: By using the information recorded by PTM, developers can identify which parts of the program are “slow,” much like identifying the “bottleneck” in a race. Targeting these areas for optimization can enhance the overall performance of the program.•Program replay: The recorded information from PTM also allows developers to review the program’s execution. It’s like re-watching a movie, helping developers better understand the program’s behavior.
What Other Uses Does PTM’s Recorded Information Have?
This information can be used for program visualization, debugging, and performance analysis, among other aspects. PTM’s recorded information can also be used for reverse engineering of programs, such as inferring the structure and functionality of a program during reverse analysis.
Additionally, PTM can be used for software testing and validation. By replaying the program’s execution, the correctness and reliability of the program can be verified. In summary, the recorded information from PTM has significant application value in program development, debugging, optimization, testing, and validation.
Relationship Between PTM and ETM
PTM and ETM are both part of the Embedded Trace Macrocell (ETM) architecture specification, and their relationship is complementary. ETM is a general-purpose tracing macrocell that can be used to trace different types of information, such as instruction tracing and data tracing. PTM is a specific implementation of ETM, specifically designed for Program Flow Tracing (PFT).
Both PTM and ETM provide real-time tracing information that can be used for debugging, performance analysis, and program validation. PTM primarily records the sequence of instructions and related program flow information, such as branch instructions and exception events. ETM, on the other hand, can record a broader range of information, such as instruction addresses, data addresses, and data values.
In practical applications, ETM and PTM are often used together. For example, during program debugging, ETM can be used to trace the instructions and data flow of the program, while PTM can be used to trace the program’s flow and execution path. This provides a comprehensive understanding of the program’s execution, aiding developers in debugging and optimization.
What is the Relationship Between PTM and ETM in the ETM Architecture Specification?
The relationship between PTM and ETM in the ETM architecture specification is complementary. ETM is a general-purpose tracing macrocell that can be used to trace different types of information, such as instruction tracing and data tracing. PTM is a specific implementation of ETM designed for Program Flow Tracing (PFT).
PTM performs real-time instruction flow tracing based on the PFT architecture, copying the executing code and tracing only at certain program execution points (called waypoints). These points are determined by specific mechanisms within PTM, such as when executing a particular instruction or reaching a specific data condition, PTM begins to record the current instruction and data state.
PTM records the instruction execution status between these waypoints, helping developers understand the specific flow and path of program execution. Additionally, PTM can log critical events that occur during program execution, such as exception events and branch instructions, which are crucial for debugging and performance analysis.
They are like a pair of twins, each with different characteristics but closely related.
ETM is a very powerful “recorder” that can log a lot of information while the program runs. PTM, on the other hand, is like a focused “younger brother” that tells ETM exactly what information about the program’s “movement” to record.
PTM says: “I only care about how the program moves; everything else is of no concern to me.” Therefore, the information recorded by PTM is solely about how the program moves from one place to another, which is the sequence of instructions executed during the program.
ETM listens to PTM’s instructions, so it only records the instructions and data during program execution. However, it does not only record the instruction sequence but also logs other information, such as when and where the instruction was executed, and the memory address where it was executed.
Thus, PTM and ETM are like a well-coordinated team. PTM tells ETM what to focus on, and ETM records that information diligently. Together, they provide a more comprehensive and accurate record of program execution.
How Are Waypoints Generated Here?
PTM’s waypoints are generated internally through a specific mechanism. PTM determines the locations of these waypoints based on preset conditions or rules.
A common approach is to use preset breakpoints as waypoints. Developers can set specific breakpoints in the program, and when the program execution reaches these breakpoints, PTM will start recording the current instruction and data state. These breakpoints can be fixed positions or dynamically generated based on certain conditions. For example, when the program executes a particular instruction or reaches a specific data condition, PTM can treat it as a waypoint and begin recording.
Another common approach is to use dynamic counters as waypoints. PTM maintains a counter internally, and when the counter reaches a preset value, PTM will start recording the current instruction and data state. This method allows for dynamic generation of waypoints as needed, without requiring preset breakpoints in the program.
Regardless of the method used, PTM’s waypoints are generated based on preset conditions or rules, allowing for flexible configuration as needed. The locations of these waypoints are crucial for PTM, as they determine which instructions and data states PTM records, thereby helping developers understand the specific flow and path of program execution.
ITM, Instrumentation Trace Macrocell
The CoreSight ITM block is a software application-driven trace source. Supported code generates Software Instrumentation Trace (SWIT). Additionally, this block provides a coarse timestamp function.
The ITM block is a part of the Embedded Trace Macrocell (ETM) architecture specification, serving as a software application-driven trace source. When applications execute, the ITM block can monitor and record the execution process of the application and generate Software Instrumentation Trace (SWIT).
SWIT is a trace data format that records the sequence of instructions and related data during application execution. This data can be used for debugging, performance analysis, and troubleshooting. By analyzing SWIT data, developers can understand the specific flow of program execution, data access patterns, function call relationships, etc., thus gaining a better understanding of the program’s behavior and performance.
In addition to generating SWIT data, the ITM block also provides a coarse timestamp function. This timestamp can be used to measure the time taken for code execution, although it may not be very precise. Nevertheless, this timestamp is still very useful for assessing program execution efficiency, identifying performance bottlenecks, and troubleshooting.
By using the ITM block, developers can execute applications on actual hardware while collecting trace data. This data can be transmitted to the host for analysis and processing via interfaces such as serial port or JTAG. This allows developers to monitor and trace the execution of applications in a real operating environment, thereby gaining better insights into the program’s behavior, performance bottlenecks, and potential errors.
In summary, the ITM block provides an efficient tracing solution that helps developers better understand program behavior, performance, and error causes. It plays a crucial role in the development of embedded systems and is an indispensable tool in debugging, performance analysis, and troubleshooting.
The main uses of this block include:
•Supporting printf-style debugging•Tracing operating system and application events•Issuing diagnostic system information
Relationship Between ITM, PTM, and ETM
The ITM (Instrumentation Trace) block, PTM (Program Trace Macro) block, and ETM (Embedded Trace) block are all part of the Embedded Trace Macrocell (ETM) architecture specification, and they have a close relationship.
ETM is a general-purpose tracing macrocell that can be used to trace various types of information, such as instruction tracing and data tracing. PTM is a module that performs real-time instruction flow tracing based on the Program Flow Trace (PFT) architecture. PTM can record the sequence of instructions executed by the program and other related information to help developers understand the execution flow and path of the program.
The ITM block is a software application-driven trace source that supports generating Software Instrumentation Trace (SWIT) through specific code. The ITM block also provides a coarse timestamp function that can be used to measure code execution time.
The relationship between the ITM block and the PTM and ETM blocks is complementary. PTM is primarily used for program flow tracing, while the ITM block provides finer-grained instruction tracing and timestamp functionality. The ETM block, as a general-purpose tracing macrocell, can integrate the functions of both the ITM and PTM blocks and select different tracing modes as needed.
In practical applications, ETM, PTM, and ITM are often used together. ETM serves as the core tracing macrocell that records various information during program execution. PTM performs real-time instruction flow tracing based on the program flow tracing architecture, while the ITM block provides finer-grained instruction tracing and timestamp functionality. The cooperation of these macro cells can provide a more comprehensive and accurate tracing of program execution.
HTM, AHB Trace Macrocell
HTM can display bus information that cannot be inferred from kernel tracing using ETM:
Understanding multi-layer bus utilization. Software debugging. For example, visibility of memory region access and data access. Detecting bus events for tracing triggers or filters, as well as bus analysis. HTM provides address and data tracing information about the AHB bus. By combining the information in HTM with the debugger, convenient and precise debugging of AHB-based embedded systems can be performed. HTM provides extensive resources for generating trigger events for event identification. HTM generates output trace data through the AMBA Trace Bus (ATB). The tracing and debugging functions are non-intrusive. The HTM can be controlled using the APB (AMBA v3) interface.
What Scenarios is HTM Used For?
HTM is mainly used in virtualized environments. The HTM block is used to display tracing information for virtual machine monitors (VMM) or operating system kernels.
It provides a mechanism for the VMM to obtain and display information related to virtual machines, such as the instruction sequence and memory access of the virtual machine.
The HTM block can be used to monitor and control the execution of virtual machines, helping developers better understand the behavior and performance of virtual machines. Therefore, HTM plays an important role in virtualization technology, and can be used for debugging, optimizing, and monitoring the operating status of virtual machines.
STM, System Trace Macrocell
STM provides all software developers with low-cost real-time visibility of software and hardware execution, especially application and kernel developers, thus providing rich and optimized low-power software for devices supporting ARM processors throughout the supply chain.
STM is a software tool that allows developers to observe and analyze their programs’ execution on hardware at a low cost. This tool is particularly useful for application and kernel developers as it helps them better understand the execution of programs, making it easier to identify and fix issues.
The working principle of STM is to record the sequence of instructions executed by the program and other related information, such as register states and memory access. This information can be transmitted to the host for analysis and processing via interfaces such as serial port or JTAG. Through this information, developers can understand the timing and order of program execution, thus optimizing program performance.
In addition to playing an important role in problem-solving and optimization during the development process, STM also provides rich and optimized low-power software for devices supporting ARM processors throughout the supply chain. By using STM, device manufacturers can obtain a reliable and efficient tool to optimize the energy consumption of their devices while enhancing their functionality and performance. This is crucial for current and future ARM processor devices, as these devices often need to deliver higher performance in smaller spaces while minimizing energy consumption.
In summary, STM acts like a “monitor” that helps developers observe the execution of programs in real-time, making it easier to identify and resolve issues. At the same time, it provides device manufacturers with tools to optimize their device performance, enabling ARM processor devices throughout the supply chain to better meet user needs.
ECT, Embedded Cross Trigger
CoreSight ECT is a control and access component that supports the interaction and synchronization of multiple trigger events within the SoC.
CoreSight ECT is a control and access component that supports the interaction and synchronization of multiple trigger events within a System on Chip (SoC). ECT (Error Checking and Correction) is a mechanism used to detect and correct memory errors, which is typically used in computer systems to ensure data integrity and reliability.
CoreSight is ARM’s embedded debugging and tracing platform that provides a complete toolchain for developing and debugging ARM processor-based systems. ECT is part of the CoreSight platform, providing an efficient mechanism for memory error detection and correction to ensure data integrity and reliability during system operation.
ECT detects data errors by inserting checksums into memory and using one or more ECC (Error Checking and Correcting) registers to store the checksums. When the system reads or writes to memory, ECT automatically calculates the checksum and compares it to the checksum stored in the ECC register. If an error is detected, ECT automatically corrects single-bit errors and reports multi-bit errors.
In addition to supporting memory error detection and correction, ECT also supports interaction and synchronization of multiple trigger events within the SoC. This means ECT can communicate with other CoreSight components and external hardware devices to achieve more complex event processing and system control. For example, ECT can work with other CoreSight components to implement system-level error detection and correction or communicate with other hardware devices for more efficient memory access and control.
CoreSight ECT is a powerful control and access component that supports the interaction and synchronization of multiple trigger events within the SoC and provides an efficient mechanism for memory error detection and correction to ensure system integrity and reliability.
What is the Working Principle of CoreSight ECT?
CoreSight ECT (Error Checking and Correction) is a mechanism used to detect and correct memory errors, primarily operating during system runtime. Below is a brief explanation of its working principle:
•Checksum calculation: When the system writes data to memory, ECT automatically calculates the checksum of the data. This checksum is derived from each byte of data and is stored in one or more ECC (Error Checking and Correcting) registers.•Checksum verification: When the system reads data from memory, ECT automatically calculates the checksum of the data and compares it to the checksum stored in the ECC registers. If the two checksums match, the data is correct; otherwise, there is an error.•Error correction: If a data error is detected, ECT automatically corrects single-bit errors. It uses the correct checksum stored in the ECC register to fix the erroneous data and informs the system to continue operation. For multi-bit errors, ECT reports the error but does not correct it, as multi-bit errors may exceed its correction capability.•Trigger event interaction and synchronization: In addition to supporting memory error detection and correction, ECT also supports interaction and synchronization of multiple trigger events. This allows ECT to work with other CoreSight components and external hardware devices to achieve more complex event processing and system control. For example, ECT can work with CTI (Cross-Trigger Interface) components to implement mutual sending and receiving of multiple trigger events.
The working principle of CoreSight ECT is to utilize checksum calculations and checks to detect data errors and use ECC registers to correct single-bit errors. At the same time, it also supports interaction and synchronization with other components to achieve more complex event processing and system control.
How Does ECT Interact with External Hardware Devices?
First, ECT can interact with other CoreSight components. CoreSight is ARM’s embedded debugging and tracing platform that provides a complete toolchain for developing and debugging ARM processor-based systems. ECT is part of the CoreSight platform, so it can communicate and interact with other CoreSight components. For example, ECT can work with CTI (Communication Trace Interface) components to implement mutual sending and receiving of multiple trigger events.
Secondly, ECT can also interact with external hardware devices. This is typically achieved by communicating with other hardware devices. For example, ECT can communicate with other hardware devices using serial communication interfaces (such as UART or I2C) or parallel communication interfaces (such as SPI or USB). Through these communication interfaces, ECT can receive data from other hardware devices and send data to other hardware devices.
During interaction, ECT can use its error detection and correction capabilities to verify the received data using checksums. If a data error is detected, ECT can automatically correct single-bit errors or report the error to the system or other hardware devices for appropriate corrective action. At the same time, ECT can also utilize its trigger event interaction and synchronization capabilities to work with other hardware devices to achieve more complex event processing and system control.
ECT’s interaction with external hardware devices is primarily achieved through communication and data exchange with other CoreSight components and external hardware devices. It can use various communication interfaces to communicate and exchange data with other devices while ensuring the integrity and reliability of the data.
ETB, Embedded Trace Buffer
CoreSight ETB is a trace receiver that provides on-chip storage for trace data using configurable size RAM.
CoreSight ETB (Embedded Trace Buffer) is a trace receiver that can provide on-chip storage for trace data using configurable size RAM. It is primarily used for debugging and tracing in embedded systems, allowing developers to observe and trace hardware events and data during system operation.
ETB is typically used in conjunction with other CoreSight components, such as the Embedded Trace Macrocell (ETM) and Communication Trace Interface (CTI), to provide comprehensive debugging and tracing solutions.
The main feature of ETB is that it can use configurable size RAM, meaning developers can adjust the storage size of trace data according to their needs. ETB can be configured to store a fixed amount of data or dynamically expand as needed. This configurability allows ETB to adapt to different application scenarios and requirements.
In addition to using RAM to store trace data, ETB also supports multiple trace data formats, such as trace events, trace packets, and trace snapshots. These formats can be flexibly selected and configured to meet different tracing needs and protocols.
Furthermore, ETB supports multiple trace channels, meaning it can simultaneously receive and process trace data from different sources. This makes ETB particularly suitable for complex system architectures where multiple hardware events and data interactions occur simultaneously.
In summary, CoreSight ETB is a powerful trace receiver that uses configurable size RAM to provide on-chip storage for trace data and supports various trace data formats and multiple trace channels. These features make ETB an ideal choice for debugging and tracing in embedded systems.
What Application Scenarios Does CoreSight ETB Have?
•Debugging hardware events and data: ETB can be used to observe and trace hardware events and data, such as interrupts, exceptions, register accesses, etc. Developers can analyze trace data to debug hardware issues and ensure the system executes correctly under specific conditions.•System performance analysis: ETB can be used to analyze the performance characteristics of the system, such as processor utilization, memory access patterns, power consumption, etc. By tracking the system’s operation, developers can identify performance bottlenecks and optimization opportunities to improve overall system performance.•Real-time system monitoring: ETB can be used to monitor the state and behavior of the system in real-time. For instance, developers can set trigger conditions so that when the system meets specific conditions, trace data is automatically saved and the debugger is notified for further analysis. This application can help developers detect and identify abnormal behavior during system operation.•System error diagnosis: When errors or faults occur in the system, ETB can be used to save trace data at the time of the error. This data can be used for subsequent analysis and fault diagnosis, helping developers pinpoint the cause of the error.•Algorithm optimization and verification: ETB can be used to trace the execution process of algorithms, helping developers identify issues and optimize during the early stages of algorithm development. At the same time, ETB can also be used to verify the correctness and performance of algorithms, ensuring they perform well in practical applications.•Embedded system development: ETB is commonly used during the development of embedded systems. During software development and hardware debugging phases, developers can use ETB to trace the execution process of programs, memory accesses, and hardware events to quickly locate and fix issues.
References
•https://www.myir-tech.com/customerService/resource-list.asp?id=510•https://developer.arm.com/documentation/102713/latest/•https://developer.arm.com/Processors/CoreSight%20SDC-600

Due to recent changes in the WeChat public platform’s push rules, many readers have reported not seeing updated articles in time. According to the latest rules, it is recommended to frequently click on “Recommended Reading, Share, Favorite,” etc., to become regular users.
Recommended Reading:
-
Major Adjustment in Huawei’s Product Line: Concerning “Chip Replacement”!
-
Jensen Huang: If I were 30 again, I would never start NVIDIA
-
Unexpectedly, the Kirin 9000s is produced in this mysterious park!