Source: WeChat Official Account 【Osprey Talks Microcontrollers】
Author: Osprey
ID: emOsprey
Through several previous articles (which have been organized into a collection), we have understood many KEIL debugging methods, but how should we use these methods? This article will introduce personal debugging experiences.
This section is divided into the following parts:
6) Precautions (Defects of KEIL Debugging)
First, the virtual serial port. Why use a virtual serial port? What does virtual serial port mean here?
When simulating online, we generally do not need a virtual serial port, because microcontrollers usually have serial ports, so a virtual serial port is unnecessary. But what about in software simulation?
Sometimes we may not have a development board, but the project is urgent and needs to be done in advance. What should we do? KEIL’s software simulation can help you solve most problems. It can help you verify program logic issues and check whether hardware configurations are correct, which is quite a good function. For example, if there are issues with your serial port configuration, enter simulation mode:
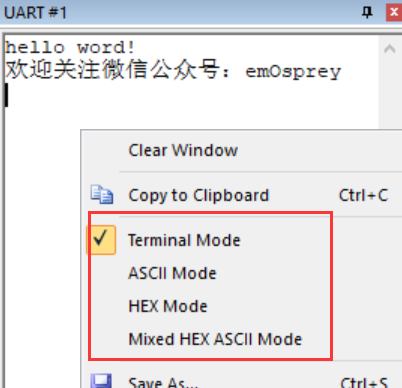
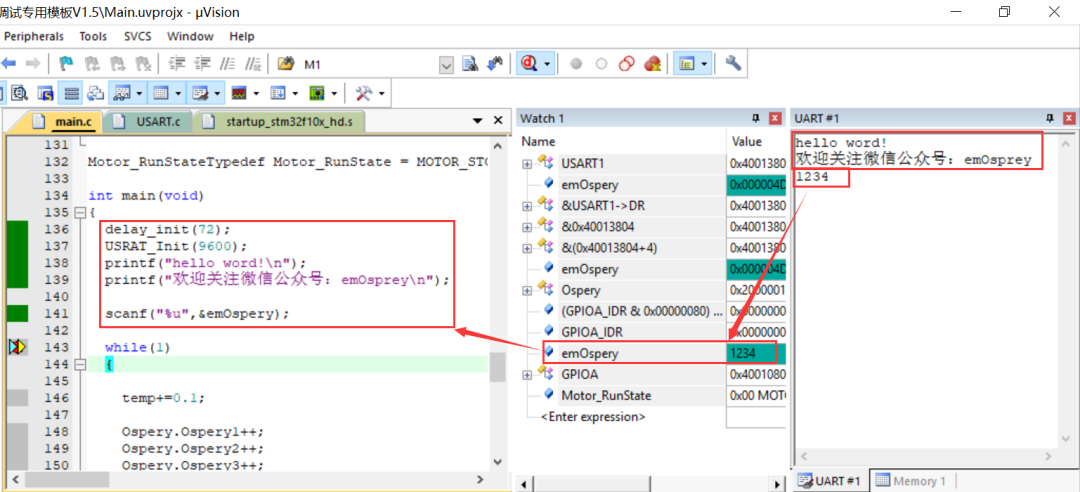 From the simulation image above, you can see that in software simulation mode, you can normally use printf() and scanf() functions, with input and output operations conducted through the serial port window, which is very convenient. However, it is important to note that: even in software simulation, the sending time is related to your set baud rate. That is, after sending a byte, you must wait before you can see the data in the serial port window. This time may not match real time (i.e., 115200 does not necessarily mean sending 115200 bits in 1 second; it could be more or less), but the principle is the same, as it fully simulates the working process of the serial port. You can also choose the display mode here.
Here you can see a comment I wrote earlier:
However, actual tests show that the last character is not lost; I don’t know how it was tested at that time.
There is a question: if you want to send this data to other upper computers, what should you do?
For example, if you want to send serial port data to a virtual oscilloscope for display (in fact, KEIL can also display waveforms, but the function is relatively simple), what should you do?
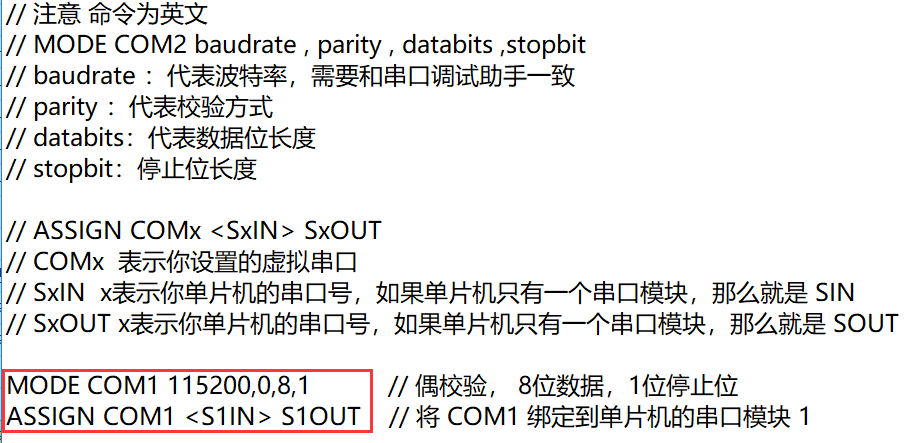
At this time, you can virtualize a COM port and bind the serial port data to the COM:
Enter the content in the red box in the command line to achieve the goal. Of course, you can save it as an .ini file; for specific usage methods, please refer to Osprey’s related notes.
The command reference link above:
http://www.keil.com/support/man/docs/uv4cl/uv4cl_cm_assign.htm?_ga=2.225757210.1084600666.1557148734-475076243.1554469739
After completing the binding, the data from KEIL’s serial port 1 will not only be sent to the KEIL serial port window ([View][Serial Windows]), but will also be sent to the COM1 port (of course, data input is also from COM1).
However, because KEIL has bound COM1, meaning that your KEIL is using COM1, other software cannot open this COM1 port. So how can you view the data from COM1?
At this point, you can use software to virtualize two serial ports. Here, I use vspd.exe software to virtualize COM1 and COM2, and connect COM1 and COM2. This means that data sent from COM1 will be received by COM2, and vice versa. As a result, the serial port data in KEIL can be sent to COM2, because COM2 is not used by any software, so you can use a serial port assistant to open it (other serial port software is similar).
Since this is a virtual serial port, your baud rate parameters are of no use; that is, your serial port configured to 115200 can still be received by your upper computer at 9600.
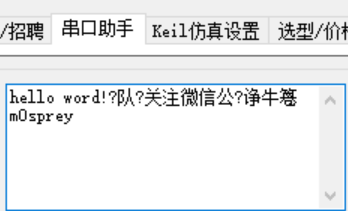
However, you will find that this Chinese support is not as good as that of the KEIL built-in window, but the method of binding the serial port to other COM ports can extend its serial port simulation function, which is quite good.
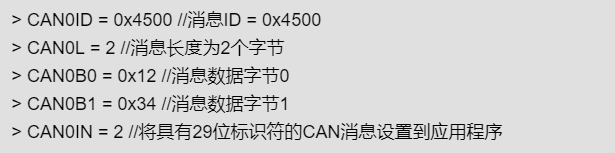
In fact, KEIL can simulate not only serial ports but also I2C and CAN, as shown below:
Those interested can refer to the link:
http://www.keil.com/support/man/docs/uv4/uv4_sm_can_communication.htm
In previous published articles, Osprey once mentioned a term that overturned cognition:
How should breakpoints for microcontroller debugging that have been set for many years be set? | Overturning Cognition
It was also mentioned regarding serial communication:
What is the use of the ini file for KEIL debugging?
By applying the knowledge above, we finally solved the project serial communication problem, which had not occurred after several days of testing.
So how did Osprey solve it? Let’s hear from Osprey.
The phenomenon of this communication error is that a new data frame arrives before the previous data frame has been completely sent, leading to data transmission confusion. This phenomenon is common in multitasking, so Osprey researched it early on:
Semaphore protection by disabling interrupts
Because Osprey knows that resource mutual exclusion is common, only by deeply understanding the principles can you better master it. The mutually exclusive resources in this communication process are two: the resource of the sending buffer array and the serial port. Here, because data is not sent in a queue manner, the buffer array and the serial port are bound together. In other words, once the array contains sending data, sending should start immediately without interruption. Therefore, the array and the serial port can be treated as one resource (it is particularly important to note that the mutex lock must be obtained before assigning values to the array, not before sending through the serial port, because only then can you ensure that the array data you send will not be modified by other programs).
It is clear that this resource is mutually exclusive, so a variable can be used as a lock to access this resource. Before each access, check whether the resource is in use, and if it is, wait. The release of the lock is completed by the sending complete interrupt, meaning that the lock can only be released after all data has been sent, allowing other tasks to use it.
So how can we use the skills mentioned above to find this type of problem?
The key point here is still the lock, because if this lock is used correctly, there should not be a situation where two data frames are mixed up. Therefore, we need to focus on this lock, and how to focus on it?
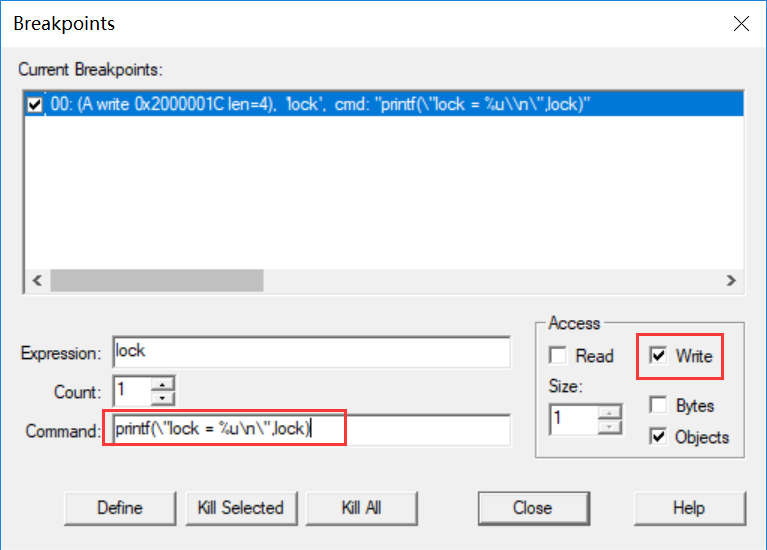
It is to set a write access breakpoint on this variable (lock) using the previous breakpoint window, as follows:
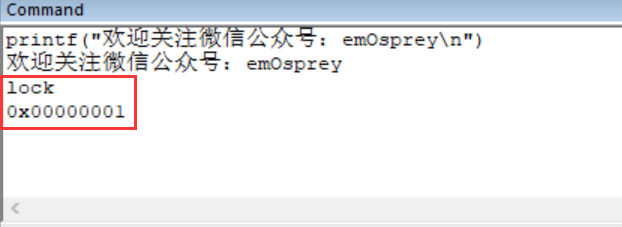
Here, it should be noted that all global variables of the microcontroller can be directly accessed in the command line (in fact, if you set the breakpoint inside a function, you can also get the value of local variables). For example, if you directly enter lock in the command line, the result is as follows:
0x00000001 is the value of this global variable lock.
Returning to the previous topic of the lock. After setting the breakpoint window, you will receive the following message in the Command command window:
The normal data flow of the lock should be like this, 1~0~1~0~1… that is, the lock and release lock alternate. However, Osprey observed that in the code with communication errors, there was a situation of 1~0~0, meaning that after locking once, there was a process of releasing the lock twice. How did this happen?
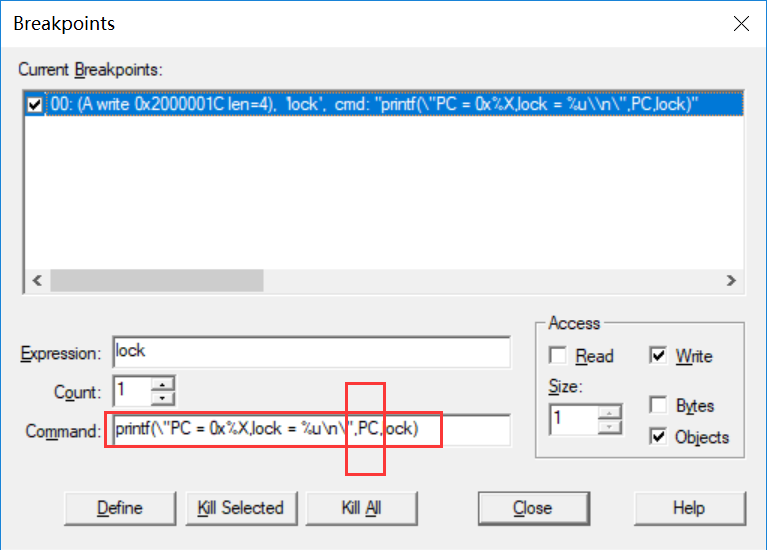
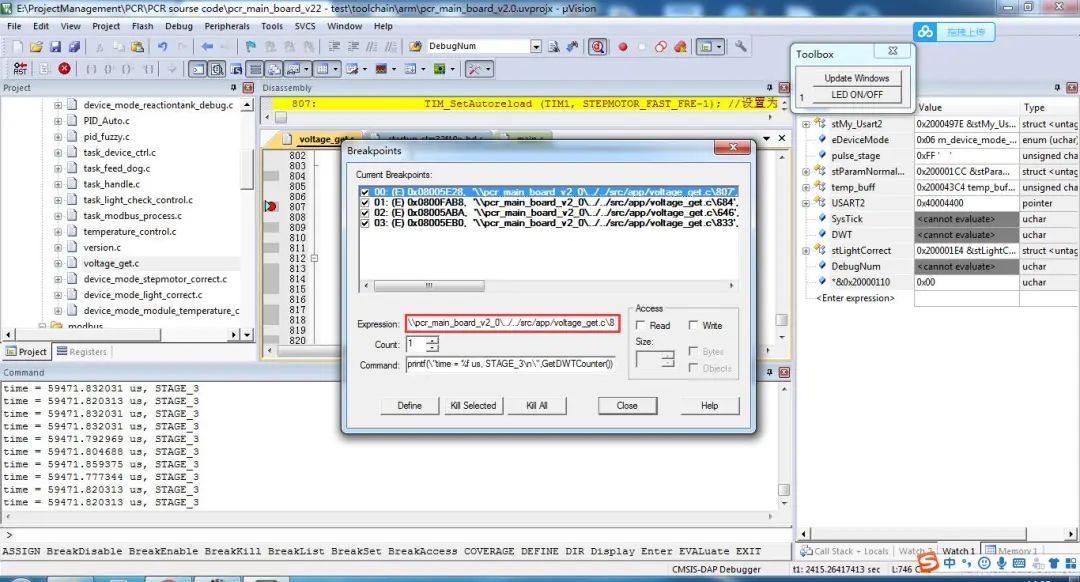
Osprey previously mentioned that the release of the lock is in the serial send complete interrupt (here is the DMA transfer complete interrupt). Could there be another place that zeroed it? To determine this position, debugging information was added (note that if you set a new breakpoint, you need to delete the previous one):
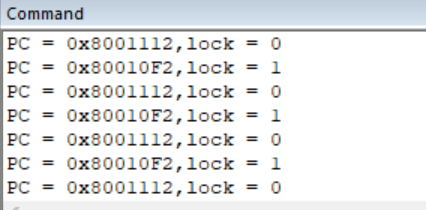
This time, the PC pointer during writing was printed out (note that ST-LINK cannot update this PC data in real-time, but CMSIS-DAP can; a solution has not yet been found). You will find that the zeroing position is the same (there is no actual environment, simulated situation):
You can see that the PC pointer during the zeroing operation is the same, meaning that the release of the lock process indeed has only one occurrence. So why does it appear twice? This must be because DMA transfer was started twice, leading to two entries into the transfer complete interrupt and thus releasing the lock twice.
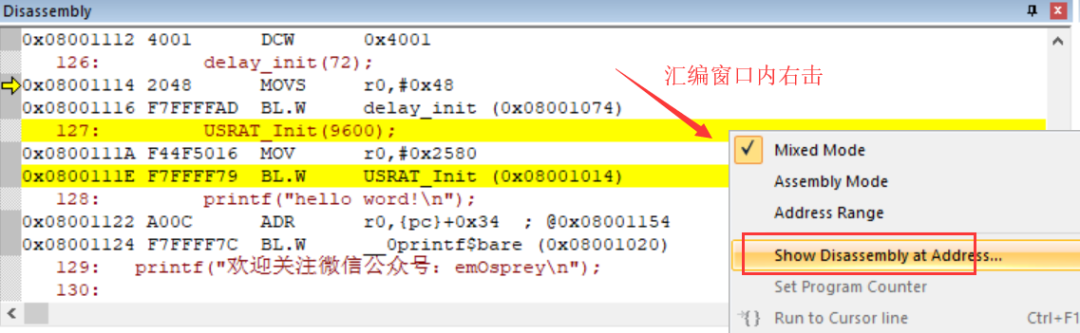
Here, let me mention how to find the corresponding source code location using the PC pointer:
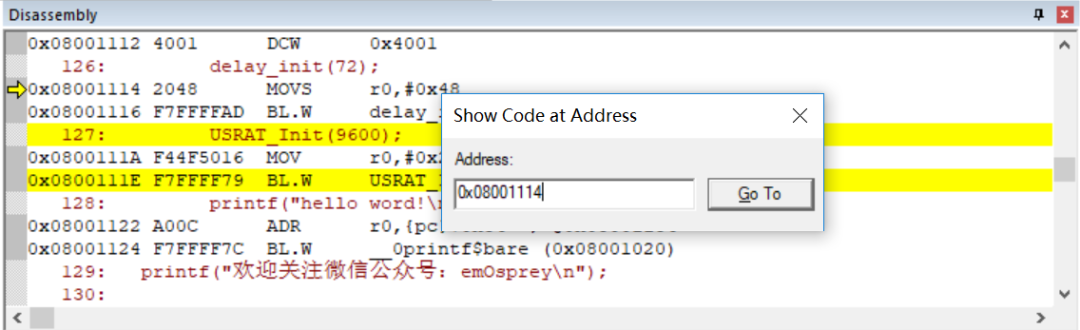
Then enter your PC pointer:
However, theoretically, if the locking operation is normal, there should not be a process of starting DMA transfer twice. Therefore, it can be concluded that there is at least one place where the mutex resource was used directly without locking, which ultimately led to an abnormal situation.
By examining the usage of the mutex resource throughout the system, it was found that there was indeed a place that used the mutex resource but did not lock it (for some reason, only the availability of the lock was judged, but after the judgment was completed, it was not locked). After adding this lock, communication became normal (the actual situation is more complex).
Why is it said to overturn cognition? Because after mastering this skill, many problems can be easily solved. For example, in a project, a variable changed inexplicably. By monitoring each write operation, the sequence of data changes was found to have problems, with unexpected changes occurring, thus leading to a deep investigation and ultimately solving the project issue. It can be said that mastering this skill has helped Osprey solve many previously difficult problems, which is why I highly recommend it!
From the previous content, it can be seen that the printf function can not only print some strings but also retrieve all data running on the microcontroller (including global variables, static variables, peripheral registers, CPU registers that you defined). Once you understand this, you no longer need to add debugging code to your original code and then delete it. Using this method has the following benefits:
1. The printf function in the command line prints data faster than serial port printing, greatly reducing the impact of debugging statements on the original code.
2. You will never forget to delete the code because these statements are not downloaded to the microcontroller; as long as you exit debug mode, they will not affect the program.
3. As long as you use KEIL, you can use this debugging method with any debugger that can set breakpoints (whether ST-LINK, CMSIS-DAP, or J-LINK), which greatly facilitates development.
Speaking of program variables, in fact, we can also define a variable internally in KEIL, that is, use the DEFINE command to define a variable name. This variable does not exist in the microcontroller but only exists in KEIL software, so you don’t have to worry about running out of storage space. However, since the microcontroller and KEIL share the same symbol system, the variable name you define cannot be the same as the global variable name of the microcontroller. As for what you define this variable for, that is entirely up to you.
The previous content mentioned that variables in the program can be printed using the printf function, but in the article published on the official account, it was mentioned that it is not a standard C language function, so it does not support pointers and therefore does not support arrays. How do we output arrays then?
At this time, we actually need to use another article published on the official account regarding the use of ini.
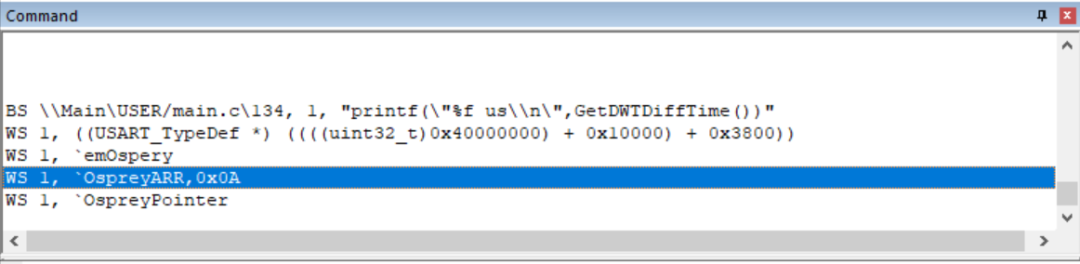
After reading that article, input the following code in the ini file and compile it:
Then, add the following code to your program:
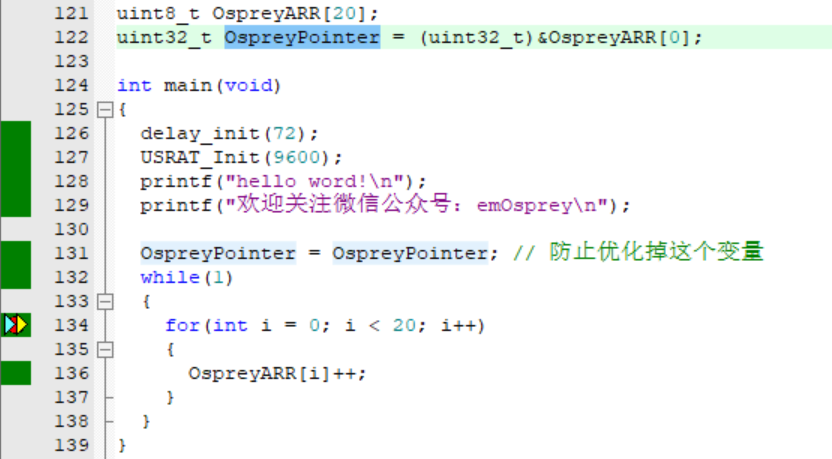
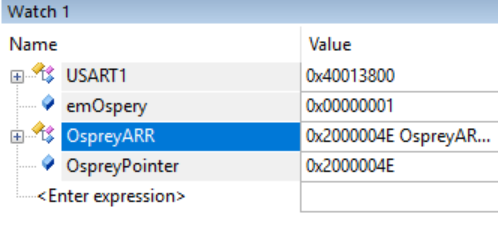
The OspreyARR array here is the data we prepare to output, and the OspreyPointer data is used to save the address of the array. Because pointers are not supported, we can only use another method to achieve the same effect.
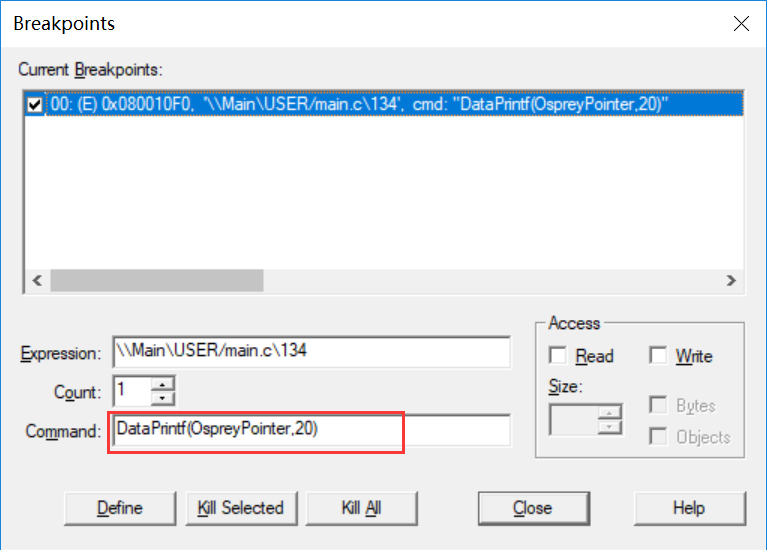
Then set the breakpoint as follows:
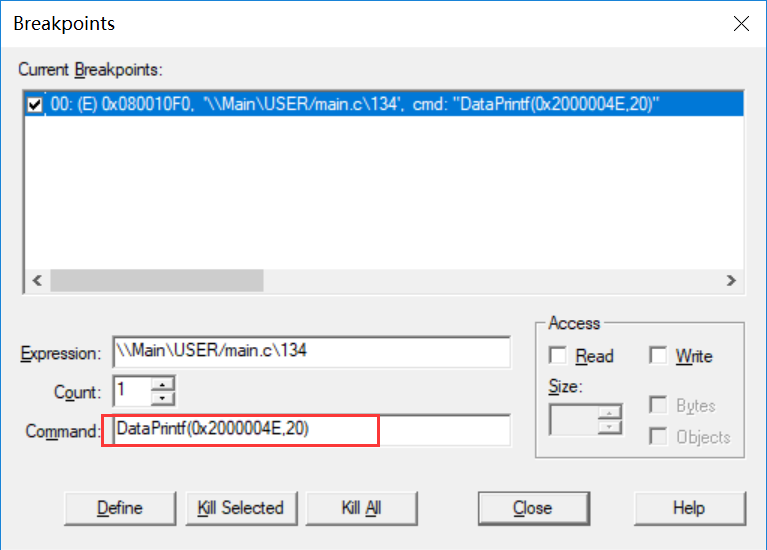
In fact, we can also set it this way:
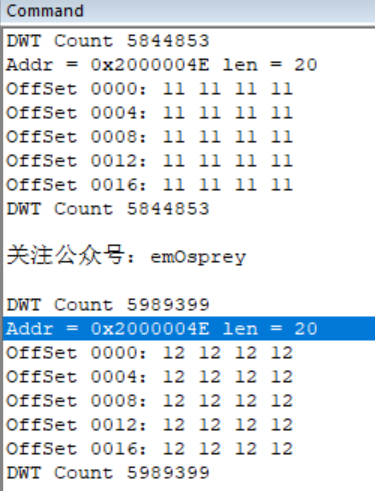
The address 0x2000 004E is the address of the array, but because the address of the array may change after each compilation, we use a variable OspreyPointe to save this address in real-time, so that you can display whatever data you want by just changing the value of this variable without modifying the value in the breakpoint window.
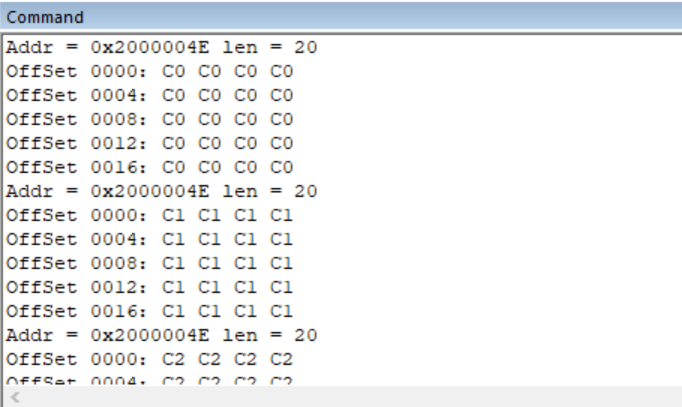
After running at full speed, you can obtain the following results:
You can see that all data in the array is printed out, and the current printed address and length information are also printed out.
What are the benefits of viewing arrays? Communication between the lower computer and the upper computer is very normal, and communication errors are also common. So how do we obtain the data during the communication process in real-time? Previously, we relied on serial port printf, now we rely on the more advanced KEIL printf; it’s that simple, and the serial port assistant is no longer needed.
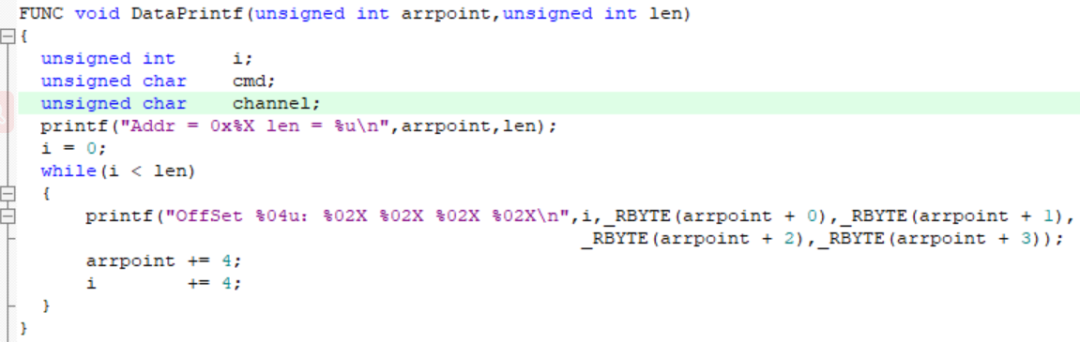
In addition, we can also parse the received or sent data for easier reading. For example, below is a simple parser I made based on my communication protocol at work:
The above introduced how to obtain data, but many times, we not only need data for analysis but also need to obtain the time of the data, as time can be a crucial factor.
So how do we acquire time?
In the past, we generally used SysTick to get time, but when you use the operating system, you will find that this clock is occupied by the operating system. So what should we do? Compete for it? That won’t work, so we have to find alternatives. Who to look for? Ordinary timers? High-level timers? None of these; here Osprey recommends DWT.
1. Many STM32 microcontrollers integrate this module.
2. Its precision is the CPU running cycle; it is driven by the CPU system clock. If your core clock frequency is 72M, then its frequency is also the same, so the precision is very high.
When we use timer interrupts, if we need to see whether your timer interrupt is processed in time (if not processed in time, then the time between two timer interrupts must be different), then DWT is the best choice. Because even if your interrupt is delayed by the execution time of one instruction, it can still detect it. If an extra instruction is executed, the DWT counter will inevitably increase. Therefore, if high time requirements exist, you can directly obtain the counter value.
However, many times, we might not need such precise time, but just the approximate actual time. For convenience, Osprey uses relative time (i.e., the difference between the execution time of the last and this time), so the following function can be used (the above function is used to directly obtain the counter value; 0xE0001004 is the address of the DWT counter. In fact, using DWT requires initialization configuration, but KEIL will configure it automatically when entering Debug mode, so you don’t need to worry about it):
And to match the normal time, the DWT time is converted, and the microcontroller system time is set to 72M, so here it is divided by 72 to convert it to us time. Additionally, to be more precise, floating-point data is used (for the reason behind adding 0xFFFF FFFF, please refer to related articles from the official account; Osprey will not elaborate here).
So how to use it? In fact, I have already demonstrated this method in the video on the official account; now I will detail this method:
First, set a breakpoint you need, then in the Command window, enter your printf() debugging information:
This is it (provided you have included the above content in the ini file).
In fact, simply obtaining time information is not very useful; you can also combine the previous variable and array data display together to output to the command window. This way, you can obtain the execution frequency of this breakpoint and the data of the variables. However, it should be noted that Osprey found that under KEIL V5.14, using the CMSIS-DAP debugger, data can be refreshed in real-time in both the Watch window and the command window. However, when using ST-LINK, the variable values in the command window cannot be refreshed in real-time, meaning this variable remains the same and does not change. But later, when using version V5.25, under CMSIS-DAP debugging, the command window could refresh, while the Watch window could not refresh. Therefore, various situations require fellow practitioners to analyze themselves; one cannot assume that unchanged data is truly unchanging; it may well be a software or debugger issue. However, one thing can be confirmed: when you pause the program, the Watch still refreshes the data, and this data can be trusted.
From the simulation image above, you can see that in software simulation mode, you can normally use printf() and scanf() functions, with input and output operations conducted through the serial port window, which is very convenient. However, it is important to note that: even in software simulation, the sending time is related to your set baud rate. That is, after sending a byte, you must wait before you can see the data in the serial port window. This time may not match real time (i.e., 115200 does not necessarily mean sending 115200 bits in 1 second; it could be more or less), but the principle is the same, as it fully simulates the working process of the serial port. You can also choose the display mode here.
Here you can see a comment I wrote earlier:
However, actual tests show that the last character is not lost; I don’t know how it was tested at that time.
There is a question: if you want to send this data to other upper computers, what should you do?
For example, if you want to send serial port data to a virtual oscilloscope for display (in fact, KEIL can also display waveforms, but the function is relatively simple), what should you do?
At this time, you can virtualize a COM port and bind the serial port data to the COM:
Enter the content in the red box in the command line to achieve the goal. Of course, you can save it as an .ini file; for specific usage methods, please refer to Osprey’s related notes.
The command reference link above:
http://www.keil.com/support/man/docs/uv4cl/uv4cl_cm_assign.htm?_ga=2.225757210.1084600666.1557148734-475076243.1554469739
After completing the binding, the data from KEIL’s serial port 1 will not only be sent to the KEIL serial port window ([View][Serial Windows]), but will also be sent to the COM1 port (of course, data input is also from COM1).
However, because KEIL has bound COM1, meaning that your KEIL is using COM1, other software cannot open this COM1 port. So how can you view the data from COM1?
At this point, you can use software to virtualize two serial ports. Here, I use vspd.exe software to virtualize COM1 and COM2, and connect COM1 and COM2. This means that data sent from COM1 will be received by COM2, and vice versa. As a result, the serial port data in KEIL can be sent to COM2, because COM2 is not used by any software, so you can use a serial port assistant to open it (other serial port software is similar).
Since this is a virtual serial port, your baud rate parameters are of no use; that is, your serial port configured to 115200 can still be received by your upper computer at 9600.
However, you will find that this Chinese support is not as good as that of the KEIL built-in window, but the method of binding the serial port to other COM ports can extend its serial port simulation function, which is quite good.
In fact, KEIL can simulate not only serial ports but also I2C and CAN, as shown below:
Those interested can refer to the link:
http://www.keil.com/support/man/docs/uv4/uv4_sm_can_communication.htm
In previous published articles, Osprey once mentioned a term that overturned cognition:
How should breakpoints for microcontroller debugging that have been set for many years be set? | Overturning Cognition
It was also mentioned regarding serial communication:
What is the use of the ini file for KEIL debugging?
By applying the knowledge above, we finally solved the project serial communication problem, which had not occurred after several days of testing.
So how did Osprey solve it? Let’s hear from Osprey.
The phenomenon of this communication error is that a new data frame arrives before the previous data frame has been completely sent, leading to data transmission confusion. This phenomenon is common in multitasking, so Osprey researched it early on:
Semaphore protection by disabling interrupts
Because Osprey knows that resource mutual exclusion is common, only by deeply understanding the principles can you better master it. The mutually exclusive resources in this communication process are two: the resource of the sending buffer array and the serial port. Here, because data is not sent in a queue manner, the buffer array and the serial port are bound together. In other words, once the array contains sending data, sending should start immediately without interruption. Therefore, the array and the serial port can be treated as one resource (it is particularly important to note that the mutex lock must be obtained before assigning values to the array, not before sending through the serial port, because only then can you ensure that the array data you send will not be modified by other programs).
It is clear that this resource is mutually exclusive, so a variable can be used as a lock to access this resource. Before each access, check whether the resource is in use, and if it is, wait. The release of the lock is completed by the sending complete interrupt, meaning that the lock can only be released after all data has been sent, allowing other tasks to use it.
So how can we use the skills mentioned above to find this type of problem?
The key point here is still the lock, because if this lock is used correctly, there should not be a situation where two data frames are mixed up. Therefore, we need to focus on this lock, and how to focus on it?
It is to set a write access breakpoint on this variable (lock) using the previous breakpoint window, as follows:
Here, it should be noted that all global variables of the microcontroller can be directly accessed in the command line (in fact, if you set the breakpoint inside a function, you can also get the value of local variables). For example, if you directly enter lock in the command line, the result is as follows:
0x00000001 is the value of this global variable lock.
Returning to the previous topic of the lock. After setting the breakpoint window, you will receive the following message in the Command command window:
The normal data flow of the lock should be like this, 1~0~1~0~1… that is, the lock and release lock alternate. However, Osprey observed that in the code with communication errors, there was a situation of 1~0~0, meaning that after locking once, there was a process of releasing the lock twice. How did this happen?
Osprey previously mentioned that the release of the lock is in the serial send complete interrupt (here is the DMA transfer complete interrupt). Could there be another place that zeroed it? To determine this position, debugging information was added (note that if you set a new breakpoint, you need to delete the previous one):
This time, the PC pointer during writing was printed out (note that ST-LINK cannot update this PC data in real-time, but CMSIS-DAP can; a solution has not yet been found). You will find that the zeroing position is the same (there is no actual environment, simulated situation):
You can see that the PC pointer during the zeroing operation is the same, meaning that the release of the lock process indeed has only one occurrence. So why does it appear twice? This must be because DMA transfer was started twice, leading to two entries into the transfer complete interrupt and thus releasing the lock twice.
Here, let me mention how to find the corresponding source code location using the PC pointer:
Then enter your PC pointer:
However, theoretically, if the locking operation is normal, there should not be a process of starting DMA transfer twice. Therefore, it can be concluded that there is at least one place where the mutex resource was used directly without locking, which ultimately led to an abnormal situation.
By examining the usage of the mutex resource throughout the system, it was found that there was indeed a place that used the mutex resource but did not lock it (for some reason, only the availability of the lock was judged, but after the judgment was completed, it was not locked). After adding this lock, communication became normal (the actual situation is more complex).
Why is it said to overturn cognition? Because after mastering this skill, many problems can be easily solved. For example, in a project, a variable changed inexplicably. By monitoring each write operation, the sequence of data changes was found to have problems, with unexpected changes occurring, thus leading to a deep investigation and ultimately solving the project issue. It can be said that mastering this skill has helped Osprey solve many previously difficult problems, which is why I highly recommend it!
From the previous content, it can be seen that the printf function can not only print some strings but also retrieve all data running on the microcontroller (including global variables, static variables, peripheral registers, CPU registers that you defined). Once you understand this, you no longer need to add debugging code to your original code and then delete it. Using this method has the following benefits:
1. The printf function in the command line prints data faster than serial port printing, greatly reducing the impact of debugging statements on the original code.
2. You will never forget to delete the code because these statements are not downloaded to the microcontroller; as long as you exit debug mode, they will not affect the program.
3. As long as you use KEIL, you can use this debugging method with any debugger that can set breakpoints (whether ST-LINK, CMSIS-DAP, or J-LINK), which greatly facilitates development.
Speaking of program variables, in fact, we can also define a variable internally in KEIL, that is, use the DEFINE command to define a variable name. This variable does not exist in the microcontroller but only exists in KEIL software, so you don’t have to worry about running out of storage space. However, since the microcontroller and KEIL share the same symbol system, the variable name you define cannot be the same as the global variable name of the microcontroller. As for what you define this variable for, that is entirely up to you.
The previous content mentioned that variables in the program can be printed using the printf function, but in the article published on the official account, it was mentioned that it is not a standard C language function, so it does not support pointers and therefore does not support arrays. How do we output arrays then?
At this time, we actually need to use another article published on the official account regarding the use of ini.
After reading that article, input the following code in the ini file and compile it:
Then, add the following code to your program:
The OspreyARR array here is the data we prepare to output, and the OspreyPointer data is used to save the address of the array. Because pointers are not supported, we can only use another method to achieve the same effect.
Then set the breakpoint as follows:
In fact, we can also set it this way:
The address 0x2000 004E is the address of the array, but because the address of the array may change after each compilation, we use a variable OspreyPointe to save this address in real-time, so that you can display whatever data you want by just changing the value of this variable without modifying the value in the breakpoint window.
After running at full speed, you can obtain the following results:
You can see that all data in the array is printed out, and the current printed address and length information are also printed out.
What are the benefits of viewing arrays? Communication between the lower computer and the upper computer is very normal, and communication errors are also common. So how do we obtain the data during the communication process in real-time? Previously, we relied on serial port printf, now we rely on the more advanced KEIL printf; it’s that simple, and the serial port assistant is no longer needed.
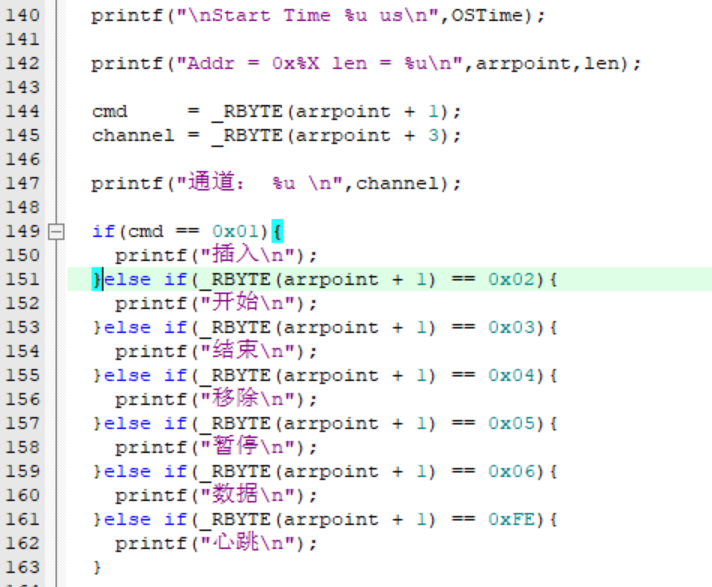
In addition, we can also parse the received or sent data for easier reading. For example, below is a simple parser I made based on my communication protocol at work:
The above introduced how to obtain data, but many times, we not only need data for analysis but also need to obtain the time of the data, as time can be a crucial factor.
So how do we acquire time?
In the past, we generally used SysTick to get time, but when you use the operating system, you will find that this clock is occupied by the operating system. So what should we do? Compete for it? That won’t work, so we have to find alternatives. Who to look for? Ordinary timers? High-level timers? None of these; here Osprey recommends DWT.
1. Many STM32 microcontrollers integrate this module.
2. Its precision is the CPU running cycle; it is driven by the CPU system clock. If your core clock frequency is 72M, then its frequency is also the same, so the precision is very high.
When we use timer interrupts, if we need to see whether your timer interrupt is processed in time (if not processed in time, then the time between two timer interrupts must be different), then DWT is the best choice. Because even if your interrupt is delayed by the execution time of one instruction, it can still detect it. If an extra instruction is executed, the DWT counter will inevitably increase. Therefore, if high time requirements exist, you can directly obtain the counter value.
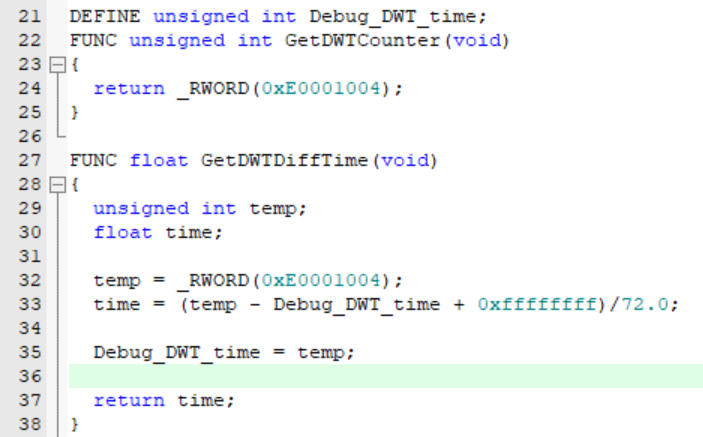
However, many times, we might not need such precise time, but just the approximate actual time. For convenience, Osprey uses relative time (i.e., the difference between the execution time of the last and this time), so the following function can be used (the above function is used to directly obtain the counter value; 0xE0001004 is the address of the DWT counter. In fact, using DWT requires initialization configuration, but KEIL will configure it automatically when entering Debug mode, so you don’t need to worry about it):
And to match the normal time, the DWT time is converted, and the microcontroller system time is set to 72M, so here it is divided by 72 to convert it to us time. Additionally, to be more precise, floating-point data is used (for the reason behind adding 0xFFFF FFFF, please refer to related articles from the official account; Osprey will not elaborate here).
So how to use it? In fact, I have already demonstrated this method in the video on the official account; now I will detail this method:
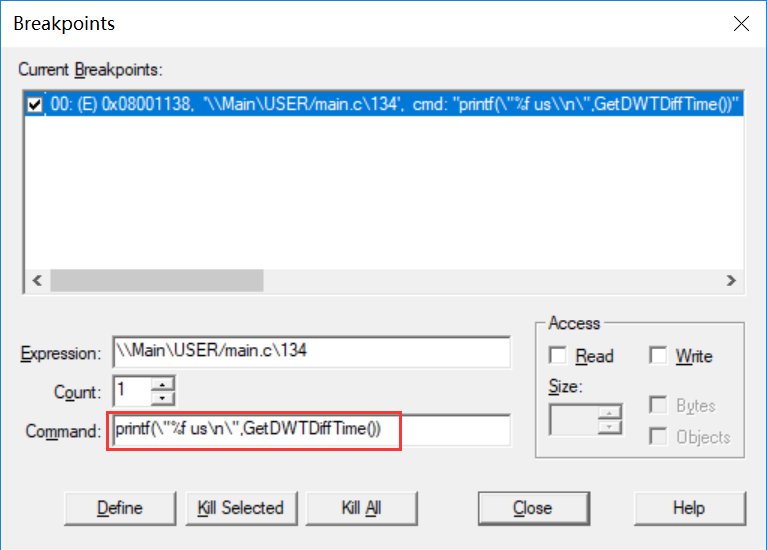
First, set a breakpoint you need, then in the Command window, enter your printf() debugging information:
This is it (provided you have included the above content in the ini file).
In fact, simply obtaining time information is not very useful; you can also combine the previous variable and array data display together to output to the command window. This way, you can obtain the execution frequency of this breakpoint and the data of the variables. However, it should be noted that Osprey found that under KEIL V5.14, using the CMSIS-DAP debugger, data can be refreshed in real-time in both the Watch window and the command window. However, when using ST-LINK, the variable values in the command window cannot be refreshed in real-time, meaning this variable remains the same and does not change. But later, when using version V5.25, under CMSIS-DAP debugging, the command window could refresh, while the Watch window could not refresh. Therefore, various situations require fellow practitioners to analyze themselves; one cannot assume that unchanged data is truly unchanging; it may well be a software or debugger issue. However, one thing can be confirmed: when you pause the program, the Watch still refreshes the data, and this data can be trusted.
 (There is also an article on how to accurately measure code execution time under KEIL.)
Do you envy others’ upper computer programs that can print LOG data in real-time? Do you dream that your embedded program can achieve this one day? In fact, it really can.
In embedded development, due to the limitations of microcontroller resources, data is often printed using the serial port, and more advanced tools like J-Scope are used. However, using the serial port has many limitations:
1. It is necessary to implement a serial port driver program, which occupies the limited serial port resources.
2. The serial port speed is relatively slow.
3. A similar upper computer like a serial port assistant is required.
4. After receiving data, you need to save this data yourself.
5. You cannot set breakpoints, which greatly limits debugging.
6. Debugging code must be deleted after debugging; if forgotten, it will affect performance.
However, using the built-in LOG printing function of KEIL eliminates these issues. Its output speed is the speed of the debugger; the faster the debugger, the faster your printing (but don’t print too much data; targeted printing is necessary, which will be explained later). The speed of the debugger is generally at the M level, which is sufficient for most situations.
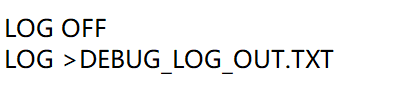
Now let’s see how to use it. It is actually very simple, just a few commands in your ini file:
Thus, all content below this command will be saved in DEBUG_LOG_OUT.txt (so if you don’t want to save other content of the ini file in the LOG, just place this command at the end of the ini file).
Now let’s explain these commands. LOG OFF indicates that the LOG file is closed; even if you haven’t opened a LOG file, executing this command will not cause an error. This command mainly prevents a LOG file from being opened repeatedly, and adding this command will avoid this issue.
The second command saves the data from the Command window to DEBUG_LOG_OUT.txt. Note that there is a >, and the file name DEBUG_LOG_OUT can be whatever you like; just use this during testing. Once you are sure you know how to do it, you can name it whatever you want; if issues arise, you can compare it later.
Let me add that relative paths are used here, meaning the path is under your project file. If you want to go up one level, you can use ../ to indicate outputting the LOG file in a folder under this project.
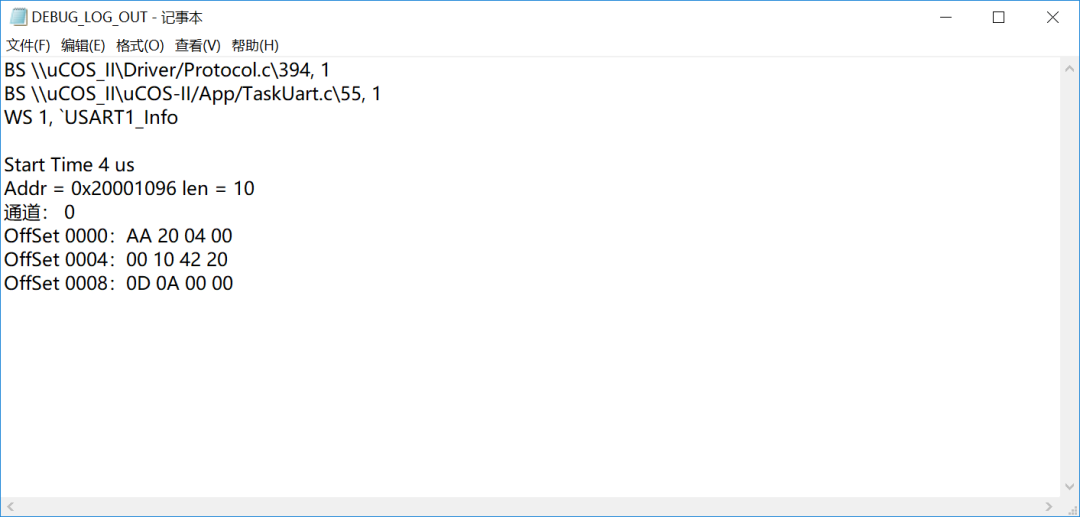
Once you exit debug mode, KEIL will automatically save Command data to the file (which means you won’t see this debugging data before this point). Now let’s take a look at my debugging LOG:
After setting it once, LOG printing will no longer require your attention; even if there is a communication error with the debugger, it will still save the previously output data.
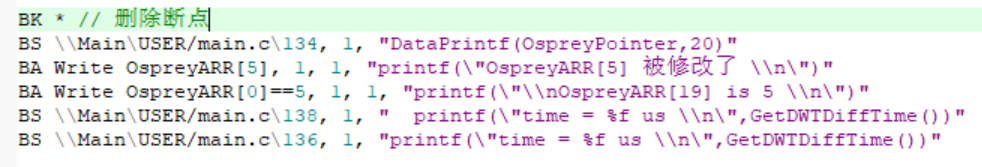
At this point, you should understand how important the ini file is; all your debugging commands can be saved in it and automatically executed after entering debug mode. For example, if you have a complex breakpoint that you don’t want to set each time, you can copy this command from the command window to the ini file after setting it once, like this:
Thus, each time you enter debug mode, those breakpoints will be set automatically, and you won’t have to worry about it. Moreover, if modifications are needed, simply edit it in the editor and recompile, and it will take effect immediately without needing to set it from the breakpoint window.
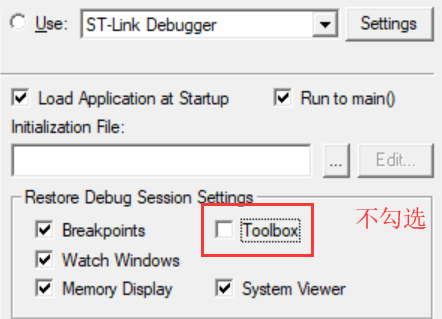
Additionally, there is a command to delete all breakpoints. This is to prevent conflicts with previously set breakpoints, so all are deleted at once (in fact, it is possible to delete a specific breakpoint, but you need the breakpoint number, which may vary each time; hence, deleting all is more convenient). To better coordinate with these functions, you can uncheck Breakpoints so that it won’t save the settings about breakpoints, and to ensure that the Toolbox displays automatically every time after being closed, you can also uncheck Toolbox.
Let me also mention that KEIL supports saving a block of memory data as a file; this command is SAVE. If interested, you can check the official website for more information.
The above mentioned many advantages of KEIL command debugging; now let’s talk about its disadvantages:
1. KEIL command debugging does not support pointers; this has been emphasized multiple times. To implement pointer functionality, you can only use indirect methods.
2. It causes a certain impact on program operation (in fact, this is not KEIL’s fault, but a problem with the debugging system itself).
As mentioned before, the debugger can be seen as a third-party monitor. Although it has almost no invasiveness (in fact, it still affects the CPU), it will still steal CPU clock cycles. Moreover, when executing breakpoints, although the functions defined by the ini file are executed by KEIL, executing these functions still takes time. This time is taken by pausing the CPU to execute these codes; you can see this through the DWT counter, as only when the CPU executes DWT will it count. However, you will find that the DWT does not count when executing these codes (by obtaining DWT counts before and after KEIL functions, you can find that the count value does not change):
This means that the CPU and KEIL are using the system clock alternately. Generally, due to the fast execution speed of KEIL, the problem is not noticeable. However, issues can arise during interrupts.
The situation is this: when driving a stepper motor, Osprey used this debugging method to print the time of each entry into the timer interrupt and found that even when using the highest precision (CPU running clock), the time of each entry into the interrupt seemed fixed, but the stepper motor still exhibited missed steps. This means that the internal time of the system seems to be the same each time it enters the interrupt, but in reality, time has been lost (understand this sentence well). This time loss occurs during the execution of these commands, and once these output commands are deleted, the motor no longer misses steps.
This is a relatively significant flaw, but under normal circumstances, it will not cause too much issue, as generally, stealing a bit of CPU time will not have a large impact on the entire system, provided that you do not steal too much.
(This article was previously available for those who followed it, but I estimate that some people did not know, so I will publish it directly on the official account now.)
How should the CPU usage of threads be calculated?
You will thank yourself for writing exception handling code after a long time.
The ultimate serial port receiving method, extreme efficiency.
Why must you master KEIL debugging methods?
The evolution of delay functions (collection).
Pointers, are they really that difficult? | Analyzing the process and significance of pointers (Part 1).
How to write a robust and efficient serial port receiving program?
Things about KEIL debugging: window display—variables (Part 2).
How should breakpoints for microcontroller debugging that have been set for many years be set? | Overturning Cognition.
(There is also an article on how to accurately measure code execution time under KEIL.)
Do you envy others’ upper computer programs that can print LOG data in real-time? Do you dream that your embedded program can achieve this one day? In fact, it really can.
In embedded development, due to the limitations of microcontroller resources, data is often printed using the serial port, and more advanced tools like J-Scope are used. However, using the serial port has many limitations:
1. It is necessary to implement a serial port driver program, which occupies the limited serial port resources.
2. The serial port speed is relatively slow.
3. A similar upper computer like a serial port assistant is required.
4. After receiving data, you need to save this data yourself.
5. You cannot set breakpoints, which greatly limits debugging.
6. Debugging code must be deleted after debugging; if forgotten, it will affect performance.
However, using the built-in LOG printing function of KEIL eliminates these issues. Its output speed is the speed of the debugger; the faster the debugger, the faster your printing (but don’t print too much data; targeted printing is necessary, which will be explained later). The speed of the debugger is generally at the M level, which is sufficient for most situations.
Now let’s see how to use it. It is actually very simple, just a few commands in your ini file:
Thus, all content below this command will be saved in DEBUG_LOG_OUT.txt (so if you don’t want to save other content of the ini file in the LOG, just place this command at the end of the ini file).
Now let’s explain these commands. LOG OFF indicates that the LOG file is closed; even if you haven’t opened a LOG file, executing this command will not cause an error. This command mainly prevents a LOG file from being opened repeatedly, and adding this command will avoid this issue.
The second command saves the data from the Command window to DEBUG_LOG_OUT.txt. Note that there is a >, and the file name DEBUG_LOG_OUT can be whatever you like; just use this during testing. Once you are sure you know how to do it, you can name it whatever you want; if issues arise, you can compare it later.
Let me add that relative paths are used here, meaning the path is under your project file. If you want to go up one level, you can use ../ to indicate outputting the LOG file in a folder under this project.
Once you exit debug mode, KEIL will automatically save Command data to the file (which means you won’t see this debugging data before this point). Now let’s take a look at my debugging LOG:
After setting it once, LOG printing will no longer require your attention; even if there is a communication error with the debugger, it will still save the previously output data.
At this point, you should understand how important the ini file is; all your debugging commands can be saved in it and automatically executed after entering debug mode. For example, if you have a complex breakpoint that you don’t want to set each time, you can copy this command from the command window to the ini file after setting it once, like this:
Thus, each time you enter debug mode, those breakpoints will be set automatically, and you won’t have to worry about it. Moreover, if modifications are needed, simply edit it in the editor and recompile, and it will take effect immediately without needing to set it from the breakpoint window.
Additionally, there is a command to delete all breakpoints. This is to prevent conflicts with previously set breakpoints, so all are deleted at once (in fact, it is possible to delete a specific breakpoint, but you need the breakpoint number, which may vary each time; hence, deleting all is more convenient). To better coordinate with these functions, you can uncheck Breakpoints so that it won’t save the settings about breakpoints, and to ensure that the Toolbox displays automatically every time after being closed, you can also uncheck Toolbox.
Let me also mention that KEIL supports saving a block of memory data as a file; this command is SAVE. If interested, you can check the official website for more information.
The above mentioned many advantages of KEIL command debugging; now let’s talk about its disadvantages:
1. KEIL command debugging does not support pointers; this has been emphasized multiple times. To implement pointer functionality, you can only use indirect methods.
2. It causes a certain impact on program operation (in fact, this is not KEIL’s fault, but a problem with the debugging system itself).
As mentioned before, the debugger can be seen as a third-party monitor. Although it has almost no invasiveness (in fact, it still affects the CPU), it will still steal CPU clock cycles. Moreover, when executing breakpoints, although the functions defined by the ini file are executed by KEIL, executing these functions still takes time. This time is taken by pausing the CPU to execute these codes; you can see this through the DWT counter, as only when the CPU executes DWT will it count. However, you will find that the DWT does not count when executing these codes (by obtaining DWT counts before and after KEIL functions, you can find that the count value does not change):
This means that the CPU and KEIL are using the system clock alternately. Generally, due to the fast execution speed of KEIL, the problem is not noticeable. However, issues can arise during interrupts.
The situation is this: when driving a stepper motor, Osprey used this debugging method to print the time of each entry into the timer interrupt and found that even when using the highest precision (CPU running clock), the time of each entry into the interrupt seemed fixed, but the stepper motor still exhibited missed steps. This means that the internal time of the system seems to be the same each time it enters the interrupt, but in reality, time has been lost (understand this sentence well). This time loss occurs during the execution of these commands, and once these output commands are deleted, the motor no longer misses steps.
This is a relatively significant flaw, but under normal circumstances, it will not cause too much issue, as generally, stealing a bit of CPU time will not have a large impact on the entire system, provided that you do not steal too much.
(This article was previously available for those who followed it, but I estimate that some people did not know, so I will publish it directly on the official account now.)
How should the CPU usage of threads be calculated?
You will thank yourself for writing exception handling code after a long time.
The ultimate serial port receiving method, extreme efficiency.
Why must you master KEIL debugging methods?
The evolution of delay functions (collection).
Pointers, are they really that difficult? | Analyzing the process and significance of pointers (Part 1).
How to write a robust and efficient serial port receiving program?
Things about KEIL debugging: window display—variables (Part 2).
How should breakpoints for microcontroller debugging that have been set for many years be set? | Overturning Cognition.
-THE END-
If this was helpful to you, remember to share it!
WeChat Official Account: Osprey Talks Microcontrollers
New content every Monday on microcontroller knowledge

Long press to go to the WeChat account included in the picture to follow.
Osprey, a bestselling author who is delayed by embedded systems.
Personal WeChat: EmbeddedOsprey

Long press to open the other person’s business card to follow.