Introduction: Receiving an alert in the middle of the night, and upon checking, it’s the familiar 502 Bad Gateway? Don’t panic, this isn’t the server’s death sentence, but rather a distress signal sent to you! Today, we will translate this “Morse code” into plain language, along with a checklist that you can use immediately, helping you go from “confused” to “quickly pinpointing the issue”.
1. Introduction: Status Codes are the Server’s Last ‘Words’
Remember one principle:Errors starting with 4 are likely the fault of the request (frontend/caller); errors starting with 5 are definitely the backend’s fault (operations/backend). Our focus in operations is to tackle 5xx errors.
2. Client Errors (4xx): Incorrect Request, Try Again!
This type of error is usually the caller’s problem, but operations often need to assist in troubleshooting.
- 400 Bad Request (Invalid Request)
Jargon Translation: “What you sent, I can’t understand!”
Troubleshooting Checklist:
-
Check the Request Headers: Are
<span><span>Content-Type</span></span>and<span><span>Content-Length</span></span>correct? -
Check the Request Body: Is the JSON format valid, and are the field types correct?
-
Packet Capture Tool: Execute
<span><span>tcpdump -i any -s 0 -w client.pcap</span></span>on the client machine to capture packets, and analyze the raw request with Wireshark.
- 401 Unauthorized (Unauthorized)
Jargon Translation: “Who are you? Do you have a token?”
Troubleshooting Checklist:
-
Check if the Token has expired.
-
Check if the Token’s signature is correct.
-
Check if you forgot to add
<span><span>Authorization: Bearer <token></span></span>in the request header.
- 403 Forbidden (Access Denied)
Jargon Translation: “I know who you are, but you don’t have permission to enter this door!”
Troubleshooting Checklist:
-
Contact the developer to confirm if the user role permissions are configured correctly.
-
Check if the server-side firewall or security group rules are blocking the client’s IP.
- 404 Not Found (Resource Not Found)
Jargon Translation: “The item you requested is not here, did you write the address wrong?”
Troubleshooting Checklist:
-
Verify the Request URL Path: Not a single letter can be wrong.
-
Check if the backend program’s routing (Spring Boot, Django, etc.) is defined correctly.
-
Check the Nginx configuration: Is the
<span><span>location</span></span>correctly proxying to the backend service?
- 429 Too Many Requests (Too Many Requests)
Jargon Translation: “Slow down! If you crash me, everyone is done!”
Troubleshooting Checklist:
-
Check if this is a normal business peak, consider scaling up.
-
Check if there is a code bug (like an infinite loop) or malicious crawler attack.
-
Adjust the rate limiting strategy: For example, Nginx’s
<span><span>limit_req_zone</span></span>configuration.
3. Server Errors (5xx): The Blame is on Us, Operations!
This is our main battlefield, every 5xx is a call to arms.
-
500 Internal Server Error (Internal Server Error)
Jargon Translation: “I (the application) crashed, but I won’t tell you why!”
Troubleshooting Checklist (Golden Three Steps):
-
Log into the server immediately: Tail the application logs:
tail -500f /your/app/log/error.log.
Search for keywords: <span><span>Exception</span></span>, <span><span>Error</span></span>, <span><span>at</span></span> (stack trace).
90% of the problems are answered in the logs: null pointer, database connection failure, third-party API call exceptions.
-
502 Bad Gateway (Bad Gateway)
Jargon Translation: “I (Nginx) can’t reach the little brother (Tomcat) behind me!”
Troubleshooting Checklist (Classic Four Steps for Operations):
-
Is the little brother still alive?
<span><span>ps aux | grep java</span></span>(or php-fpm) -
Is the little brother listening on the port?
<span><span>netstat -tlnp | grep :8080</span></span> -
<span>Is the little brother healthy?</span><span><span>curl http://localhost:8080/health</span></span>(or directly curl the business interface) -
Is the resource exhausted?
<span><span>free -h</span></span>to check memory,<span><span>df -h</span></span>to check disk,<span><span>top</span></span>to check CPU.
-
503 Service Unavailable (Service Unavailable)
Jargon Translation: “Don’t come, don’t come, the load is too high, let me rest for a while!”
Troubleshooting Checklist:
-
Check the system load:
<span><span>uptime</span></span>to check the load index,<span><span>top</span></span>to see which process is consuming the most CPU/memory. -
Check the number of connections:
<span><span>netstat -an | wc -l</span></span>. -
Check if this is a temporary state during service deployment or restart.
-
504 Gateway Timeout (Gateway Timeout)
Jargon Translation: “I (Nginx) waited too long for the little brother (Tomcat) to respond!”
Troubleshooting Checklist:
-
The essence of the problem is a performance bottleneck. Check for slow database queries:
<span><span>show processlist;</span></span>. -
Check if you are calling slow external APIs or middleware (like Redis, MQ).
-
Temporary Adjustment: Appropriately increase the Nginx
<span><span>proxy_read_timeout</span></span>configuration value. -
Root Cause Analysis: Use APM tools (like Arthas, SkyWalking) to locate slow methods in the link.
Operational Toolkit: One-Click Troubleshooting Script
#!/bin/bash
# Set color output
RED='\033[0;31m'
GREEN='\033[0;32m'
YELLOW='\033[1;33m'
BLUE='\033[0;34m'
PURPLE='\033[0;35m'
CYAN='\033[0;36m'
NC='\033[0m' # No Color
# Print separator line
print_separator() {
    echo -e "${CYAN}=======================================================${NC}"
}
# Print title
print_header() {
    echo -e "${PURPLE}$1${NC}"
}
# Get CPU usage
get_cpu_usage() {
    local cpu_usage=$(top -bn1 | grep "Cpu(s)" | sed "s/.*, *\([0-9.]*\)%* id.*/\1/" | awk '{print 100 - $1}')
    echo -e "${GREEN}CPU Usage: ${YELLOW}${cpu_usage}%${NC}"
}
# Get memory usage
get_memory_usage() {
    local total_mem=$(free -h | awk '/Mem:/ {print $2}')
    local used_mem=$(free -h | awk '/Mem:/ {print $3}')
    local mem_percent=$(free | awk '/Mem:/ {printf("%.2f"), $3/$2 * 100}')
    echo -e "${GREEN}Memory Usage: ${YELLOW}${used_mem}/${total_mem} (${mem_percent}%)${NC}"
}
# Get disk usage
get_disk_usage() {
    echo -e "${GREEN}Disk Usage:${NC}"
    df -h | grep -E '^/dev/' | awk '{printf "  %s: %s/%s (%s)\n", $6, $3, $2, $5}'
}
# Get network usage
get_network_usage() {
    echo -e "${GREEN}Network Interface Traffic:${NC}"
    local interfaces=$(ip -o link show | awk -F': ' '{print $2}' | grep -v "lo")
    for intf in $interfaces; do
        local rx_bytes=$(cat /sys/class/net/$intf/statistics/rx_bytes 2>/dev/null)
        local tx_bytes=$(cat /sys/class/net/$intf/statistics/tx_bytes 2>/dev/null)
        if [ -n "$rx_bytes" ] && [ -n "$tx_bytes" ]; then
            local rx_mb=$(echo "scale=2; $rx_bytes / 1024 / 1024" | bc)
            local tx_mb=$(echo "scale=2; $tx_bytes / 1024 / 1024" | bc)
            echo -e "  ${intf}: RX=${YELLOW}${rx_mb}MB${NC}, TX=${YELLOW}${tx_mb}MB${NC}"
        fi
    done
}
# Get disk IO
get_disk_io() {
    echo -e "${GREEN}Disk IO:${NC}"
    iostat -d 1 1 | grep -E '^[sv]d' | awk '{printf "  %s: Read %s KB/s, Write %s KB/s\n", $1, $3, $4}'
}
# Get top three CPU consuming processes
get_top_cpu_processes() {
    echo -e "${GREEN}Top Three CPU Consuming Processes:${NC}"
    ps -eo pid,user,%cpu,comm --sort=-%cpu | head -n 4 | awk 'NR>1 {printf "  %s (User: %s, CPU: %s%%)\n", $4, $2, $3}'
}
# Get top three memory consuming processes
get_top_memory_processes() {
    echo -e "${GREEN}Top Three Memory Consuming Processes:${NC}"
    ps -eo pid,user,%mem,comm --sort=-%mem | head -n 4 | awk 'NR>1 {printf "  %s (User: %s, Memory: %s%%)\n", $4, $2, $3}'
}
# Main function
main() {
    echo
    print_separator
    print_header "System Resource Usage Analysis"
    print_separator
    # CPU usage
    print_header "CPU Information"
    get_cpu_usage
    # Memory usage
    print_header "Memory Information"
    get_memory_usage
    # Disk usage
    print_header "Disk Information"
    get_disk_usage
    # Network usage
    print_header "Network Information"
    get_network_usage
    # Disk IO
    print_header "Disk IO Information"
    get_disk_io
    # Process ranking
    print_header "Resource Usage Ranking"
    get_top_cpu_processes
    get_top_memory_processes
    print_separator
    echo -e "${GREEN}Check Complete!${NC}"
    echo
}
# Check if necessary commands exist
check_requirements() {
    local missing=()
    for cmd in top free df ps iostat bc; do
        if ! command -v $cmd >/dev/null; then
            missing+=($cmd)
        fi
    done
    if [ ${#missing[@]} -ne 0 ]; then
        echo -e "${RED}Error: Missing necessary commands: ${missing[*]}${NC}"
        echo "Please install the missing packages and try again"
        exit 1
    fi
}
# Execute check and run main function
check_requirements
main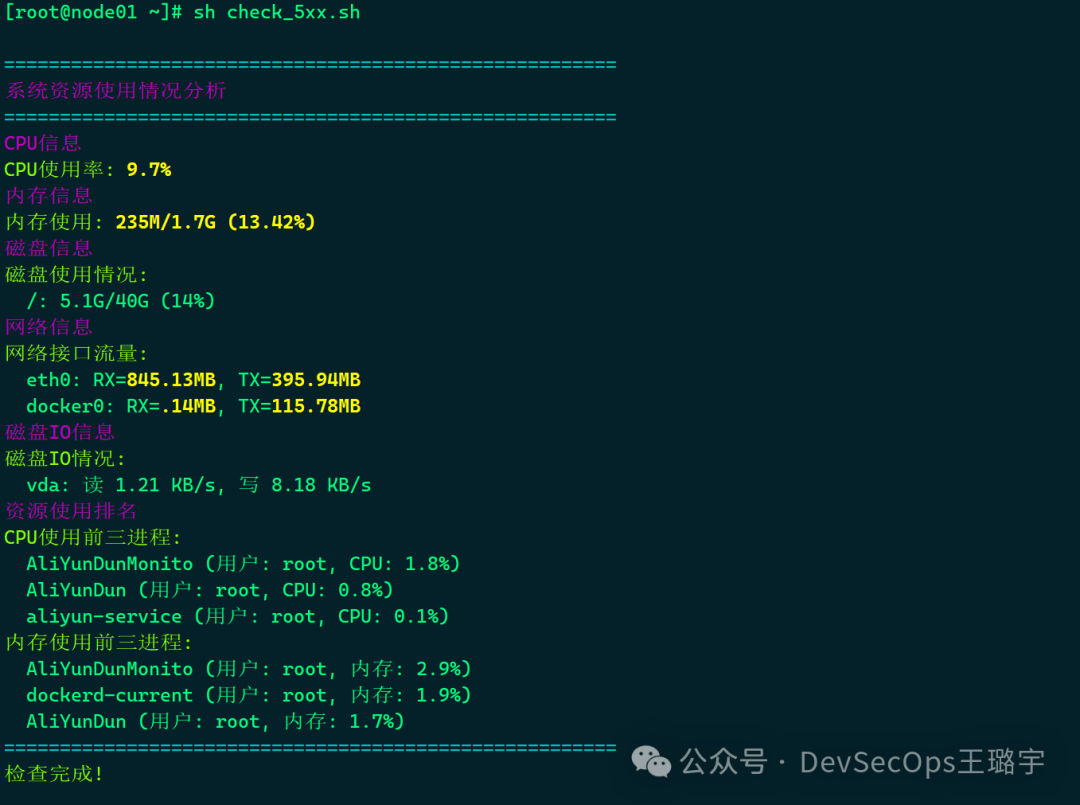
Conclusion:
Next time you see a status code, don’t just resort to the restart method. Remember this process:
-
Identify the issue by the code: 4xx for collaboration, 5xx for direct attack.
-
Logs are king:
<span><span>tail -f</span></span>is your best friend. -
Layered Approach: Drill down from process → network → resources → logs.
Save this guide and share it with your operational comrades, next time troubleshooting efficiency will double, and leaving work on time won’t be a dream!
For previous content recommendations, please click:
| [Emergency Manual] Encountering DDoS Attack? Don’t Panic! From Traffic Analysis to Precise Blocking, A Step-by-Step Guide to Break Out of the SiegeInternal Network Lateral Movement Attacks and Defense: A Blood and Tears Review of a Simulated Penetration TestAliyun OSS Configuration Error Leading to Data Leakage! How to Avoid Becoming the Next ‘Leaker’?Encountering Hacker Backdoors? A Step-by-Step Guide to Completely Rooting Out Hidden WebshellsTCP Connection Count Exploding, Is it an Attack or a Bug?K8s Cluster Node Frequent Restarts, The Root Cause is a Small Configuration!Don’t Let the Database ‘Run Naked’! Redis Unauthorized Access Vulnerability Practical Repair GuideWebsite Lagging Like a PPT? Ten Minutes to Locate Linux Performance Bottlenecks (CPU/Memory/IO)CentOS 7 Server CPU Suddenly Spiking to 100%? Ten Minutes to Accurately Locate the ‘Culprit’!When System Monitoring Goes Silent: Analyzing Advanced Persistent Threats (APT) on CentOS 7[Emergency Troubleshooting] Server CPU Soaring to 200%, It’s Actually a Mining Trojan at Work! |