Since graduating with my master’s degree, I have been working in the automotive embedded industry for three years. Compared to school projects, company projects have more stringent requirements for code writing standards and test cases. In the automotive industry, most of the engineers’ code is generated by EB Tresos, Davinci, and Matlab, with only a few complex driver codes designed by engineers themselves. However, this does not mean that engineers only need to follow design requirements, check boxes in graphical configuration tools, generate code, and conduct a brief test. If one only possesses the ability to configure and generate tests, they can only remain at the junior engineer level and find it hard to take on the development of a module independently, making it difficult to achieve significant salary increases.
I believe that the first ability a mid-level engineer should possess is debugging skills. In the automotive industry, a project’s code can have hundreds of thousands or even millions of lines, and engineers cannot be fully knowledgeable about every module. Therefore, it is essential to have debugging skills to locate which module has issues using debugging tools and then find the corresponding module owner to modify the module’s configuration to meet the actual project requirements.
Next, we will use the debugging tool winIDEA as an example to introduce some common debugging techniques to help engineers better solve practical project issues.
# Tip One
In C language, the code is divided into global and local variables. Global variables are stored in the microcontroller’s RAM, while local variables are stored on the stack. The debugger can view and modify global variables at any time. We can check the configuration status of the module and the variable assignment status through the values of all variables. This knowledge is something that entry-level microcontroller engineers should understand. However, in actual projects, this function is the most basic and critical.
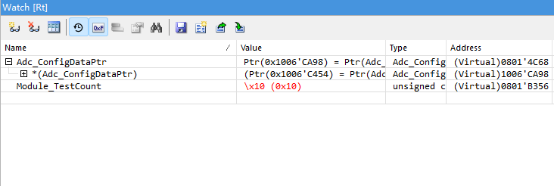
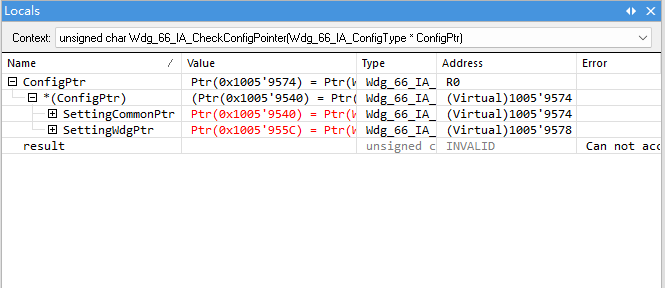
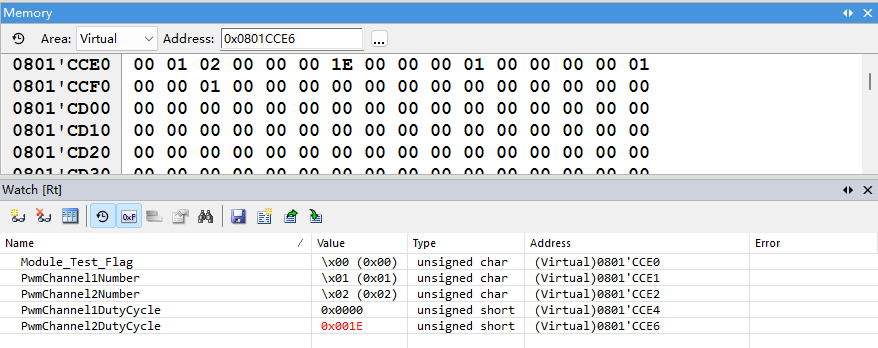
For example, during debugging, we may need to check some local variable values. Some cases can be viewed in the Locals window, but this interface cannot display all local variable values. To view local variable values, we can create a new variable of the same type as the local variable and continuously assign the local variable to the global variable in the code. We can then indirectly check the values of key local variables by viewing the global variable.
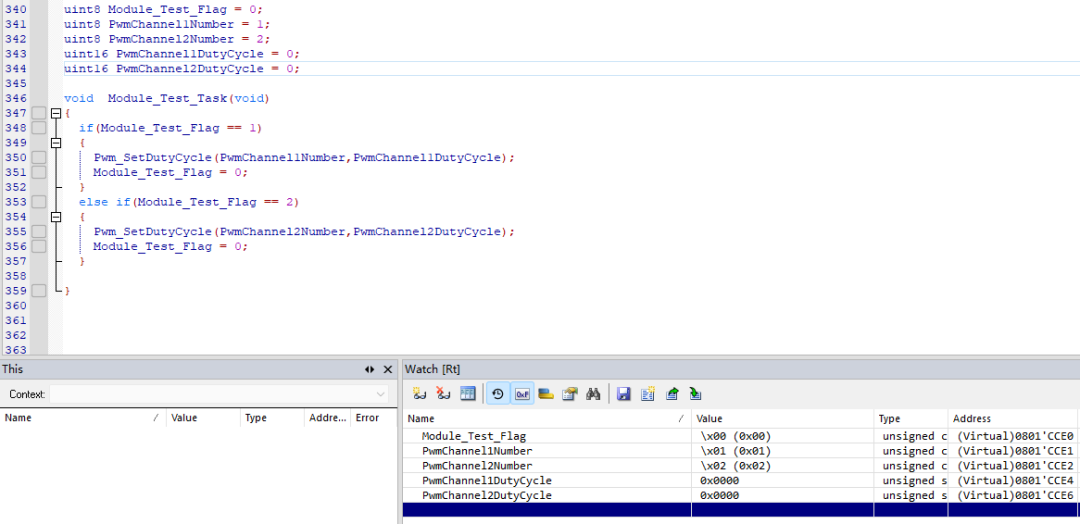
In actual projects, we may need to adjust some parameters. We can continuously modify the code, compile it, and then burn the produced ELF file into the microcontroller. Using this method not only reduces work efficiency but also risks damaging the microcontroller due to constant burning of code, which is mainly troublesome and makes work extremely unpleasant. At this time, we can double-click the variable value position to modify the global variable value. For example, in our work, we need to constantly modify the output duty cycle of different PWMs to find the most needed duty cycle in the project. We can first modify the DutyCycle value and then set the Test_Flag to 1 or 2 to execute the function that sets the duty cycle once. This method can greatly improve work execution efficiency.
# Tip Two
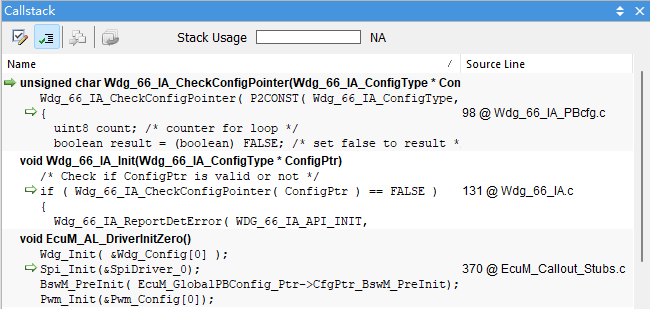
During project development, it is common to encounter situations where the function enters Det due to incorrect configurations or assignments. Various mistakes inevitably cause the function to enter Det and lead to an infinite loop. At this moment, the CallStack function is very useful. We can pause the function and then open the CallStack interface to check which function caused the Det, leading to the infinite loop. We can solve the problem step by step. The dual function can be accessed in the corresponding window on the right, making debugging very convenient.
# Tip Three
When viewing variables, we generally use the watch window. However, when checking large amounts of data, such as SPI cache data, using the watch window can seriously interfere with program operation, resulting in slow data refresh. In contrast, using Memory is excellent, with very smooth refresh rates. Therefore, when viewing large data sets, using the memory window has significant advantages. In projects, due to various reasons, such as debugging tool configuration issues, the downloaded program may be consistent, but the microcontroller’s functionality is inconsistent. In this case, we can use the memory window to copy all data from Flash and then use tools to compare whether the code burned into the microcontroller is consistent.
Due to time constraints, I will temporarily share these three debugging tips. In the future, I will compile and share new debugging techniques and common errors encountered at work with readers to facilitate everyone’s development work.

Recommended Reading
How to control 6 LED lights with 3 IO ports?
Disassembling DingTalk face recognition attendance machine to see what solution is used!
What is the relationship between buck power supply ripple voltage and inductance?
[Follow] Check out past highlights
▼