In the previous article about the project proposal for Project Code C, a reader asked: How is the project’s revenue estimated? What is the LTV? Why is the estimated revenue one hundred million?
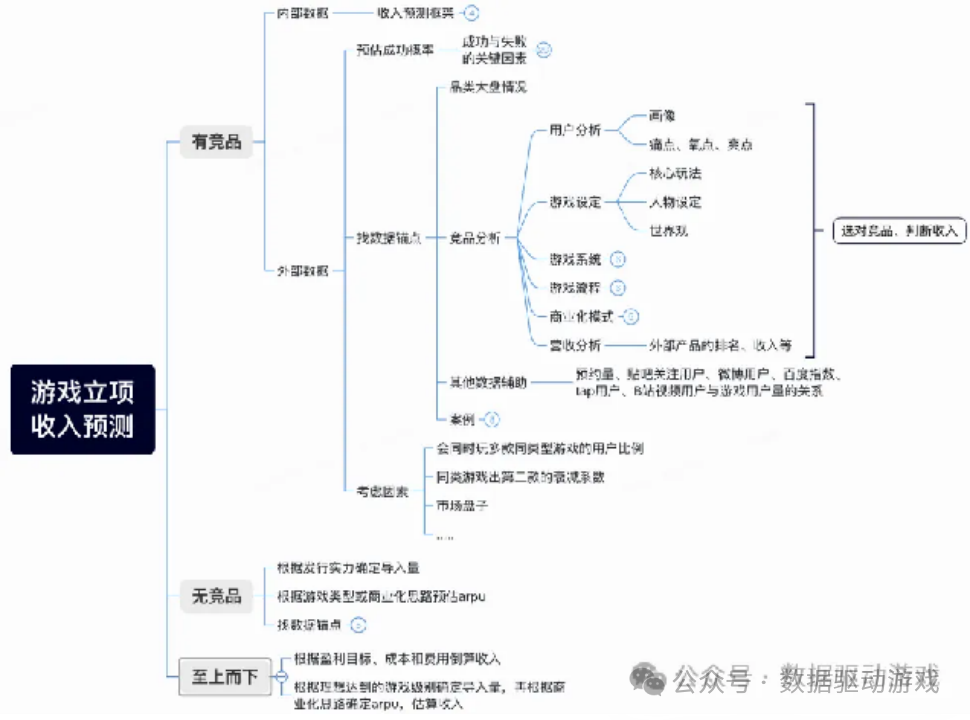
For revenue estimation methods during the project initiation phase, please refer to “Revenue Forecasting During Game Project Initiation (Part 1)” and “Revenue Forecasting During Game Project Initiation (Part 2)”. This article combines the specific situation of Project Code C, based on competitive product data, publisher strength, and commercialization direction, to estimate key indicators such as ARPU from multiple dimensions.The estimation framework is referenced in the image below.
01
—
Competitive Reference for Revenue Estimation
In revenue estimation, the core reference is based on data from two categories of competitive products: side-scrolling action games and standaloneIP adaptation mobile games.
1. Side-scrolling Action Games
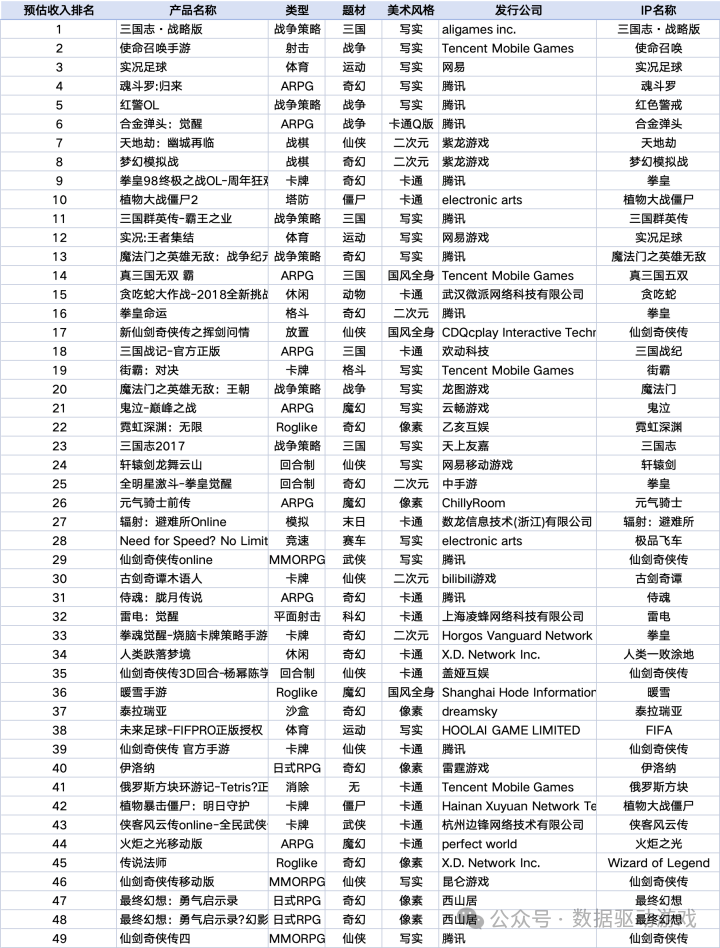
From 2011 to 2023, a total of 88 side-scrolling action mobile games have entered the top-selling list Top 300. The image below shows the top 50 games sorted in reverse order of their launch time, providing a basic understanding of their revenue performance through third-party data platforms.

(Note: Although “Stickman Alliance” is a representative product, it is not included in the list due to its earlier launch time.)
2. Standalone IP Adaptation Games
Considering that Project Code C belongs to the model of “Standalone IP + Mobile Adaptation”, we have also compiled the revenue performance of popular standalone IP adaptation mobile games from 2011 to 2023, as detailed in “Market Analysis and Development Trends of Standalone IP Adaptation Mobile Games”.
3. How to evaluate products without direct competitors?
During the project initiation phase, analysts and project teams often have differences in revenue expectations, primarily due to different choices of benchmark competitors.
Taking Project Code C as an example:
-
If benchmarking against “Romance of the Three Kingdoms: Strategy Edition”, the expected revenue is obviously high;
-
If benchmarking against “Neon Abyss: Infinite”, the mobile performance is average (its revenue also includes Steam performance);
-
If referencing “Contra: Return” or “Naruto”, it would be considered a blockbuster;
-
However, if benchmarking against “Terra Contract”, its highest ranking is only 113, with significantly lower revenue levels.
Since there are no direct competitors for Project Code C, a reasonable approach is to select indirect competitors that are as similar as possible in terms of “content structure + art style + IP popularity + commercialization model” as reference benchmarks.
02
—
What to do when there is a significant difference between the analyst’s estimate and the project team’s estimate?
During the project initiation phase, evaluating the revenue of a project without a playable version and test data is a highly challenging task. Especially when the game has strong artistic elements, questioning the project’s benchmark targets solely from the analyst’s perspective often fails to gain recognition. Therefore, we adopt the following methods of “objective comparison” as evaluation criteria:
1. Quantify content differences based on the quantity of art materials
For example, taking the art material quantity of the OB version of Project Code C, analysts can list the material quantities of target competitors at the same stage for comparison. Although it is difficult to accurately judge the quality of art in the early stages of the project, the quantity of content produced can be analyzed as a prerequisite for achieving revenue targets.
This kind of “quantitative assessment” is more easily accepted by the project team and management than simply stating “your product quality is inferior to competitors”.

2. Combine publisher resources and user acquisition capabilities to assess whether the estimated new user acquisition is reasonable
Analysts can utilize historical data from internal projects regarding market investment, user acquisition costs, and new user numbers for comparison as follows:
-
What is the approximate proportion of organic traffic?
-
How many new users correspond to how much market expenditure?
-
Is the current project’s estimate exceeding the reasonable range of previous company projects?
Through these data comparisons, it can effectively help the project team adjust or optimize expectations.
3. Infer reasonable values for ARPU based on category and commercialization model.
Revenue can be simply understood as: first-year revenue = first-year new user count × first-year LTV
Among them, the core variable in LTV is ARPU (Average Revenue Per User).LTV=Retention Rate*ARPU, where retention is the base, and payment (ARPU) is the coefficient; retention is fundamental, and payment itself is a funnel of retention.ARPU typically falls within the following reasonable ranges:
|
Category |
Daily Average ARPU (Yuan) |
|
Card Games |
1~5 |
|
ARPG |
3~10 |
|
MMORPG |
5~20 |
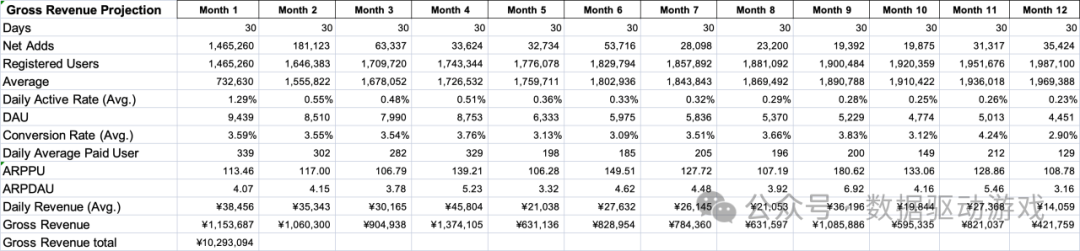
Combining the above three points, a reasonable revenue estimation model can be constructed, corresponding to the following revenue estimation templates, which analysts typically validate based on the project team’s estimates.
4. Top-down reverse estimation
Some projects belong to “strategic initiatives” or “executive-designated projects”, where revenue targets (e.g., annual revenue of 100 million) are set during the initiation phase. In this case, a “top-down” approach can be adopted:
-
Start from the revenue target and reverse engineer the required user scale
-
Estimate retention and ARPU based on category models
-
Then deduce the required content production capacity, investment budget, etc.
This method is more “result-oriented”, and its effectiveness depends on the management’s judgment of the project.