Table of Contents
-
1. Multi-level Cache of CPU
-
2. Improving Data Cache Hit Rate
-
3. Improving Instruction Cache Hit Rate
-
4. Improving Cache Hit Rate on Multi-core CPUs
-
5. Conclusion 🎉
Accumulating knowledge, sharing, and growing, so that both you and others can benefit! 😄
For more project courses, you can add me on WeChat

Every code execution relies on the CPU, and typically, effectively utilizing the CPU is the responsibility of the operating system kernel. However, when we write compute-intensive programs, the execution efficiency of the CPU becomes crucial. Since the CPU cache is made up of faster SRAM (while memory is made of DRAM), and is closer to the CPU core, the computation speed increases significantly when the required input data is read from the CPU cache instead of memory. Therefore, understanding the impact of the CPU cache on performance allows us to write our code more effectively and optimize program performance.

1. Multi-level Cache of CPU
As mentioned earlier, the CPU cache is closer to the CPU core, and since electronic signal transmission takes time, the closer the cache is to the CPU core, the faster the read and write speed. However, the space of the CPU is very limited, and the closer the cache is to the CPU, the more restricted its size becomes. Therefore, considering hardware layout, performance, and other factors, the CPU cache is usually divided into three levels of varying sizes.
The material of the CPU cache, SRAM, is much more expensive than the DRAM used in memory, so unlike memory, which is often measured in GB, its size is measured in MB. For example, on my Linux system, the closest level one cache is 32KB, the level two cache is 256KB, and the largest level three cache is 20MB.
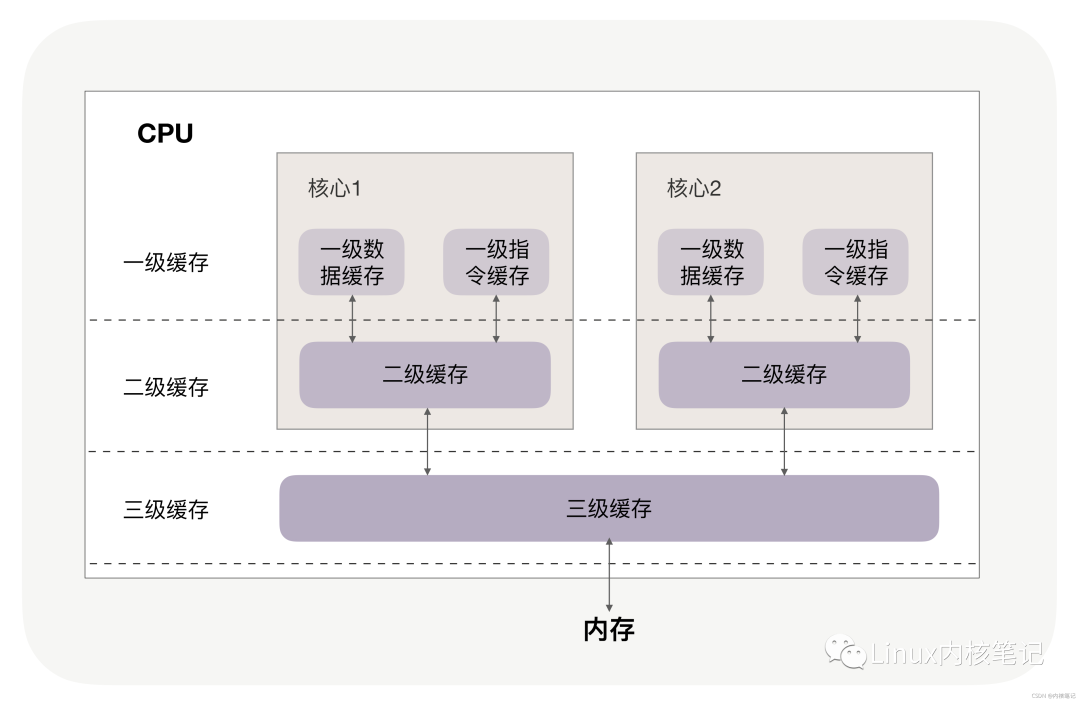
You may have noticed that the level three cache is much larger than the first and second level caches. This is because modern CPUs are multi-core, and each core has its own level one and level two caches, while the level three cache is shared among all cores of a single CPU.
During program execution, data from memory is first loaded into the shared level three cache, then into each core’s unique level two cache, and finally into the fastest level one cache, before being used by the CPU, as illustrated in the following image.
Cache is significantly faster than memory. Accessing memory typically requires over 100 clock cycles, while accessing level one cache only requires 4~5 clock cycles, level two cache about 12 clock cycles, and level three cache about 30 clock cycles.
If the data the CPU needs to operate on is in the cache, it is read directly, which is called a cache hit. Hitting the cache brings significant performance improvements, so our code optimization goal is to increase the CPU cache hit rate.
Of course, the cache hit rate is quite general, and specific optimizations need to be more detailed. For example, when you look at the CPU cache, you will find that there are 2 level one caches because the CPU treats instructions and data differently. For instance, in the operation “1+1=2”, the “+” is an instruction that goes into the level one instruction cache, while the input number “1” goes into the level one data cache. Although in the von Neumann architecture, code instructions and data are stored together, they are executed separately in the instruction cache and data cache, so we need to look at the cache hit rates of both separately.
2. Improving Data Cache Hit Rate
Let’s first look at how the order of data access affects the cache hit rate.
For example, if we want to traverse a two-dimensional array defined as follows:
int array[N][N];💬 You can think about which access method is faster: array[j][i] or array[i][j]?
for(i = 0; i < N; i+=1)
{
  for(j = 0; j < N; j+=1)
  {
    array[i][j] = 0;
  }
}
📢 The execution time of the former array[j][i] is more than 8 times that of the latter array[i][j].
💬 Why is there such a large difference?
This is because the two-dimensional array array occupies contiguous memory. For example, if the length N is 2, the order of elements in memory from front to back is:
array[0][0], array[0][1], array[1][0], array[1][1].If you access the array elements using array[i][j], it completely matches the order of elements in memory, so when accessing array[0][0], the cache has already loaded the next 3 elements, allowing the CPU to read the subsequent 3 elements quickly from the cache. However, if you access using array[j][i], the access order is:
array[0][0], array[1][0], array[0][1], array[1][1]At this point, memory is accessed in a jumping manner, and if the value of N is large, it will not be possible to load array[j+1][i] into the cache while operating on array[j][i].
💬 Two questions:
-
Why is there about a
7to8times difference in execution time? -
When loading the
array[0][0]element, how many elements does the cache load at once?
In fact, the answers to both questions are related to the CPU Cache Line, which defines the size of data loaded into the cache at once. On Linux, you can check it using the coherency_line_size configuration, which is usually 64 bytes.

Therefore, when loading array[0][0], if the memory they occupy is less than 64 bytes, the CPU will sequentially fill in the subsequent elements. The sequential access of array[i][j] takes advantage of this feature, making it faster than array[j][i]. This is also why when the element type is a 4-byte integer, the performance is faster than when it is an 8-byte high-precision floating-point number, as more elements can be loaded at once into the cache.
📢 Conclusion: When traversing and accessing arrays, accessing in memory layout order will bring significant performance improvements.
Next, let’s look at why the execution time differs by 8 times. In a two-dimensional array, the first dimension elements actually store addresses, while the second dimension stores the target elements. Since the addresses in a 64-bit operating system occupy 8 bytes (while in a 32-bit operating system, they occupy 4 bytes), each batch of Cache Line can load less than 8 two-dimensional array elements, resulting in a performance difference of about 8 times.
3. Improving Instruction Cache Hit Rate
Having discussed the data cache hit rate, let’s look at how to improve the instruction cache hit rate. We will use an example again. For instance, there is an array composed of random numbers between 0 and 255:
int array[N];
for (i = 0; i < TESTN; i++)
  array[i] = rand() % 256;
Next, we need to perform two operations: one is to loop through the array to check if each number is less than 128, and if so, set the element’s value to 0; the second is to sort the array. So, is it faster to sort first and then traverse, or to traverse first and then sort?
for(i = 0; i < N; i++) {
  if (array [i] < 128)
    array[i] = 0;
}
sort(array, array +N);
I will give the answer first: traversing after sorting takes only one-third of the time compared to traversing before sorting. Why is this the case? This is because there are many if conditional branches in the loop, and the CPU has a branch predictor.
When there are if, switch, and other statements in the code, it means that at least two different instructions can be executed. If the branch predictor can predict which segment of code will be executed next (for example, whether it will be in the if or else), it can preload these instructions into the cache, allowing the CPU to execute them quickly. When the elements in the array are completely random, the branch predictor cannot work effectively, while when the array is sorted, the branch predictor can dynamically predict future outcomes based on historical hit data, resulting in a very high hit rate.
How high is it? We can verify this using perf on Linux. Use the -e option to specify the branch-loads event and the branch-load-misses event, which represent the number of branch predictions and the number of prediction failures, respectively. You can also check the instruction cache misses using L1-icache-load-misses.
C/C++ languages also provide explicit tools for programmers to predict branch probabilities. If the condition expression in an if statement is very likely to evaluate to “true”, we can use the likely macro to wrap it, and conversely, we can use the unlikely macro. Of course, the CPU‘s own conditional prediction is already very accurate, and we only need to add these macros when we are certain that the CPU condition prediction will not be accurate and we know the actual probabilities.
#define likely(x) __builtin_expect(!!(x), 1)
#define unlikely(x) __builtin_expect(!!(x), 0)
if (likely(a == 1)) …
4. Improving Cache Hit Rate on Multi-core CPUs
Previously, we discussed data and instruction caches from the perspective of a single CPU core, but modern CPUs are almost all multi-core.
While the level three cache is shared among all cores, the level one and level two caches are unique to each core. We know that even with a single CPU core, modern time-sharing operating systems support many processes running simultaneously. This is because the operating system divides time into many slices, allowing processes to alternately occupy the CPU in a microscopic manner, which makes it appear that multiple programs are executing simultaneously on a macroscopic level.
Therefore, if process A uses CPU core 1 during time slice 1, it naturally fills the level one and level two caches of core 1. When time slice 1 ends, the operating system will let process A yield the CPU, and based on efficiency and fairness, it will reschedule CPU core 1 to prevent starvation of certain processes. If at this time CPU core 1 is busy while CPU core 2 is idle, process A is likely to be scheduled to run on CPU core 2, which means that even if we optimize the code well, we can only efficiently use the level one and level two caches of the CPU for one time slice, and the next time slice will face cache efficiency issues.
Therefore, the operating system provides the ability to bind processes or threads to run on a specific CPU. For example, Linux provides the sched_setaffinity method to achieve this functionality, and other operating systems also have similar API functionalities available. You can see that when multiple threads are executing intensive calculations simultaneously, and the CPU cache hit rate is very high, if each thread is bound to different CPU cores, performance will see a significant improvement. The perf tool also provides the cpu-migrations event, which can show the number of times a process has migrated from different CPU cores.
5. Conclusion 🎉
Today, I introduced you to the impact of the CPU cache on program performance. This is a very low-level performance optimization that is effective for intensive calculations in various programming languages.
CPU caches are divided into data caches and instruction caches. For data caches, we should try to operate on the same block of memory within the loop body, as caches operate on data in batches based on the CPU Cache Line, so sequentially operating on contiguous memory data also brings performance improvements.
For instruction caches, regular conditional branches can allow the CPU‘s branch prediction to work, further enhancing execution efficiency. For multi-core systems, if the cache hit rate of processes is very high, consider binding the CPU to improve cache hit rates.