STM32 has a code tracing feature, known as ITM, which is a very powerful debugging function that can replace serial input/output functionality, requiring only one I/O line to implement. Of course, its benefits are not limited to this; when debugging embedded operating system code, you will find it quite convenient. However, the focus of this article is not on how to use it for code debugging, but rather on how to enable this feature (in fact, this is just because I solved this problem and have not formally used it to debug code yet).
Now let’s take a look at the effect of ITM debugging:
All of the above functions are supported by KEIL.
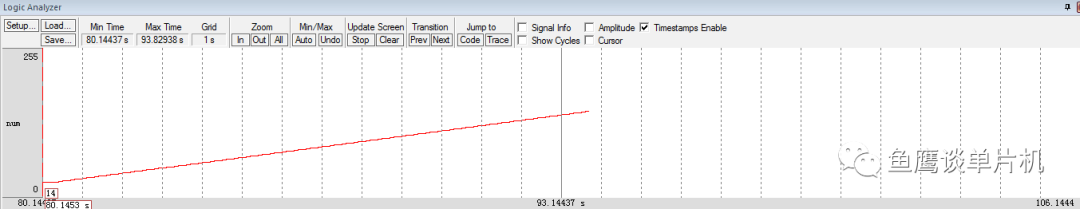
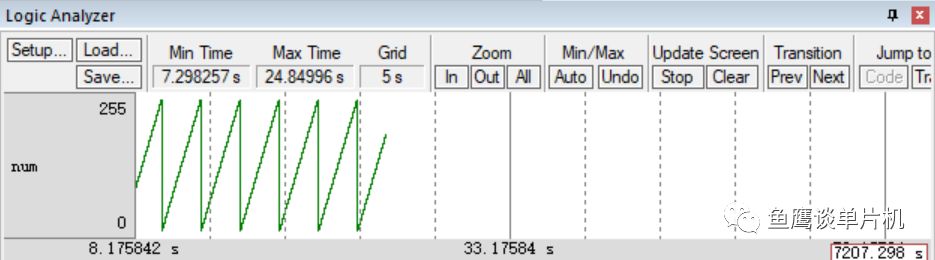
1. What if you want to observe the waveform of a variable? See the first image;
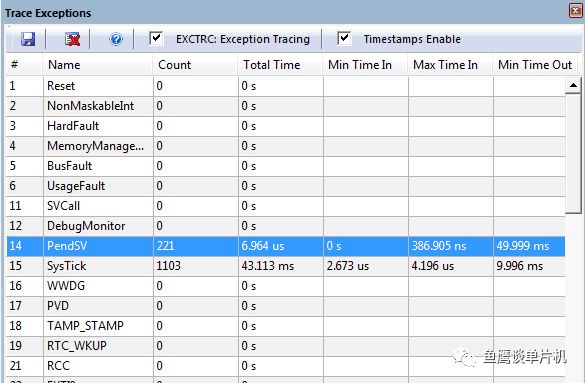
2. What if you want to know the interrupt handling time? See the second image;
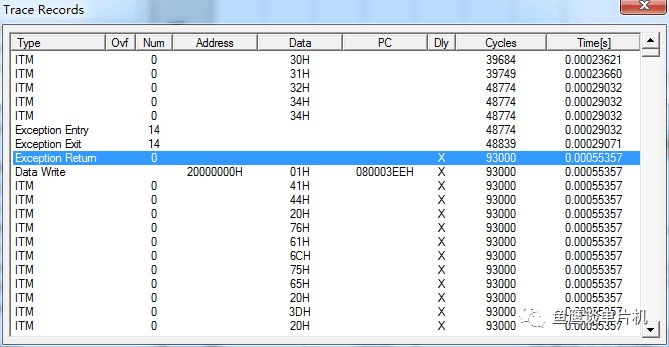
3. What if you want to see how the program runs? See the third image;
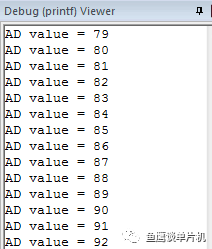
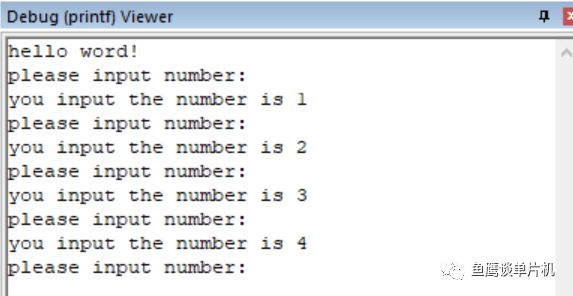
4. What if you want to output debugging information on your computer or use the computer’s keyboard to input information? See the fourth image.
These questions should have sufficiently piqued your curiosity, so now let’s officially discuss how to use ITM to achieve the above functionalities.
First, it is important to know that STM32 supports various debuggers, and here I will explain using ST-LINK as an example.
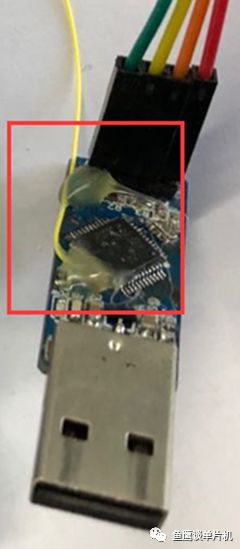
Generally, ST-LINK uses a four-wire system, namely VCC, GND, TMS/SWDIO, TCK/SWCLK. In fact, you only need to add one more wire to achieve ITM debugging functionality. So which mysterious I/O port is it?

It is PB3, so if you need to use ITM debugging, you need to keep this I/O port. However, this I/O port has quite a few multiplexing functions, so if you want to utilize its multiplexing function, you can only use ITM to debug other functional modules first, and leave the functionality related to PB3 for debugging with other methods later.
For the lab-made ST-LINK, you need to draw out a wire, which is PA10. The final wiring is shown below:
This is the hardware support for ITM. Additionally, it should be noted that the CMSIS-DAP debugger does not support this function, but J-LINK does.
Now let’s look at what needs to be done on the software side.
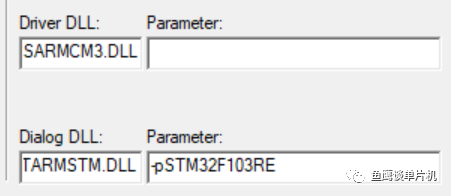
First, enable this function in KEIL:
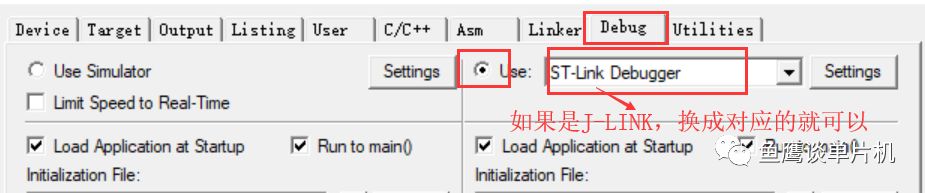
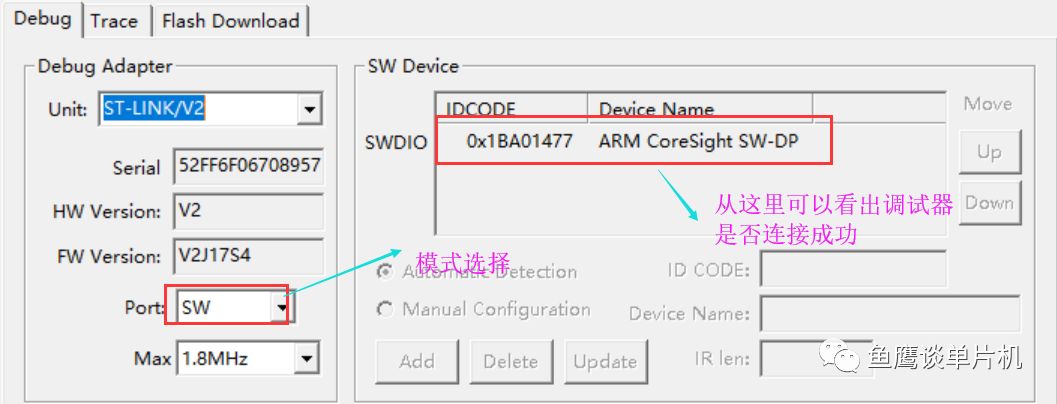
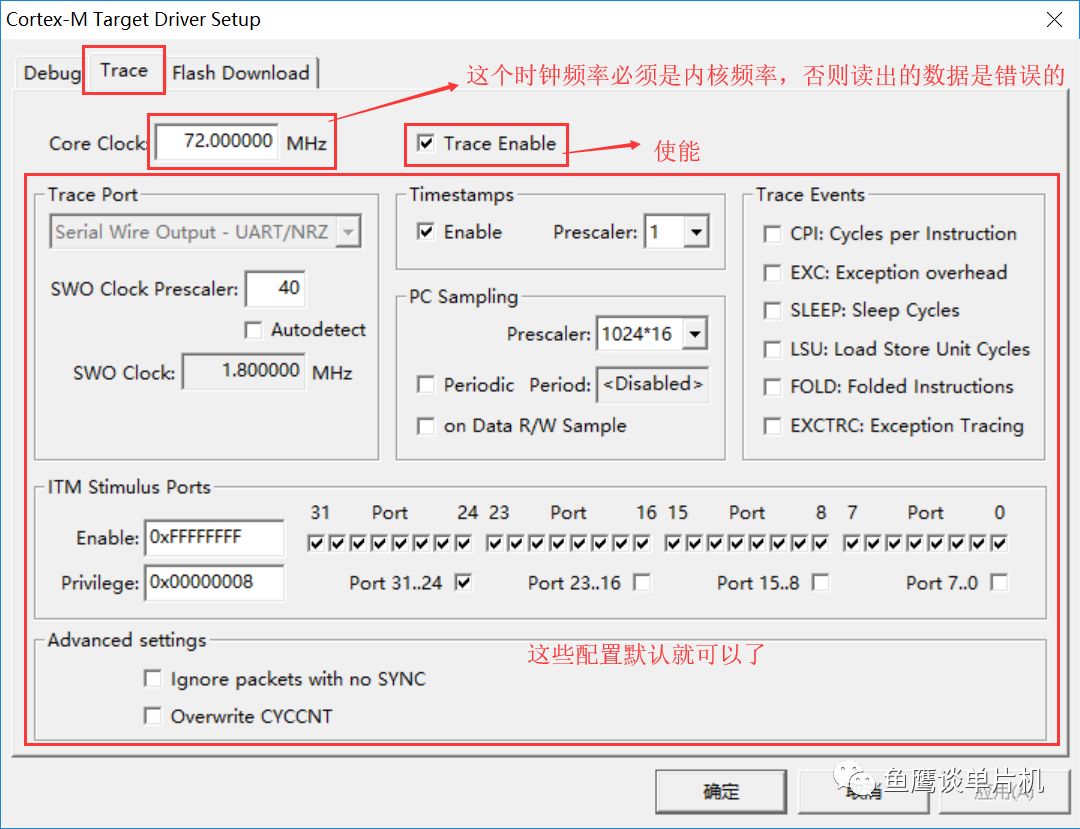
This is sufficient (this is just the simplest configuration; more specific configurations can be done through the interface above according to your needs).
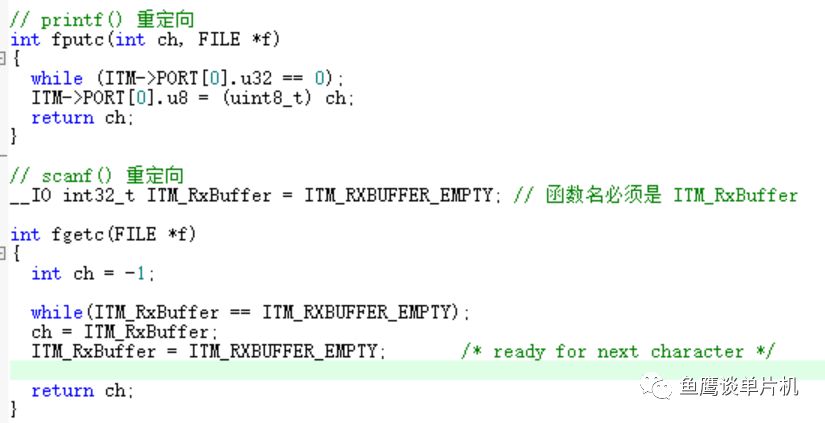
To implement the printf function output for debugging information and the scanf function input functionality, additional code support is needed in the code. The simplest code implementation can be as follows:
The more standardized way found online is as follows:
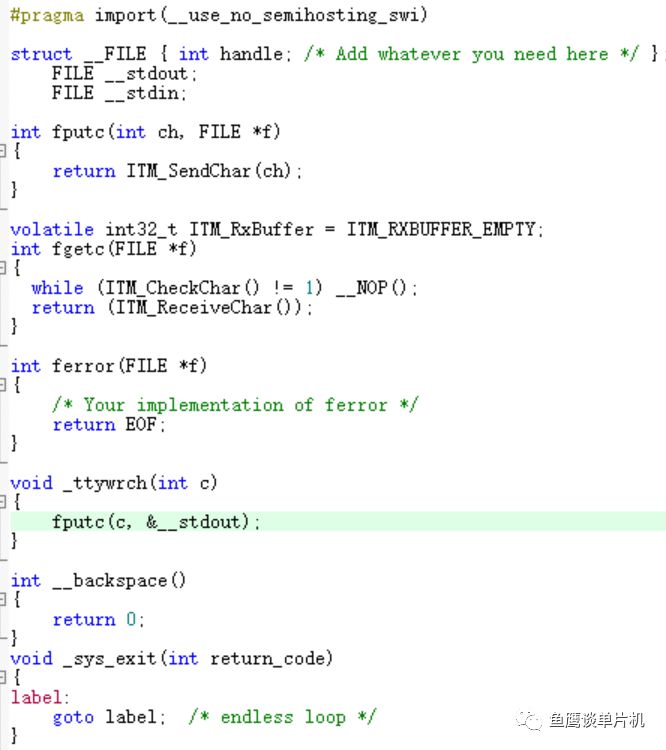
The functions ITM_CheckChar(), ITM_ReceiveChar(), and ITM_SendChar() are in core_cm3.h. The above code can be modified from the file located at installation path X:KeilARMStartupRetarget.c. Online resources say that the __backespace function must also be implemented, but practical testing has shown that it is not necessary.
Next, let’s talk about the ITM_RxBuffer variable, which needs to be initialized to ITM_RXBUFFER_EMPTY. This variable is used to cache keyboard input data. When you input data from the Debug(printf) Viewer, each input will be transmitted to this variable in real-time, and the microcontroller will retrieve keyboard data from this variable (the data writing to this variable should be done through ST-LINK, since ST-LINK can change memory data online).
Now let’s enter debug mode:
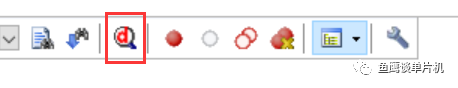
Click this icon to download the program and enter Debug mode.
Open the input/output window in the following way:
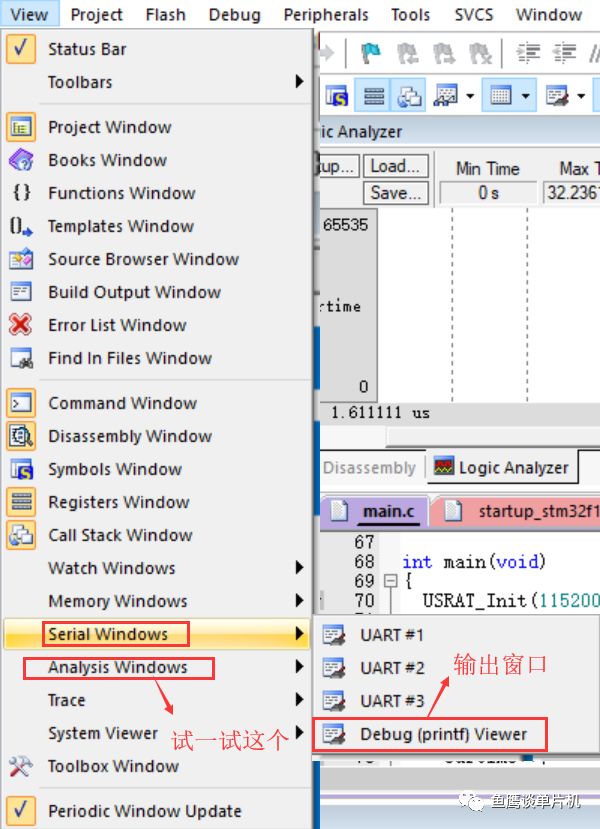
Then you can input and output data in this window:
Next is the logic analyzer (this feature will be introduced in a separate section):
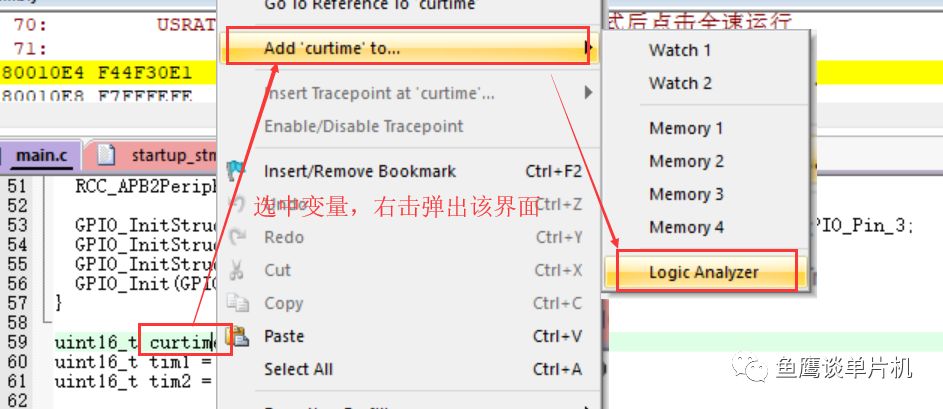
First, add the variables you need to observe the waveform:
Then you can observe the waveform through the logic analyzer:
If you cannot observe the waveform, try changing this parameter:
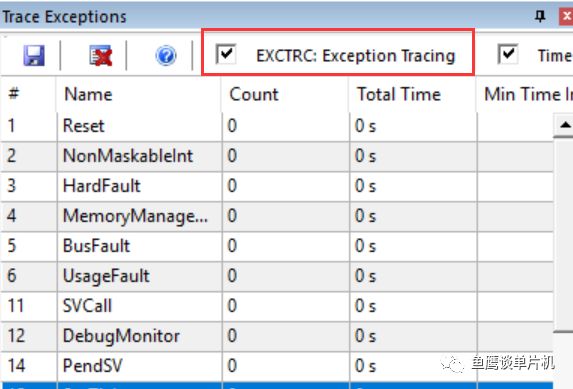
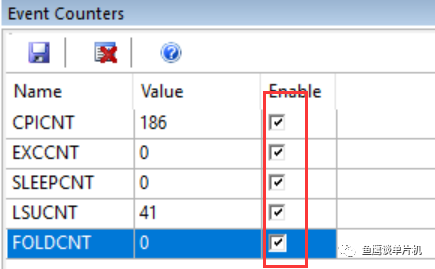
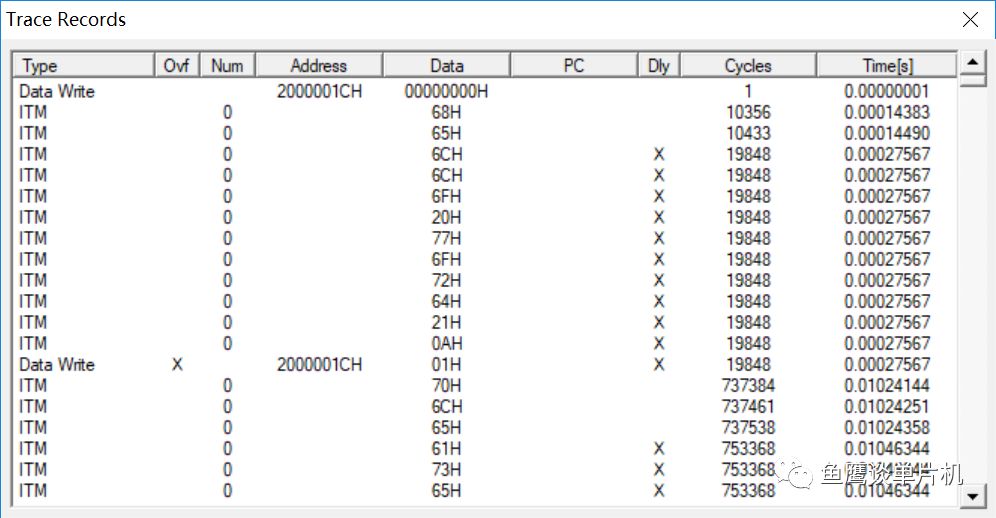
Next, open the tracking function window:
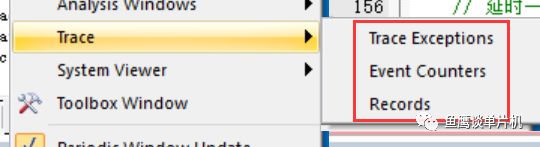
Function window:
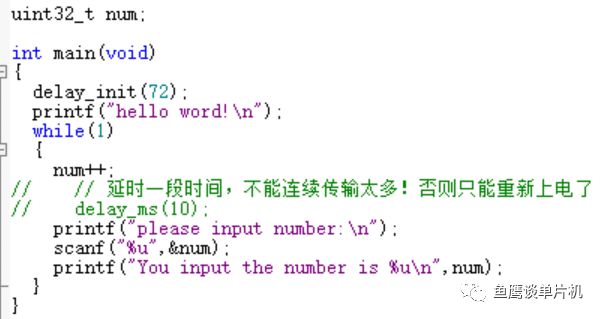
Test example code:
Now there is a problem where sometimes, for no apparent reason, data cannot be sent. This issue can only be examined after delving deeper into the debugging mechanism.
This is basically the introduction to using ITM; in the future, I will use the uCOS II operating system for practical debugging! Here, I will need to use a software called uCProbe, which interested readers can try on their own.
Author: Osprey, Source: Eagle Talks on Microcontrollers
Disclaimer: This article is authorized and reprinted from the “Eagle Talks on Microcontrollers” public account. Reprinting is for learning reference only and does not represent this account’s endorsement of its views. This account is not responsible for any infringement of its content, text, or images.