

Click on the blue text above to follow us

Translation by Yu Liqi, Department of Anesthesiology, Shanghai Public Health Clinical Center
Overview
Circulatory failure is common in sepsis, imposing a significant burden on the healthcare system. It is associated with increased mortality, and timely recognition is a prerequisite for ensuring optimal outcomes. Although there is a consensus that aggressive source control of infection, adequate antimicrobial therapy, and hemodynamic management are key determinants of outcomes, the best ways to achieve these core principles remain under discussion. Good cardiovascular support relies on individualized fluid resuscitation and vasopressor therapy. To this end, improving the overall framework of cardiovascular dynamics has been a recurring theme in modern intensive care. This review aims to examine the nature of such a framework that acknowledges the increasingly important significance of combining macro and micro hemodynamic variables to generate adequate tissue perfusion through adaptive hemodynamic support.
Keywords
Sepsis; Shock; Hemodynamics; Monitoring; Macro Circulation; Micro Circulation
1. Introduction
The key pillars of sepsis management are source control of infection, antimicrobial therapy, and circulatory resuscitation. Careful consideration and early recognition of sepsis, particularly when hemodynamic instability occurs, constitute factors that confer the greatest survival benefit. Optimal hemodynamic resuscitation is a fiercely debated topic, believed to further improve outcomes.
In sepsis, multiple mechanisms combine to produce hypotension and impair end-organ perfusion. Their relative impact is time-dependent and exhibits individual and inter-individual differences based on a unique set of host risk factors and immune responses. Disorders of macro and microcirculation are equally significant and can be practically divided into two categories: peripheral vascular dysfunction and myocardial dysfunction. The former includes venous and arterial vasodilation, impaired microcirculatory flow distribution (i.e., stasis, normal, intermittent, and high-flow capillary units coexisting), and the ubiquitous shock-induced endothelialopathy (SHINE), impaired glycocalyx, and increased capillary permeability. The latter is traditionally considered left ventricular systolic dysfunction. However, increasing evidence supports the role of the right ventricle (RV), which is far from being merely a passive conduit of the heart, and can be impaired and limit left ventricular performance. Additionally, with increasingly apparent diastolic dysfunction itself having adverse effects on outcomes, diastolic dysfunction has also gained more attention. In summary, these circulatory disorders form the basis of changes in hemodynamic status, characterized by potential ventricular interdependence disorders, right ventricle and left ventricle-artery (VA) decoupling, the inactivation of the vascular waterfall (i.e., the pressure gradient generated between Permutt and Riley’s critical closing pressure (CCP) of the artery and Guyton’s mean systemic filling pressure (MSFP), which is used to stabilize tissue perfusion in the presence of low flow), and the loss of hemodynamic consistency. According to this principle, monitoring protocols have shifted from a one-size-fits-all model to an individualized framework that supports specific hemodynamic goals, adapts to multiparameter monitoring, and functionally assesses cardiovascular reserve to ensure the adequacy of end-organ blood flow.
The scope of this review is to describe and discuss the components of such a contemporary physiology-based management recommendation for circulatory disorders with a goal-oriented approach. The focus is on differentiating macro and microcirculatory endpoints and how to coordinate and combine these two components to optimize tissue perfusion.
2. Macro Circulation
Traditionally, hemodynamic resuscitation aims to prevent or restore tissue hypoxia by improving a series of microcirculatory endpoints. The inherent assumption of this approach is a linear relationship between macro hemodynamics and end-organ hypoxia (a cellular phenomenon). This may be true to some extent, especially in the initial stages of acute circulatory dysfunction associated with sepsis. Nevertheless, the progressive stage is characterized by both endothelial dysfunction and cellular pathological hypoxia. The former marks a new circulatory state in which macro and microcirculation become uncoupled (i.e., hemodynamic incoherence), meaning that tissue perfusion may not improve, and may even worsen, after increases in systemic circulation flow. The latter may signal a second-level decoupling between microcirculation and the mitochondrial respiratory chain complexes. Therefore, overall, ensuring the integrity of macro circulation appears necessary but is not always sufficient to guarantee adequate tissue oxygen tension.
2.1. Resuscitation Endpoints
2.1.1. Blood Pressure
Blood pressure-driven resuscitation is the norm. However, various pathophysiological disturbances contribute to producing blood pressure signals. Therefore, analysis of the underlying causes of hypotension is a reasonable prerequisite for defining treatment (see section 2.2).
Determining hypotension at the bedside can be an elusive task. Assuming downstream pressures are negligible, mean arterial pressure (MAP) equals organ perfusion pressure, with an initial target suggested at 65mmHg MAP. In practice, healthcare providers often push MAP above 65 mmHg. Whether this approach is beneficial or harmful to patients remains controversial. A recent retrospective analysis of 8782 patients found that when the MAP threshold was below 85 mmHg, the risk of mortality, acute kidney injury (AKI), and myocardial injury increased. Conversely, pooled analyses from two large trials, SEPSISPAM and OVATION, comparing higher and lower MAP targets, found that a higher threshold with vasopressor use for more than 6 hours prior to randomization may increase mortality (odds ratio (OR), 3.00; 95% confidence interval, 1.33–6.74; p=0.017). Notably, SEPSISPAM showed that a higher MAP in patients with chronic hypertension reduced the need for renal replacement therapy, although there was no difference in mortality; however, it led to an increased incidence of atrial fibrillation in all patients. Finally, Lamontagne et al. randomized 2600 patients aged 65 years or older with vasodilatory hypotension to permissive hypotension (MAP 60-65 mmHg) or conventional monitoring and reported no difference in 90-day all-cause mortality between the study groups (41% permissive hypotension vs. 43.8% conventional monitoring, absolute risk reduction (ARR), -2.85%); 95% confidence interval, −6.75 to 1.05; p=0.15). Abnormal downstream pressures are common in critically ill populations. In such cases, the pressure difference between upstream pressures (i.e., MAP) and downstream pressures (such as IAP—intrabdominal pressure, ICP—intracranial pressure, or CVP—central venous pressure, whichever is higher) must be considered to maintain organ perfusion pressure. Mean perfusion pressure (MPP), defined as the pressure difference between MAP and CVP, is an attempt to approach renal hemodynamics physiologically. Systemic venous congestion (i.e., high CVP) is a significant factor in the pathophysiology of acute kidney injury (AKI), primarily occurring in acute and chronic cardiac patients, then in critically ill patients with sepsis. A study on infectious AKI patients found that despite the administration of norepinephrine (NE), MPP differences (i.e., the difference between pre-morbid MPP values and MPP values during resuscitation) were common, higher in infectious shock and severe AKI patients, primarily due to elevated CVP. Interestingly, CVP was independently correlated with the deterioration of AKI (adjusted OR, 1.26; 95% CI, 1.03-1.51), while MPP deficits were not. Another study reported that MPP below 60mmHg was independently associated with AKI progression, with authors emphasizing that elevated CVP had a greater impact on renal prognosis than MAP.
Some relevant information can be gathered from these studies. First, MAP targets should not be pre-assumed but should be pursued for each patient. To this end, vasopressor stimulation can be temporarily applied to achieve resuscitation goals, and when MAP is still abnormal at higher levels, return to baseline administration. Second, since response assessment following any therapeutic attempt is crucial, several physiological readings should be included to provide reliable feedback (e.g., lactate, capillary refill time (CRT), urine output, and level of consciousness). Third, for the same MAP, systemic (i.e., high CVP) or regional (i.e., high IAP or ICP) congestion, if neglected, may impair organ-specific perfusion.
Indicators beyond MAP can also provide useful guidance. The loss of arterial and venous vascular tone is a typical component of sepsis-related circulatory dysfunction. Therefore, from a pragmatic standpoint, initiating vasopressor therapy early to regulate venous tone and restore adequate venous return is reasonable. In fact, experimental and clinical data from sepsis suggest that starting norepinephrine (NE) early in conjunction with fluid resuscitation helps limit volume requirements and time until shock is controlled and is associated with improved tissue oxygenation, better visceral blood flow redistribution, and better clinical outcomes compared to fluid resuscitation alone or starting vasopressors later. In summary, hypotension with low diastolic arterial pressure (DAP) (i.e., <40 mmHg), especially in the presence of tachycardia, strongly indicates reduced vascular tone and even urges immediate NE administration before fluid resuscitation is completed. In this regard, the diastolic shock index (DSI), calculated as heart rate (HR) divided by DAP, may be a promising tool still awaiting confirmation to help signal severe vasoplegia. It can be envisioned that DSI could be used to initiate fluid restriction strategies in patients most likely to benefit, namely those primarily with a vasoplegic phenotype.
Finally, pulse pressure (PP) serves as a qualitative indicator of stroke volume (SV). It is not merely an isolated value; its trend over time provides an immediate window into cardiac function, but it does not absolve the responsibility of broader monitoring of cardiac pathology and cardiovascular functional reserve.
2.1.2. Blood Flow
Optimizing rather than maximizing oxygen delivery to tissues, along with the implied primary determinant—cardiac output (CO), is the cornerstone of treating circulatory failure. Simultaneously assessing more than one variable is crucial for understanding hemodynamic status, but redundancy must be avoided at all costs to facilitate timely meaningful decisions at the bedside. Is CO monitoring relevant to daily clinical practice? To answer this question, it must be considered from a thermodynamic perspective. Perfusion pressure (i.e., MAP) is an intensity characteristic of the circulatory system, meaning it is independent of the size of the system, while CO is a broad (or volumetric) characteristic that depends on the size of the system. This aspect, combined with the markedly different metabolic demands and vascular tone among patients, explains why a narrow effective perfusion pressure range (e.g., 60-85 mmHg) can lead to highly variable CO both within and between individuals. Therefore, CO does not qualify as a primary resuscitation endpoint. However, CO monitoring remains an excellent indicator of treatment response (e.g., inotropic-vasodilator therapy) and is needed to understand hemodynamic phenotypes (e.g., distributive shock) or any fluctuations thereof. The failure to improve clinical outcomes is not a decisive argument for abandoning CO monitoring, as it reflects the necessity of adjusting treatment options. Additionally, the same instruments used to calculate and measure CO can be used to evaluate fundamental hemodynamic principles (see section 2.3).
Changes in CO yield valuable insights, especially when combined with changes in CVP. Considering these two variables together helps assess cardiac function and the adequacy of venous return (see Figure 1), and there have been recent proposals to set fluid clearance rates during volume-depleting phases (i.e., using ultrafiltration or diuretics). In the latter aspect, closely monitoring tolerance (i.e., maintaining CO) and efficacy (i.e., lowering CVP) can enable fine-tuning of fluid clearance to closely match interstitial-vascular refill rates.
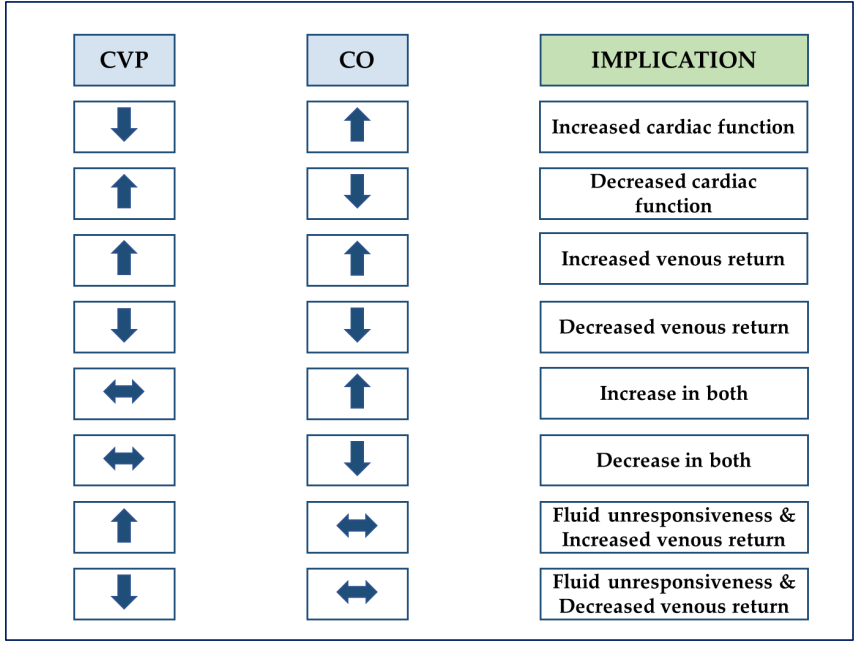
Figure 1: Explanation of the coupling changes between cardiac output and central venous pressure. CO, cardiac output; CVP, central venous pressure
2.1.3. Tissue Perfusion
The macro or global markers of tissue perfusion are predefined circulatory endpoints that form the basis of quantitative resuscitation strategies (i.e., goal-directed therapy (GDT)), which, compared to qualitative strategies, can reduce mortality when applied early. The main tools currently in use include central (i.e., ScvO2) or mixed (i.e., SmvO2) venous oxygen saturation, lactate, and carbon dioxide (CO2) gap.
After the success of Rivers’ early goal-directed therapy (EGDT) trial, three independent randomized controlled trials (RCTs) compared ScvO2-driven protocols with standard monitoring treatment but failed to replicate the initial findings and questioned the validity of ScvO2 as a resuscitation endpoint. However, the intervention strategies caused no harm. Compared to the initial EGDT, all three trials appeared to include lighter patients, with lower baseline lactate levels and ScvO2 greater than or equal to 70%. Notably, cellular pathological hypoxia associated with sepsis excludes the arbitrary use of ScvO2 to monitor O2 supply-demand balance (DO2/VO2).
Measuring lactate is crucial for monitoring and guiding the treatment of all forms of shock. Several causes of hyperlactatemia in sepsis include tissue hypoxia, increased glycolysis, adrenergic stimulation, inhibition of pyruvate dehydrogenase, and changes in clearance rates. Regardless of the etiology, hyperlactatemia is always associated with disease severity and prognosis. During acute changes in treatment or disease progression, lactate dynamics often lag behind other indicators, such as ScvO2 and CO2 gap. Therefore, the demand for combining multiple endpoints is fundamentally related to this aspect. The CO2 gap includes measuring the venous-arterial CO2 partial pressure difference (PvaCO2) or calculating the venous-arterial carbon dioxide content difference (CavCO2), though the latter variable is cumbersome in daily applications. Additionally, mixed venous and central venous blood are interchangeable, so the minimum configuration for conducting this monitoring is a central venous catheter and an arterial catheter.
Detailed analyses of CO2-derived variables can be found in other literature. In short, for given metabolic conditions (i.e., PvaCO2×CO≈CO2 production (VCO2)), PvaCO2 performs well as a marker of CO sufficiency. Furthermore, when PvaCO2 correlates with the arteriovenous oxygen content difference (CavO2), reflecting tissue hypoxia is possible. Interestingly, Ospina-Tascón et al. found that PvaCO2 closely correlated with microvascular blood flow and was unrelated to any overall hemodynamic variable. If this is confirmed, an increase in CO would not cause changes in PvaCO2, which may serve as a valuable signal of hemodynamic incoherence.
The CO2 gap addresses many of the obstacles associated with previously described markers. Unlike lactate, PvaCO2 provides real-time bedside feedback, and unlike ScvO2, it still provides information in the context of sepsis-driven cellular pathological hypoxia. Together, these variables combine into a three-layered approach to identify and differentiate macro and microcirculatory disorders (see Figure 2).
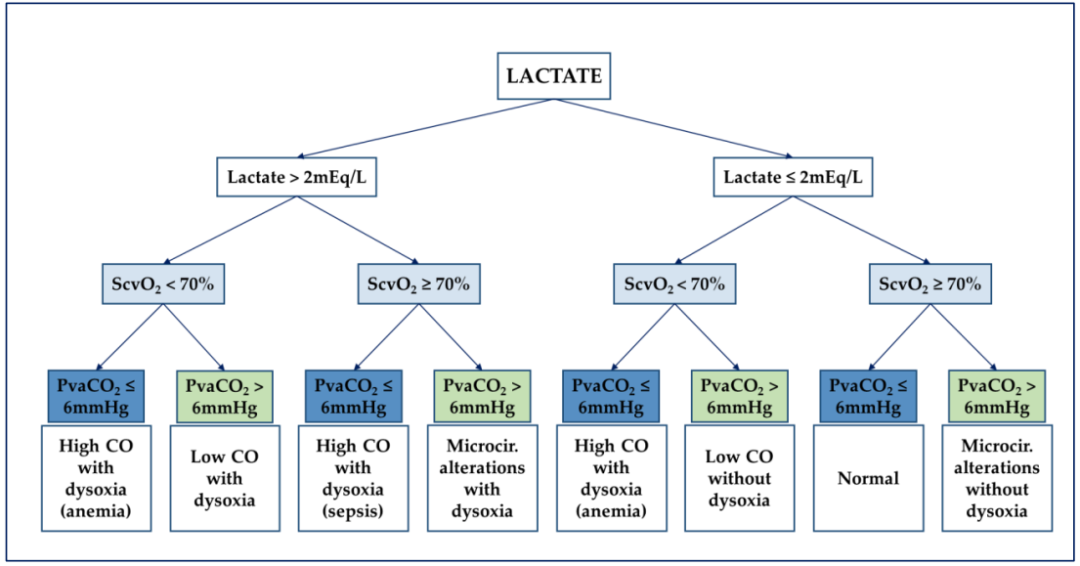
Figure 2: Flowchart for analyzing hemodynamic characteristics according to De Backer. ScvO2, central venous oxygen saturation; CO, cardiac output; Microcir, microcirculation; PvaCO2, venous-arterial carbon dioxide partial pressure difference.
2.2. Macro Circulation—Monitoring Toolkit
Ultrasound (US) has evolved into a comprehensive tool for assessing almost all organ systems (i.e., heart, lungs, vasculature, abdomen, and brain). Furthermore, there is increasing evidence that US is particularly suitable for individualized management of critically ill patients. For example, the combination of echocardiography and clinical data recently demonstrated five different macro phenotypes in infectious shock, including “good resuscitation,” “still hypovolemic,” hyperdynamic, left ventricular systolic dysfunction, and right ventricular failure, with the impact of left ventricular diastolic dysfunction being similar in the latter four phenotypes. Each hemodynamic characteristic has specific morbidity and mortality risks, and non-typed treatment is likely to exacerbate this risk. US can even extend to microcirculation to further describe local blood flow in the kidneys, liver, and spleen (see section 2.3.2). Thus, echocardiography (i.e., transthoracic echocardiography or transesophageal echocardiography) is today recognized as a first-line method for assessing patients with circulatory failure. The minimum hemodynamic toolkit includes an arterial catheter, a central venous catheter, and a US machine. While this minimum toolkit provides answers to many clinical questions regarding cardiac pathology and cardiovascular function (see Appendix A, Table A1, and section 2.3), there are still some gaps to be filled. In these cases, a pulmonary artery catheter (PAC) and transpulmonary thermodilution (TPT) will provide additional data on circulatory pressures and volume, thereby enhancing overall diagnostic rates.
PAC (i.e., rapid response volume PAC) and TPT allow continuous tracking of changes in CO, proving particularly useful for testing fluid responsiveness, even identifying circulatory events before hypotension occurs, and closely monitoring changes in treatment (e.g., administration of positive inotropes or vasopressors, fluid challenge tests). Additionally, PAC provides precise monitoring of pulmonary artery pressure (PAP) and left atrial pressure (LAP) (such as pulmonary artery wedge pressure, PAWP), and even provides model-driven estimates of pulmonary capillary pressure (PCP) based on transient PAP following balloon inflation. On the other hand, TPT provides insights into extravascular lung water (EVLW) and pulmonary vascular permeability index (PVPI), with PVPI being an indicator of pulmonary capillary leak. These features particularly advocate using PAC in refractory RV failure or acute pulmonary heart disease (ACP) cases, and TPT in moderate to severe acute respiratory distress syndrome (ARDS), with the choice between the two primarily depending on clinical priorities. However, neither PAC nor TPT can identify the different cardiovascular components generating CO, including function and structure, some of which constitute potential sources of error for techniques based on thermal dilution (e.g., intracardiac shunts, severe tricuspid or pulmonary valve regurgitation, or severe left heart regurgitation affecting only TPT). Spectral Doppler scanning of blood flow and myocardial velocity allows timely yet comprehensive non-invasive functional assessment of pressure (e.g., LAP, PAP), CO, systolic and diastolic function, and the coupling of the heart and circulation. Overall, while echocardiography is sufficient in many cases and is indispensable in most, in complex situations, echocardiography seems to be enhanced by invasive methods.
2.3. Hemodynamic Principles
2.3.1. Fluid Responsiveness
Fluid responsiveness (or preload dependence) is the predetermined increase in SV following an increase in preload. Predicting fluid responsiveness is mandatory for several reasons. First, volume and salt overload have long been associated with worsened prognosis, with only less than 40% of patients with septic hypotension being fluid responsive. Second, violating this first principle may lead to abnormal decreases in oxygen delivery (DO2) and negate the essence of volume expansion. Equally important, confirming preload independence may aid in adjusting ultrafiltration rates and prevent cardiovascular instability in patients undergoing continuous renal replacement therapy (CRRT).
Currently, dynamic parameters for detecting preload dependence are consistently recommended over static markers of cardiac preload. Using US, one such parameter is the change in left ventricular outflow tract (LVOT) volume-time integral (VTI) following respiratory or passive leg raising (PLR) testing. Given the series of strict prerequisites that the former must meet (e.g., regular heart rhythm, tidal volume of at least 8 mL/kg with no spontaneous breathing mechanical ventilation, thoracic closure, normal chest wall/lung elasticity ratio, and heart rate/respiratory rate ratio >3.6), PLR testing has proven more feasible, especially in the intensive care unit (ICU). Other factors that change preload, such as end-expiratory occlusion tests, combined individually or with end-inspiratory holds, or “mini-fluid” challenge tests, constitute practical alternatives to circumvent PLR limitations (e.g., elevated IAP or ICP, lower limb trauma).
To ensure the correct application of the first principle, several aspects are worth considering. First, fluid responsiveness is inherently linked to normal physiological states, so whether spontaneous or iatrogenic, fluid responsiveness is always pathological. The latter case often arises from the complete utilization of preload reserves to maximize end-organ blood flow. As recent experimental data suggests, this traditional practice may force patients into a non-physiological state, potentially causing harm, and should be abandoned in favor of individualized fluid therapy conducted on the steep portion of the Frank–Starling curve. Second, dynamic indicators assessing preload status provide a binary result of responsive and non-responsive, but this is difficult to reflect the bedside reality. In fact, nearly a quarter of patients may be in a “gray zone” where preload dependence cannot be reliably predicted. This situation necessitates further confirmation before increasing fluid load, preferably from highly specific tests. Third, predicting fluid responsiveness does not allow for assumptions about the safety, persistence of intravascular response, and optimal rates of fluid infusion (e.g., bolus versus continuous administration). Finally, macro-circulatory responsiveness does not guarantee micro-circulatory responsiveness, making it crucial to incorporate micro-circulatory variables into clinical practice.
2.3.2. Fluid Tolerance
Tissue edema and fluid overload are always interrelated (see Figure 3a), meaning that despite fluid responsiveness, tolerance to further volume may be compromised due to elevated capillary filtration pressure, increased endothelial permeability, or both. Conversely, in true fluid responders, fluid increases DO2 without causing pulmonary edema, significant hemodilution, or RV dysfunction, and increases CVP and subsequent end-organ congestion (see Figure 3b). Therefore, assessing fluid tolerance is crucial for fluid clearance.
US is an excellent bedside non-invasive test for fluid tolerance. For instance, pulmonary ultrasound B-lines and Doppler-estimated LAP can be combined to detect and differentiate EVLW excess from cardiac and non-cardiac causes. Additionally, venous filling ultrasound (VExUS) scoring is a recently proposed four-level scheme for grading inferior vena cava (IVC) and venous congestion in three target organs, including the liver (i.e., hepatic vein), intestine (i.e., portal vein), and kidney (i.e., renal vein). The clinical impact of venous congestion is much greater than previously considered. This is evident through recognizing end-organ blood flow, simply referred to as MAP minus CVP (i.e., MPP), which actually runs through the “vascular bottleneck” between pre-capillary arterioles and post-capillary venules. Therefore, within this tight microvascular pressure gradient, increased venous pressure is bound to alter tissue performance to a greater extent than predicted by MPP, ultimately carrying the risk of “microcirculatory congestion.” Hence, optimizing venous pressure becomes a priority for both macro and microcirculation.
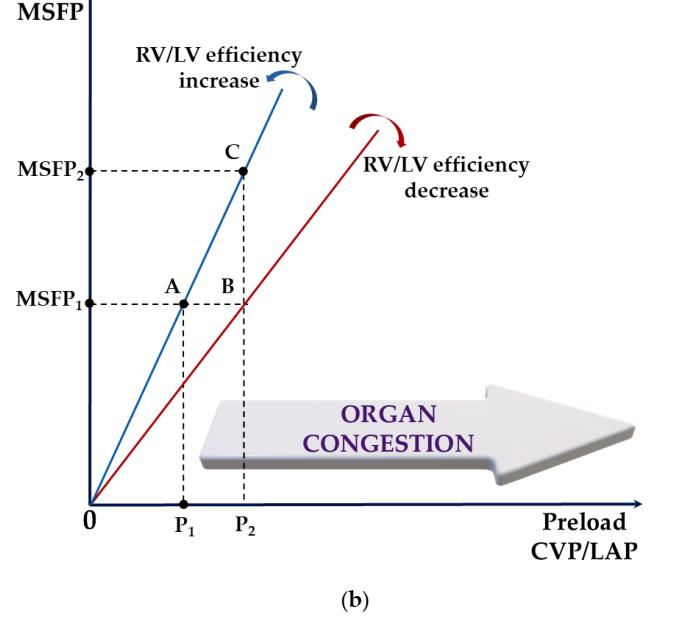

Figure 3: (a) Schematic representation of the overlay of the Frank–Starling (black) and Marik–Phillips (pure blue) curves showing the effects of the same preload challenge (Dx) on SV and EVLW in preload-dependent (A) and preload-independent states (B). A: SV (SV1→SV2) increases sharply, while EVLW (EVLW1→EVLW2) increases minimally; B: SV (SV2→SV3) has minimal increase with a sharp increase in EVLW (EVLW2→EVLW3). Sepsis alters capillary permeability, shifting the EVLW curve to the left (blue dot). EVLW, extravascular lung water; SV, stroke volume; Dx, a specific preload challenge. (b) A schematic illustrating how ventricular function (i.e., overall RV/LV efficiency) and volume status (i.e., MSFP) interact to produce increases in CVP, LAP, or both, leading to end-organ congestion (e.g., liver, kidney, mesentery) and pulmonary edema. Increased permeability independently exacerbates tissue congestion. In severe cases, loss of compartmentalization occurs in the interstitial space, leading to generalized edema. A to B: Reduced RV/LV efficiency has the risk of fluid intolerance for the same volume status. A to C: Preserved RV/LV efficiency does not guarantee fluid load’s fluid tolerance. Therefore, in the presence of significant impairment of RV/LV efficiency, normal volume status (i.e., MSFP) does not ensure fluid tolerance. Increased CVP may also result from changes in the Ecw/El ratio (e.g., intra-abdominal hypertension). CVP, central venous pressure; Ecw, chest wall elasticity; El, lung elasticity; LAP, left atrial pressure; LV, left ventricle; MSFP, mean systemic filling pressure; RV, right ventricle.
2.3.3. Ventricular-Arterial Coupling
The same cardiac output can, in fact, be composed of an infinite number of combinations of left ventricular contractility and load conditions. However, from a myocardial energetics perspective, only specific combinations can provide optimal ventricular energy conversion and transmission to the arterial system. This ventricular-arterial interaction, commonly referred to as V-A coupling, is mathematically represented by the ratio of systemic arterial elastance (i.e., Ea—a composite measure of the arterial load imposed on the left ventricle, depending on arterial resistance and compliance, heart rate, and aortic impedance) to left ventricular end-systolic elastance (i.e., Ees—a load-independent measure of left ventricular contractility) (see Figure 4). With the emergence of Chen’s echocardiographic Ees estimation method based on single-pulse echocardiography, monitoring V-A coupling (i.e., Ea, Ees, and Ea/Ees) has entered the clinical domain and propelled in-depth studies in critically ill populations. V-A decoupling, caused by changes in Ees, Ea, or both, is defined as an Ea/Ees ratio >1.36 and has been reported to be common in a range of patients with infectious shock. Another study found that bedside assessment of V-A coupling can identify, explain, and predict circulatory responses to treatment. These data suggest that sustained V-A decoupling is detrimental and may lead to heart failure, loss of preload recoverability, and ultimately poorer clinical outcomes. As a direct inference, therapies aimed at restoring V-A coupling are expected to enhance cardiovascular metabolic and mechanical efficiency, reducing morbidity and mortality. For instance, Guarrasino et al. support monitoring VA coupling to fine-tune positive inotropes and inotropic-vasodilator, vasopressors, and fluid administration (see Appendix A, Tables A1 and A2). To encourage bedside calculation of VA coupling, the same group of authors recently released a mobile application based on Chen’s method (iElastance©).
Finally, the combination of echocardiography and invasive arterial monitoring can provide additional V-A coupling measurements (i.e., dynamic arterial elastance Eadyn). In contrast to steady-state indices like Ea, Eadyn is a dimensionless measure representing the dynamic relationship between respiratory variations in pulse pressure (PPV) and stroke volume (SVV) (i.e., PPV/SVV). Preliminary reports have positioned Eadyn as an index directly related to arterial tone. Conversely, recent studies have found that Eadyn is negatively correlated with vascular tone, serving as a coupling index between circulation and heart, moving in the opposite direction to the Ea/Ees ratio. Therefore, higher Eadyn signals seem to improve VA coupling (i.e., lower Ea/Ees ratio) rather than increase vascular tone. Eadyn has even appeared in clinical settings before its true nature is confirmed. Initially, Eadyn was shown to predict the arterial pressure response of fluid responsive patients after volume expansion therapy, as well as off-line or after starting norepinephrine, regardless of preload reserve. In summary, these clinical studies indicate that higher Eadyn positions the cardiovascular system advantageously, thereby improving responses to changes in load conditions. Additionally, it is clinically significant that Eadyn remains effective regardless of the mode of ventilation, whether spontaneous or controlled (for its application, see Appendix A, Table A1). Excitingly, Bar and Guinot reported that the decrease in Eadyn during norepinephrine infusion was highly negatively correlated with vascular waterfall (i.e., CCP–MSFP), a microvascular phenomenon. This lays the groundwork for a composite index that reflects changes in macro and microcirculation.
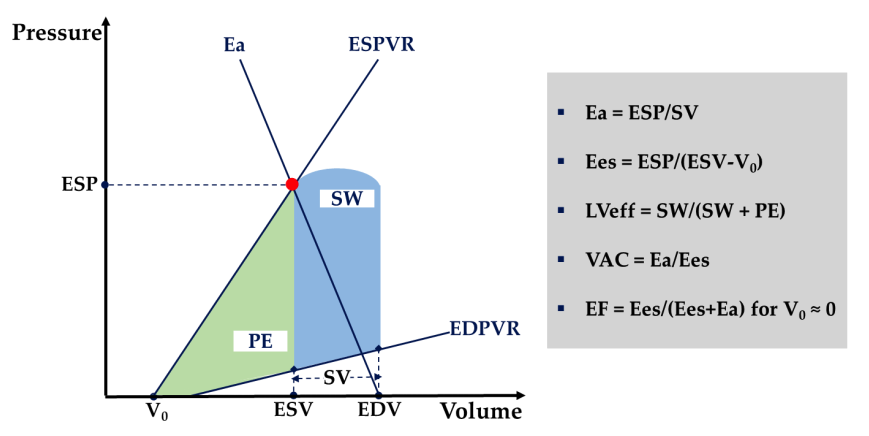
Figure 4: Schematic representation of Ventricular-Arterial Coupling (VAC). The left ventricle (LV) is characterized by the end-systolic and end-diastolic pressure-volume relationships (ESPVR and EDPVR). End-systolic left ventricular elastance (Ees) is the slope of the ESPVR line. Vp, left ventricular end-systolic unstressed volume, is the intercept of the ESPVR with the volume axis. The arterial system is characterized by arterial elastance (Ea), which is the slope of the line connecting end-diastolic volume (EDV) and end-systolic point (red dot). End-systolic coordinates are end-systolic pressure (ESP) and end-systolic volume (EDV). For an Ea/Ees of 1 and a corresponding ejection fraction (EF) of 50%, stroke work (SW) (blue area) is maximized. The left ventricular metabolic efficiency (LVeff) is maximized near 0.5, with a corresponding EF of 66%. PE, end-systolic potential energy (green area).
2.3.4. Assessment of Volume Status
In the last decade, recommendations regarding fluid resuscitation have been ubiquitous in the intensive care literature. However, it is surprising that there is a lack of consensus in measuring or estimating intravascular filling status. MSFP is a key component of Guyton’s CO regulation and serves as a potential method for assessing this elusive cardiovascular variable (i.e., volume status). MSFP equals the tension blood volume of systemic vascular compliance and changes with absolute volume or capacity.
Three different bedside estimates of MSFP can similarly track effective circulating blood volume. However, the mathematical model developed by Parkin et al. provides a simulated signal of MSFP (Pmsa) that shows minimal bias to zero-flow measurements during right atrial balloon occlusion. Additionally, the same mathematical structure provides dimensionless, scalar, and continuous measurements to assess overall cardiac efficiency (Eh) and volume responsiveness (Evol) (see Figure 5 and Appendix A, Table A1). Notably, Evol assesses the magnitude of response following preload challenge tests (e.g., PLR test), rather than merely the presence of responsiveness (i.e., responders vs. non-responders), compared to traditional markers of fluid responsiveness (see section 2.3.1).
There remains controversy regarding the best way to integrate Pmsa into clinical practice. Conveniently, closed-loop studies indicate that Pmsa provides clinically outcome-oriented guidance during periods of volume increase or decrease. In fact, Pmsa is simply a centralized mathematical equivalent proposed by Legrand et al. for separately monitoring CO and CVP to guide fluid clearance. Thus, during active de-resuscitation (i.e., using diuretics or CRRT), stable Pmsa signals can ensure an adequate balance between fluid clearance and vascular refill rates, thereby achieving optimization of interstitial congestion while maintaining cardiovascular stability.
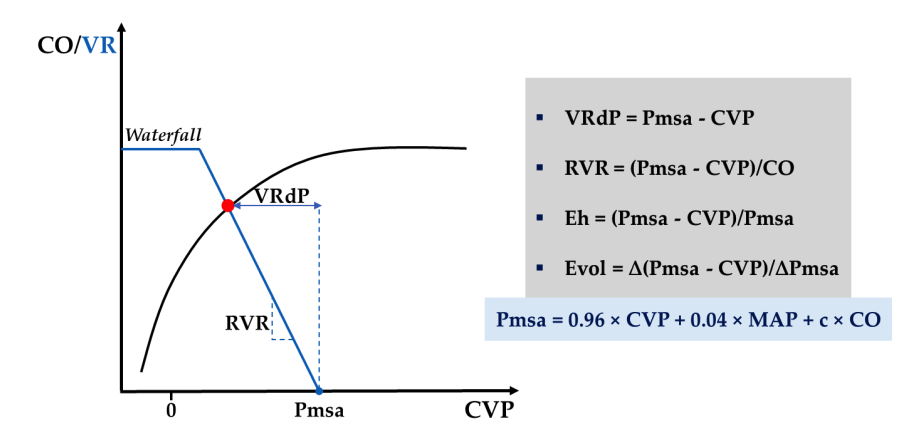
Figure 5: Schematic representation of the steady-state interaction between venous return (blue curve) and cardiac function (black curve), introducing Parkin’s Guytonian perspective on overall cardiac efficiency. c, human measurement constant; CO, cardiac output; CVP, central venous pressure; Eh, overall cardiac efficiency; Evol, volume efficiency; MAP, mean arterial pressure; Pmsa, mean systemic filling pressure simulated value; RVR, resistance to venous return; VR, venous return; VRdP, pressure gradient of venous return; Δ, change after preload challenge test. Further discussion can be found in Appendix A, Table A1.
3. Microcirculatory Hemodynamic Monitoring
3.1. Microcirculation Assessment Cases
Circulatory homeostasis is generated by three independent compartments (i.e., macro, micro, and cellular compartments), each following specific rules that are always coupled and overlapping to protect organ function. Maintaining this orderly coupling (i.e., hemodynamic coherence) in the early stages of shock is possible, but once later tissue or organ damage occurs, it is lost. Therefore, compartmental analysis is conceptually not interchangeable but rather complementary, necessitating monitoring of the microcirculation “black box” itself to resolve coherence issues. With the emergence of handheld vivo microscopy (HVM), increasing clinical and experimental evidence supports this argument.
Several mechanisms may render hemodynamic coherence ineffective, preventing the macrocirculation from distributing oxygenated blood to various tissues, despite being correctable through fluid and vasoactive drugs. In healthy individuals, microvessels exhibit dense and uniform networks running near vascular waterfalls and obeying balanced intrinsic regulation (i.e., myogenic, metabolic, and humoral), ultimately depending on the complex interactions between quiescent endothelium, “thick” glycocalyx, and intact blood rheology. Shock states, including sepsis, have been shown to disrupt any of these characteristics. Additionally, therapies aimed at improving macro-circulatory variables may equally benefit microcirculation or may harm it, with this outcome being unpredictable.
The effects of fluid therapy depend on several factors, including timing, type, rate, duration, and volume of fluid. Early but not late sepsis shows significant microcirculatory improvement following fluid administration, independent of fluid type (i.e., crystalloids vs. 4% albumin) and overall circulatory effects. Two other studies observed the macro-microcirculatory coherence following early septic volume challenge tests, yielding contradictory results that may reflect differences in disease severity among patients.
Fluid overload can lead to tissue edema, hindering normal oxygen diffusion. Additionally, secondary hemodilution can decrease capillary hematocrit and alter blood rheological characteristics, thereby reducing viscosity and alleviating shear stress-mediated vascular regulation. Thus, in states of low oxygen-carrying capacity, red blood cell (RBC) transfusion may be an ideal candidate, but existing evidence supports a more nuanced view. Sakr et al. found a bimodal response following RBC transfusion in septic patients, where microcirculatory improvement occurred in patients with altered capillary perfusion at baseline, while those with normal baseline microcirculation worsened. Most likely, rheology plays a critical role in these observations. Experimental data indicate that blood viscosity exceeds oxygen-carrying capacity during isovolemic anemia while maintaining microcirculatory perfusion. Elsewhere, high-viscosity plasma is associated with increased concentrations of nitric oxide (NO) around blood vessels during hemodilution and is linked to increased functional capillary density (FCD) during hemorrhagic hypovolemia. However, translating these findings into practice will be a challenge, as chronic diseases lead to highly variable baseline blood viscosity levels in patients.
Compared to crystalloids, albumin and other high-viscosity compounds provide more durable microcirculatory replenishment with fewer capillary leaks, but only in microcirculation-targeted resuscitation strategies. Conflicting responses to inotropic-vasodilators and vasopressors are frequently reported, which may again reflect different baseline administration or microvascular conditions. Conversely, in experimental sepsis models, selective β1-blockers restored renal vascular waterfalls, reinforcing the concept that treatment should aim to alleviate SHINE to improve outcomes.
To a large extent independent of macro-circulatory characteristics, misguided therapeutic choices combined with shock can produce four types of microcirculatory changes. These often align with the complex pathophysiological states, such as sepsis, but one type often outweighs the other. According to Ince et al., they are: Type 1, complete stasis of capillaries (circulatory arrest, excessive vasopressors); Type 2, reduced number of continuously flowing capillaries (hemodilution); Type 3, capillary block near flowing units (sepsis, hemorrhage); Type 4, hyperdynamic capillary flow (sepsis and hemodilution). This classification constitutes a normative basis for further research, equally providing clinically useful information and adhering to the principle that optimal treatment must include microcirculatory feedback loops.
3.2. Microcirculation—Monitoring Toolkit
The gold standard (i.e., HVM) and several other methods have emerged in recent decades to reveal microcirculation for experimental analysis and understanding, enhancing clinicians’ awareness. Originating from in vivo microscopy, direct exploration of capillaries has evolved from orthogonal polarized spectral (OPS) imaging to side-stream dark field (SDF) imaging, and recently, the third generation of HVM combines incident dark field imaging (IDF). However, most studies have focused on sublingual microcirculation beds, as they are easily accessible and capable of representing microcirculatory disorders in other organs. Using light of specific wavelengths for hemoglobin, capillaries unfold against a white background with black/gray red blood cells. The presence or absence of RBC flow distinguishes functional and non-functional units, based on several datasets such as microvascular flow (e.g., microcirculation flow index, MFI), perfusion heterogeneity (e.g., MFI-derived heterogeneity index, HI), and capillary density (e.g., functional capillary density, FCD), providing a view of flow and diffusion components. Thus far, the technical limitations of image acquisition and labor-intensive computer-assisted manual image interpretation have hindered bedside use of video microscopy. Recently, Hilty and Ince introduced a fully automated IDF-compatible software platform (i.e., MicroTools) capable of collecting all parameters necessary to define microcirculatory status based on a recent consensus paper on sublingual microcirculation measurements in critically ill patients. Using the MicroTools system, the same authors proposed a new algorithm-based parameter (i.e., tissue RBC perfusion, tRBCp) that can integrate all flow and diffusion microcirculatory determinants and is expected to transform microcirculation monitoring into an easy-to-use monitoring model for managing circulatory failure. It can be argued that tRBCp is another reason supporting restrictive preload strategies in fluid-responsive patients, as maximizing microcirculatory functional reserve may precede maximizing CO by adequately utilizing preload reserves. Furthermore, combining dark field technology with multi-wavelength blood oxygenation measurement can enrich the tRBCp parameter, thus providing a more comprehensive status of microcirculatory oxygen delivery.
Measurements of tissue oxygenation provide an indirect assessment of microcirculation. These primarily include tissue CO2 (tPCO2) and O2 (tPO2) tensions, as well as near-infrared spectroscopy (NIRS) for tissue oxygen saturation (StO2). Continuous static monitoring is the standard for all three techniques, but given the low signal-to-noise ratio and the wide overlap between healthy and critically ill subjects, interpretation is often challenging. Therefore, dynamic tests have been designed, such as oxygen-triggered tests (OCT) for transcutaneous tPO2 and vascular occlusion tests (VOT) for NIRS, to improve sensitivity and diagnostic rates. Failure of tPO2 to increase following OCT indicates insufficient tissue perfusion, thus worsening microcirculation, and predicts increased mortality and organ failure incidence. During VOT, plotting StO2 against time allows for deeper analysis. It first generates a deoxygenation slope (DeO2) related to local VO2 and produces a reoxygenation slope (ReO2), closely related to capillary reactivity (a marker of endothelial integrity) following occlusion release. According to several groups of authors, VOT-derived parameters provide important predictive information. In contrast, a recent systematic review demonstrated that baseline StO2 values, rather than VOT-derived parameters, could predict mortality, and the role of NIRS monitoring in treatment decisions could not be determined based on current evidence.
In summary, tissue-based parameters merely provide an overall view of regional microcirculation, as they cannot detect individual capillaries and do not provide relevant objective information regarding flow, perfusion heterogeneity, and vascular density. Therefore, further research will have to address a yet-to-be-standardized approach and clinical integration with rapid-frequency HVM technology, which will become a reality for everyday clinicians.
Finally, skin serves as a qualitative alternative sign of impaired tissue perfusion, easily and quickly assessed through changes in temperature (e.g., toe center temperature gradient), perfusion (e.g., capillary refill time, CRT), and color (e.g., mottling). Skin mottling scores can predict organ dysfunction and mortality in patients with septic shock, even in the pre-hospital environment. The ANDROMEDA-SHOCK trial found that resuscitation targeting CRT did not significantly affect 28-day mortality compared to lactate-targeted resuscitation, but led to less organ dysfunction at 72 hours. Bayesian analysis of these results indicated that the CRT-targeted group had an increased mortality rate at 72 hours, with a lower SOFA score. Thus far, CRT may be the easiest way to detect microcirculation. Good inter-rater reproducibility, rapid reflection of ongoing treatment, and resource independence make CRT a reliable and comprehensive endpoint for application during shock resuscitation.
4. Perspectives
The prioritization of tissue perfusion may change with the ongoing shock state. Strategies combining macro and microcirculatory endpoints with ultrasound can yield individualized treatment plans with a solid physiological basis (see Figure 6). Considering the impending data, several components, including ventricular energetics, closed-loop volume status control, and end-organ Doppler, are expected to improve or be redefined.
Routine identification of microvascular phenotypes is a necessary condition for further improvement. However, integrating macro and micro hemodynamics remains a fiercely debated topic. While some authors prioritize systemic circulatory endpoints, others advocate for a tissue-centered approach in a comprehensive manner, without regard to macro-circulatory variables. Pragmatic clinicians recognize that these two options are far from mutually exclusive; in fact, they are complementary. As coherence is preserved in the early stages of shock, simply targeting macro hemodynamics can save time and resources without compromising outcomes. In contrast, implementing the same strategy later in shock may be misleading and cause undue harm. As incoherence increases over time, treatment should target the microcirculation in the later stages of resuscitation.

Figure 6: Conceptual approach to shock management. Panel 1: Introduces a minimal hemodynamic toolkit, including ultrasound, arterial, and central venous catheters. Extended monitoring includes pulmonary artery (PA) catheters and transpulmonary thermodilution (TPT). Panel 2: During active resuscitation (R), fluid responsiveness and tolerance should be assessed simultaneously to ensure: (1) preservation of preload reserve, (2) minimal increase in intravascular pressure necessary to maintain adequate tissue perfusion. Therefore, deterioration of fluid tolerance hinders tissue perfusion and needs to be addressed. During de-resuscitation (E), both volume tolerance and volume status control should be assessed simultaneously to ensure that fluid clearance rates achieve efficiency (lower CVP) and tolerance (preserved CO and MAP). Overall, stable Pmsa and Eh ensure hemodynamic stability during the de-resuscitation phase. In a preload-independent state, higher clearance rates and lower Pmsa can be safely achieved until a threshold is reached, at which point further reductions in P’msa will compromise Eh and lead to low CO. VA coupling represents the energy refinement of cardiovascular status, which can be overlaid at any stage. For practical reasons, Ea/Ees and Eadyn are set at 1 (see Tables A1 and A2 for further discussion). Panel 3: Illustrates a comprehensive approach including macro and microvascular targets, emphasizing that individualized targets are crucial for improving outcomes. From the microcirculatory perspective, bedside clinicians must rely on clinical examination (i.e., CRT) until more objective monitoring (i.e., HVM) can be performed. CO, cardiac output; CRT, capillary refill time; CVP, central venous pressure; Ea, arterial elastance; Eadyn, dynamic arterial elastance; Ees, ventricular elastance; Eh, overall cardiac efficiency; HVM, handheld vivo microscopy; LAP, left atrial pressure; MAP, mean arterial pressure; MPP, mean perfusion pressure; NIRS, near-infrared spectroscopy; Pmsa, mean systemic filling pressure simulated value; ScVO2, central venous oxygen saturation; VA, ventricular-arterial coupling; ΔPCO2, venous-arterial carbon dioxide partial pressure difference.
5. Conclusion
The hemodynamic characteristics of critically ill patients exhibit varying degrees of complexity and are prone to change over time. Accurate hemodynamic analysis is crucial for ensuring adequate supportive interventions and ultimately improving outcomes. Most patients fall within the conventional recommendations, but many others do not fit into the conventional recommendations, necessitating an expanded hemodynamic dataset. Both macro and microcirculatory factors contribute equally to this delineation. Therefore, a comprehensive circulatory assessment framework is proposed, containing a set of hemodynamic principles with macro and microcirculatory resuscitation endpoints, aimed at exploring critically ill patients across all shock trajectories. Future research is necessary to encourage and further define its bedside use.
Appendix A


Table A1: The minimum toolkit consisting of ultrasound, arterial, and central venous catheters should answer the questions. a Hypovolemia and vasoplegia (i.e., relative hypovolemia) are related to tension blood volume and reduced venous return and exhibit indistinguishable echocardiographic characteristics. Clinical context can guide the differentiation between these two situations. Additionally, vascular tone (i.e., SVR) in vasoplegic patients is typically low and can be easily calculated bedside: 80×(MAP−CVP)=COECHO×SVR. b Left ventricular coupling, defined as the ratio of arterial elastance (Ea) to left ventricular end-systolic elastance (Ees), can be calculated at the bedside using Chen’s method, recently available as a free mobile application. Additionally, dynamic arterial elastance (Eadyn) can be calculated as the ratio of pulse pressure variation (PPV) to stroke volume variation (SVV), with two independent signals (i.e., PPV from arterial catheter and SVV from echocardiography). A practical single cutoff value of 1 can be used to differentiate between the response to vasopressors for fluid load (i.e., preload-dependent patients with MAP increase after fluid) and the cessation of vasopressors (i.e., MAP decrease after norepinephrine dose reduction). c Assessment of volume status depends on determining Pmsa according to the mathematical model of Parkin and Leaning. Pmsa=0.96×CVP+0.04×MAP+c×COECHO, where c is an individual human measurement constant (i.e., dependent on age, height, and weight). Eh=(Pmsa−CVP)/Pmsa. Eh (overall cardiac efficiency) is a dimensionless ratio between 0 and 1, where 0 indicates “no flow” and 1 indicates ideal cardiac function. The typical Eh range for critically ill patients is between 0.3 and 0.5. Evol=∆(Pmsa−CVP)/∆Pmsa. Evol (volume efficiency) is a scalar and continuous measure of the efficiency of preload changes (e.g., after PLR) to increase CO. Preload responsiveness is incrementally associated with Evol≥0.35 after PLR; Evol range, [0;1].

Table A2: Decision tree flowchart based on the research of Guarrasino et al. assists in integrating VA coupling into routine hemodynamic therapy.
Original Article Address:Valeanu, L.; Bubenek-Turconi, S.-I.; Ginghina, C.; Balan, C. Hemodynamic Monitoring in Sepsis—A Conceptual Framework of Macro- and Microcirculatory Alterations. Diagnostics 2021, 11, 1559.
Doi: https://doi.org/10.3390/diagnostics11091559
Source: Jinshui Mata

● Perioperative management of hemodynamically unstable patients
● Hemodynamic management goals for emergency ischemic stroke patients undergoing interventional surgery
● The impact of peripheral nerve block versus general anesthesia on hemodynamics and prognosis in diabetic foot surgery patients
● Literature review | Which hemodynamic monitoring should we choose for critically ill patients with acute circulatory failure?
● Comparison of remimazolam intravenous anesthesia with propofol intravenous anesthesia for intraoperative hemodynamic stability in prone spinal surgery: A randomized controlled trial

Miller Voice Fan Demand Collection QR Code

(Scan to fill in your needs)
Disclaimer:
The original or reprinted content published on this WeChat public platform does not represent the views or positions of Miller Voice. The content involving drug use, disease diagnosis and treatment, etc., is for reference by medical professionals only.

Editor: MiSuper. Mi Chao
Proofreader: Michel. Mi Xuan
Miller Voice Editorial Department Miller Voice, accompanying you with care
Follow Miller Voice
Stay updated on new developments in the field of anesthesia and perioperative care
Miller Voice will one day echo your voice