
Yesterday, while chatting with some people, they mentioned that they didn’t really understand how the stack works and didn’t know how to inspect the stack space.
This is a quick tutorial on how to use GDB to inspect the stack space of a C program. I believe this is similar for Rust programs as well. However, I am using C here because I find it simpler and easier to write erroneous programs in C.

Our Test Program
Here is a simple C program that declares some variables and reads two strings from standard input. One string is on the heap, and the other is on the stack.
#include <stdio.h>
#include <stdlib.h>

int main() {
    char stack_string[10] = "stack";
    int x = 10;
    char *heap_string;

    heap_string = malloc(50);

    printf("Enter a string for the stack: ");
    gets(stack_string);
    printf("Enter a string for the heap: ");
    gets(heap_string);
    printf("Stack string is: %s\n", stack_string);
    printf("Heap string is: %s\n", heap_string);
    printf("x is: %d\n", x);
}
This program uses a very unsafe function gets that you might never use. But I wrote it this way intentionally. When something goes wrong, you will know why.

Step 0: Compile This Program
We compile this program using the command gcc -g -O0 test.c -o test.
The -g option includes debugging information in the compiled program, making it easier to view our variables.
The -O0 option tells gcc not to optimize, ensuring that our variable x is not optimized away.

Step 1: Start GDB
Start GDB like this:
$ gdb ./test
It prints some GPL information and then gives a prompt. Let’s set a breakpoint at the main function:
(gdb) b main
Then we can run the program:
(gdb) run
Starting program: /home/bork/work/homepage/test

Breakpoint 1, 0x000055555555516d in main ()

(gdb) run
Starting program: /home/bork/work/homepage/test

Breakpoint 1, main () at test.c:4
4   int main() {
Now the program is running, and we can start inspecting the stack space.

Step 2: Check the Addresses of Our Variables
Let’s start by understanding our variables. Each of them has an address in memory, and we can print it like this:
(gdb) p &x
$3 = (int *) 0x7fffffffe27c
(gdb) p &heap_string
$2 = (char **) 0x7fffffffe280
(gdb) p &stack_string
$4 = (char (*)[10]) 0x7fffffffe28e
So if we look at the stack at those addresses, we should be able to see all of these variables!

Concept: Stack Pointer
We will need to use the stack pointer, so I will try to quickly explain it.
There is a register in x86 called ESP, known as the stack pointer. Basically, it is the starting address of the stack for the current function. In GDB, you can access it using $sp. The value of the stack pointer changes when you call a new function or return from a function.

Step 3: At the Start of the main Function, Check the Variables on the Stack
First, let’s look at the stack at the beginning of the main function. Here is the value of our stack pointer:
(gdb) p $sp
$7 = (void *) 0x7fffffffe270
So the starting address of the stack for our current function is 0x7fffffffe270, cool.
Now, let’s use GDB to print the first 40 bytes (i.e., 160 bytes) after the start of the current function stack. Some memory may not be part of the stack because I’m not sure how large the stack is here. But at least the starting point is part of the stack.
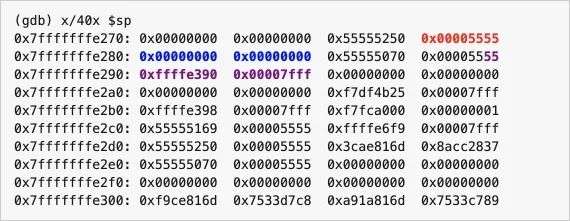
I have highlighted the positions of stack_string, heap_string, and x variables in bold and changed their colors:
x is in red, starting address 0x7fffffffe27cheap_string is in blue, starting address 0x7fffffffe280stack_string is in purple, starting address 0x7fffffffe28eYou may notice something strange here: the value of x is 0x5555, but we set x to 10! That’s because x is actually set only after our main function runs, and we are just now at the very beginning of main.

Step 4: Run to Line 10 and Check Our Stack Again
Let’s skip a few lines and wait for the variables to be actually set to their initialization values. By line 10, x should be set to 10.
First, we need to set another breakpoint:
(gdb) b test.c:10
Breakpoint 2 at 0x5555555551a9: file test.c, line 11.
Then continue executing the program:
(gdb) continue
Continuing.

Breakpoint 2, main () at test.c:11
11      printf("Enter a string for the stack: ");
Great! Let’s take another look at the contents of the stack! GDB formats the bytes slightly differently here, and honestly, I don’t care much about that (Note: you can check the x command in the GDB manual to control the output format using c). Just a reminder of the positions of our variables on the stack:
x is in red, starting address 0x7fffffffe27cheap_string is in blue, starting address 0x7fffffffe280stack_string is in purple, starting address 0x7fffffffe28e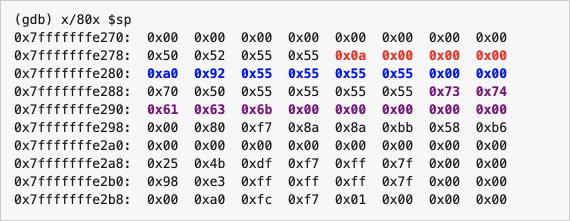
Before we continue, there are some interesting things to discuss.

stack_string Representation in Memory
Now (at line 10), stack_string has been set to the string stack. Let’s see how it is represented in memory.
We can print the bytes in the string like this (Note: you can use the c option to show it directly as characters):
(gdb) x/10x stack_string
0x7fffffffe28e: 0x73    0x74    0x61    0x63    0x6b    0x00    0x00    0x00
0x7fffffffe296: 0x00    0x00
stack is a string of length 5, corresponding to 5 ASCII codes – 0x73, 0x74, 0x61, 0x63, and 0x6b. 0x73 is the ASCII code for the character s. 0x74 is the ASCII code for t, and so on…
We can also use x/1s to let GDB display it as a string:
(gdb) x/1s stack_string
0x7fffffffe28e: "stack"

How heap_string Differs from stack_string
You have probably noticed that stack_string and heap_string are represented very differently on the stack:
stack_string is a segment of string content (stack)heap_string is a pointer pointing to some location in memoryHere is the content of the heap_string variable in memory:
0xa0 0x92 0x55 0x55 0x55 0x55 0x00 0x00
These bytes should actually be read from right to left: because x86 is little-endian, the memory address stored in heap_string is 0x5555555592a0.
Another way to view the memory address stored in heap_string is to use the p command directly:
(gdb) p heap_string
$6 = 0x5555555592a0 ""

Byte Representation of Integer x
x is a 32-bit integer, represented by 0x0a 0x00 0x00 0x00.
We still need to read these bytes in reverse (just like we did with heap_string), so this number represents 0x000000000a or 0x0a, which is the number 10;
This is how I set x to 10.

Step 4: Read from Standard Input
Now that we have initialized our variables, let’s see how the stack space changes when this program runs:
printf("Enter a string for the stack: ");
gets(stack_string);
printf("Enter a string for the heap: ");
gets(heap_string);
We need to set another breakpoint:
(gdb) b test.c:16
Breakpoint 3 at 0x555555555205: file test.c, line 16.
Then continue executing the program:
(gdb) continue
Continuing.
We input two strings, 123456789012 for the variable stored on the stack, and bananas for the variable stored on the heap;

First, let’s take a look at stack_string (here we have a buffer overflow)
(gdb) x/1s stack_string
0x7fffffffe28e: "123456789012"
This looks quite normal, right? We input 123456789012, and now it has been set to 123456789012 (Note: in a real test environment with gcc 8.3, it will directly cause a segmentation fault).
However, now there are some strange things. This is the content of our program’s stack space. There are some purple highlights.
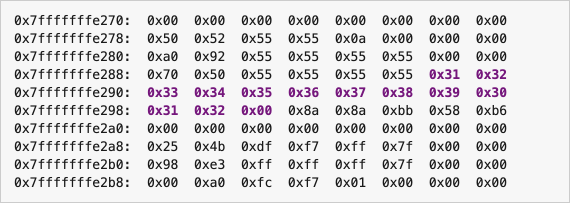
Strangely, stack_string only supports 10 bytes. But what happened when we input 13 characters?
This is a typical buffer overflow, where stack_string overwrites its data in other parts of the program. In our case, this hasn’t caused a problem yet, but it can crash your program or, worse, expose you to serious security issues.
For example, if stack_string is located in memory just before heap_string, then we might overwrite the address pointed to by heap_string. I’m not sure what is in the memory after stack_string. But maybe we can do something strange with it.

Indeed, a buffer overflow was detected
When I deliberately wrote many characters:
 ./test
Enter a string for the stack: 01234567891324143
Enter a string for the heap: adsf
Stack string is: 01234567891324143
Heap string is: adsf
x is: 10
*** stack smashing detected ***: terminated
fish: Job 1, './test' terminated by signal SIGABRT (Abort)
Here I suspect that stack_string has reached the bottom of this function’s stack, so the extra characters will be written in another memory area.
When you deliberately exploit this security vulnerability, it is called stack smashing, and somehow something is detecting this occurrence.
I also find it interesting that although the program was killed, it wasn’t immediately terminated when the buffer overflow occurred – it was only after running a few lines of code post-overflow that the program was killed. So strange!
That’s all about buffer overflow.

Now let’s look at heap_string
We still input bananas into the heap_string variable. Let’s see what it looks like in memory.
This is how heap_string appears in the stack space after we read the string:
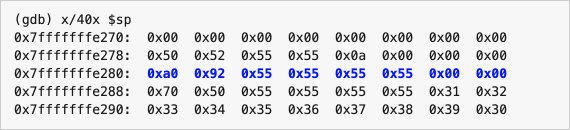
Note that the value here is an address. And this address hasn’t changed, but let’s take a look at the content pointed to in memory.
(gdb) x/10x 0x5555555592a0
0x5555555592a0: 0x62    0x61    0x6e    0x61    0x6e    0x61    0x73    0x00
0x5555555592a8: 0x00    0x00
See, this is the byte representation of the string bananas. These bytes are not on the stack space. They exist in the heap memory.

Where Are the Heap and Stack?
We have discussed that the stack and heap are different memory regions, but how do you know their locations in memory?
Each process has a file called /proc/$PID/maps that shows the memory mapping of each process. Here you can see the stack and heap.
$ cat /proc/24963/maps
... lots of stuff omitted ...
555555559000-55555557a000 rw-p 00000000 00:00 0                          [heap]
... lots of stuff omitted ...
7ffffffde000-7ffffffff000 rw-p 00000000 00:00 0                          [stack]
One thing to note is that heap addresses start with 0x5555, while stack addresses start with 0x7fffff. So it’s easy to distinguish between addresses on the stack and those on the heap.

Using GDB like this is really helpful
This is a bit of a whirlwind tour, and although I haven’t explained everything, I hope seeing the actual data in memory helps you get a clearer understanding of the stack.
I really recommend playing around with GDB like this – even if you don’t understand everything you see in memory, I find that actually seeing the data in my program’s memory makes abstract concepts like stack, heap, and pointers easier to understand.

More Exercises
Here are some ideas for follow-up exercises on thinking about the stack (in no particular order):
test.c and set a breakpoint at the start of that function to see if you can find the stack from main! They say that when you call a function, “the stack gets smaller”; can you see this in GDB?flag string.via: https://jvns.ca/blog/2021/05/17/how-to-look-at-the-stack-in-gdb/
Author: Julia Evans Topic: lujun9972 Translator: amwps290 Proofreader: wxy
This article is originally compiled by LCTT and proudly presented by Linux China.
