
Synthetic Aperture Radar (InSAR) interferometric stacking technology can measure surface deformation.SARscape provides Permanent Scatterer Interferometry (PS-InSAR) and Short Baseline Interferometry (SBAS-InSAR) methods.PS-InSAR method measures the deformation of PS points, while the SBAS-InSAR method measures the deformation of Distributed Scatterer DS points. With the development of technology, many research advancements have been made in this field in recent years.Starting from version SARscape 5.7, a new method has been provided that can extract both PS points and DS measurements simultaneously, namely Enhanced Permanent Scatterer (E-PS) and Enhanced Short Baseline (E-SBAS).
E-PS and E-SBAS both can measure the displacements of PS points and DS pixels simultaneously, leading to more comprehensive interferometric processing results, but following different processing philosophies.E-PS uses adaptive filtering to retain the detail level specific to PS technology.E-SBAS processing can achieve nonlinear motion on the time series of PS and DS pixels. Both techniques have their own characteristics in terms of absolute accuracy, ability to manage discontinuous or nonlinear time series, and coverage.
The processing flow of E-PS is shown in the figure below:
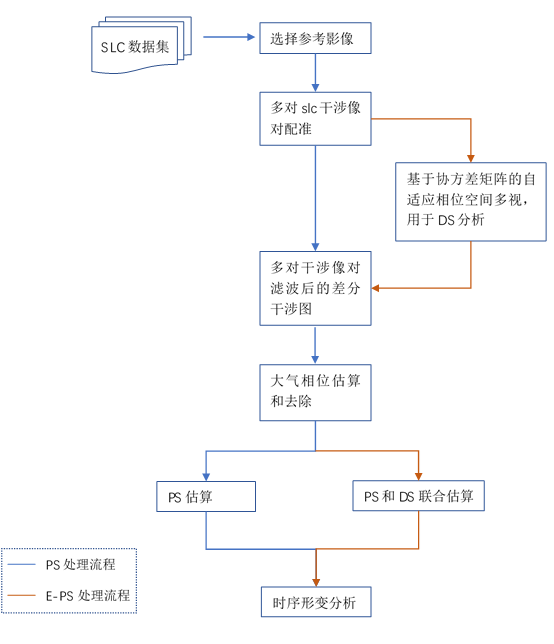
Figure: E-PS Processing Flow
E-PS technology improves InSAR pixel coverage for non-urban areas by adaptively filtering the interferometric phase to identify Distributed Scatterer (DS) and Permanent Scatterer (PS) pixels. This method allows for independent processing of Permanent Scatterer (PS) and Distributed Scatterer (DS).
In SARscape 5.7, the PS operation consists of five steps, with E-PS adding an additional filtering operation after the second step of the PS processing workflow.
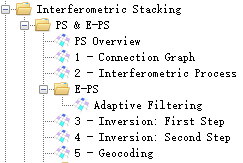
1. Connection Graph Generation
Based on the set baseline threshold, a reference image is selected from the input slc dataset, and other images form interferometric pairs with this reference image.
2. Interferometric Workflow
This step processes each pair of images according to their connection relationships. All images must be registered and resampled to the reference file, involving over-sampling of at least two factors to avoid confusion due to dense interferometric fringes in the case of large baselines. Unlike standard InSAR processing, the PS method seeks point targets, thus spectral shifting and typical Doppler bandwidth filtering are not performed. An interferogram is generated for each image pair from the reference master image.
If E-PS processing is performed, filtering is applied in this step: a filtered interferogram is generated using an adaptive filter.
3. First Inversion
The first generated deformation results include the rate and elevation correction values, which have not removed the atmospheric phase effects.
4. Second PS Inversion
Using the atmospheric correction step, the final deformation results are generated.
5. Geographic Encoding
All PS-related results (deformation rates, height residuals, deformation sequences, KML, vector files, etc.) are projected onto the mapping system.
The processing flow of E-SBAS is shown in the figure below.
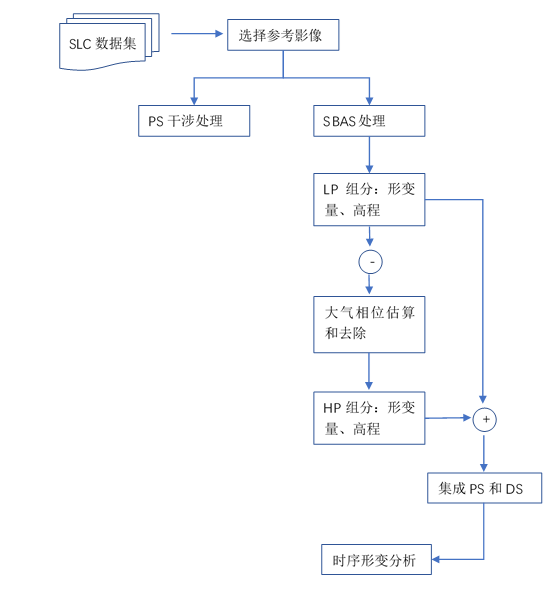
Figure: E-SBAS Processing Flow
Note: Low-pass (LP) and high-pass (HP) terms are used to name the low spatial resolution and residual high spatial frequency components associated with deformation and terrain-related signals.
E-SBAS technology can simultaneously identify and process Permanent Scatterer pixels (PS) and Distributed Scatterer pixels (DS). It combines the use of Short Baseline Sets (SBAS) and Permanent Scatterer Interferometry (PS) methods to obtain deformation products for estimating the temporal deformation of DS pixels and PS points, providing more comprehensive and valuable output results. E-SBAS can measure the nonlinear displacement trends of PS and DS pixels.
The role of SBAS technology is twofold: on one hand, it provides the LP deformation time series corresponding to DS points and the residual terrain map of LP DEM; on the other hand, SBAS estimates the residual atmospheric phase delay affecting the interferometric measurement data after preliminary correction using GACOS products and ionospheric propagation models. The temporal displacement associated with PS points will apply the PS method to process previously calibrated interferograms to remove LP terrain, deformation, and residual atmospheric effects estimated by the SBAS technique. This strategy combines the PS and SBAS methods, ensuring consistency in the deformation results obtained from point targets and DS targets. Therefore, compared to independently executing these two methods, E-SBAS can achieve better results.
E-SBAS method is not simply an independent application of the two technologies; it can analyze strong reflectors and distributed targets simultaneously, providing lower resolution DS results while combining higher resolution PS results in a comprehensive continuous spatial solution that can also analyze nonlinear trends.
Note: It is recommended to use at least 20 scenes of data to obtain reliable results, especially in cases of low coherence.
In the SARscape 5.7 software, the SBAS processing workflow is completed first, followed by the E-SBAS processing.
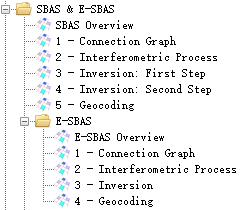
Perform SBAS processing on the SLC dataset first, followed by E-SBAS processing, using the auxiliary files obtained from the last step of SBAS geographic encoding as input files for the first step of E-SBAS, which includes the following four steps:
1. Generate Connection Graph
This function defines the relative combinations and connection networks of SAR to generate multiple differential interferograms. It establishes correspondences for all images, checking whether the baselines of each pair of master-slave images fall within the threshold, registering all data to a master image, which can be automatically assigned or user-selected. Several settings options are provided, such as maximum and minimum baselines, whether to only pair forward, redundancy, and allowed separations, to facilitate image matching.
2. Interferometric Workflow
Interferometric processing is performed for each pair of interferometric images, including interferogram generation, de-flattening filtering, coherence coefficient calculation, and phase unwrapping.
3. Inversion
The inversion step uses the SBAS products from the second inversion of SBAS to initialize the E-SBAS inversion to estimate the atmospheric phase components.
After removing the low-pass components of SBAS and the atmospheric phase part of the signal, model inversion is implemented to derive daily displacement and ultimately fit the high-pass displacement and velocity components.
4. Geographic Encoding
All results are encoded into the chosen geographic coordinate system, and the deformation results can redefine the projection.
Using two sets of SAR data, PS, SBAS, E-PS, and E-SBAS methods were applied to process and analyze the datasets.
-
Sentinel-1, IW: 94 scenes from January 1, 2021, to June 6, 2023
-
TerraSAR-X, stripmap: 64 scenes from January 2021 to June 2023
The deformation maps and point density results obtained from processing the Sentinel-1 dataset using four techniques are as follows:
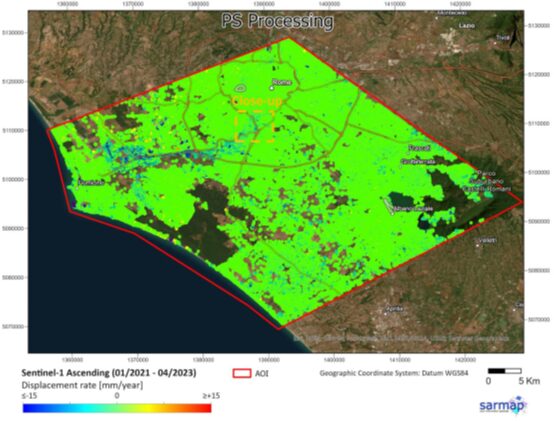
Figure: Sentinel-1 Dataset PS Processing Results
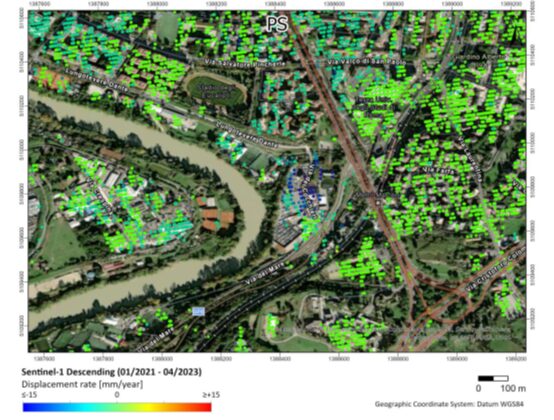
Figure: Sentinel-1 Dataset PS Processing Results Sub-region Display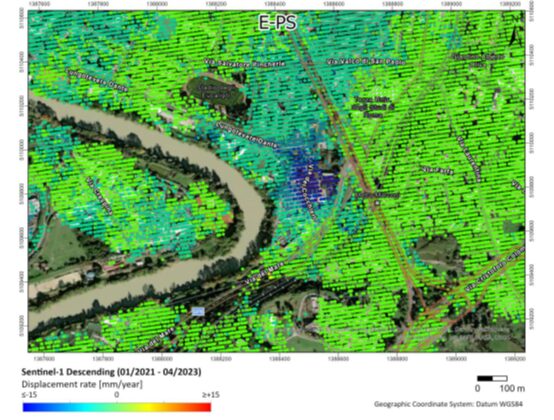
Figure: Sentinel-1 Dataset E-PS Processing Results Sub-region Display
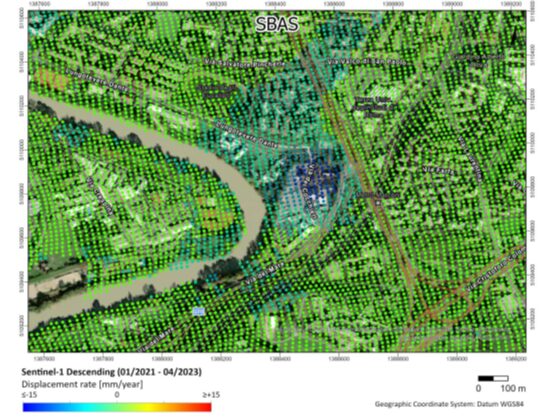
Figure: Sentinel-1 Dataset SBAS Processing Results Sub-region Display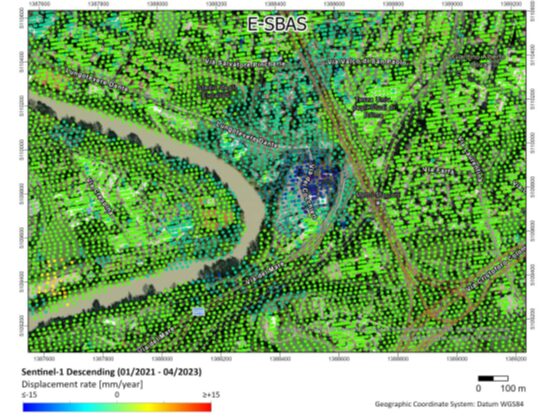
Figure: Sentinel-1 E-SBAS Processing Results Sub-region Display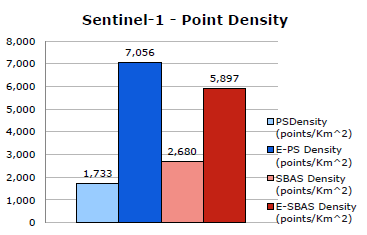
Figure: Sentinel-1 Data Processing Result Time Series Analysis

Figure: Sentinel-1 Dataset Result Point Density Statistics from Different Methods
The deformation maps and point density results obtained from processing the TerraSAR-X dataset using four techniques are as follows:
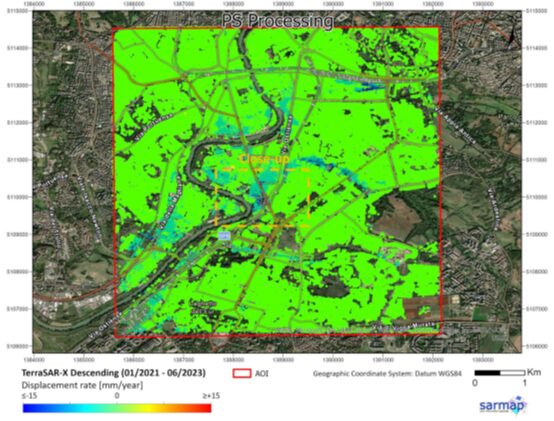
Figure: TerraSAR-X Dataset PS Processing Results
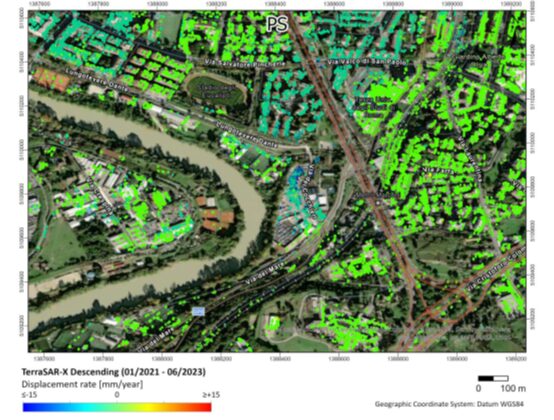
Figure: TerraSAR-X Dataset PS Processing Results Sub-region Display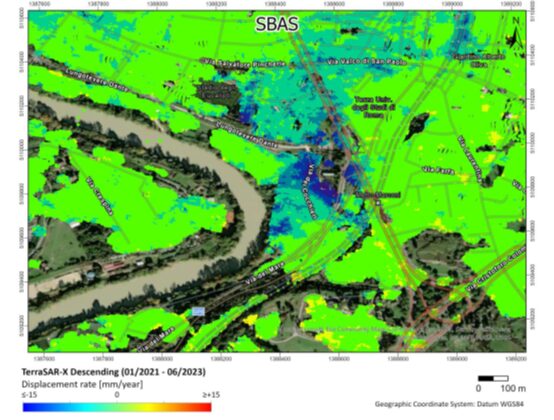
Figure: TerraSAR-X Dataset E-PS Processing Results Sub-region Display
Figure: TerraSAR-X Dataset SBAS Processing Results Sub-region Display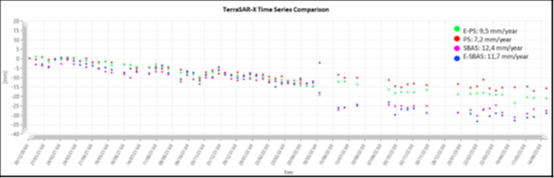
Figure: TerraSAR-X Dataset E-SBAS Processing Results Sub-region Display
Figure: TerraSAR-X Processing Result Time Series Analysis
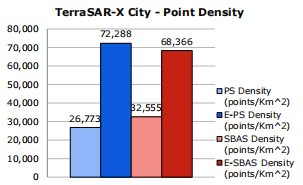
Figure: TerraSAR-X Dataset Result Point Density Statistics from Different Methods
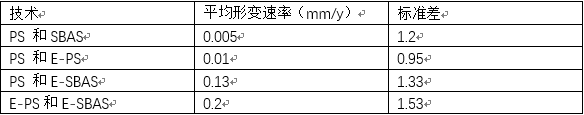
Statistics of the mean and standard deviation of deformation rates obtained from the four methods are shown in the following tables:
Table: Comparison of Deformation Rates Obtained from the Sentinel-1 Dataset
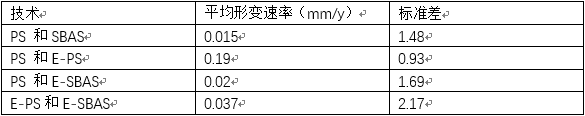
Table: Comparison of Deformation Rates Obtained from the TerraSAR-X Dataset
By comparing and analyzing, the following conclusions can be drawn:
(1) E-PS and E-SBAS methods have significantly improved the point density of results obtained in the same surface coverage area.
(2) Both E-PS and E-SBAS methods can significantly increase point density in the cases of medium-resolution data (Sentinel-1) and high-resolution data (TerraSAR-X).
(3) From the comparison of point density of deformation results obtained from medium-resolution data (Sentinel-1) and high-resolution data (TerraSAR-X), the point density of E-PS is 3-4 times that of PS, and the point density of E-SBAS is also 3-4 times that of PS. E-SBAS is about twice that of SBAS.
(4) Deformation time series analysis shows that the SBAS and E-SBAS methods better describe nonlinear deformation phenomena compared to PS and E-PS methods, with these two techniques complementing each other.