Open Source! An IoT-based energy consumption monitoring system for campuses, completely free, supports real-time collection, transmission, and visualization analysis of energy such as water, electricity, and gas. The hardware is centered around the ESP32, connecting to water flow sensors, current sensors, and gas flow sensors, communicating with the backend via MQTT over WiFi. The backend uses the FastAPI framework, combined with PyMySQL and MySQL database for data storage and querying, and utilizes pandas and numpy for processing and analysis, while incorporating the Prophet model for energy consumption forecasting. The frontend displays real-time and historical energy consumption data using matplotlib and plotly, supporting trend comparison and visualization of forecast results. The system architecture is lightweight and highly extensible, applicable to energy management scenarios in industrial parks, campuses, enterprises, and public buildings, providing technical support for energy conservation and emission reduction as well as smart campus construction.
Source code: https://www.gitpp.com/horizonrobot/project-energy-monitoring
The complete technical documentation framework and core content for the open-source IoT energy consumption monitoring system design, facilitating quick understanding and secondary development for developers:
Technical Documentation for Open Source IoT Energy Consumption Monitoring System
Project Name: IoT-EnergyMonitor Version: v1.0 Open Source License: MIT License (allows commercial use, modification, distribution) Target Scenarios: Energy management scenarios in industrial parks, smart campuses, corporate office buildings, public buildings, etc.
1. System Architecture
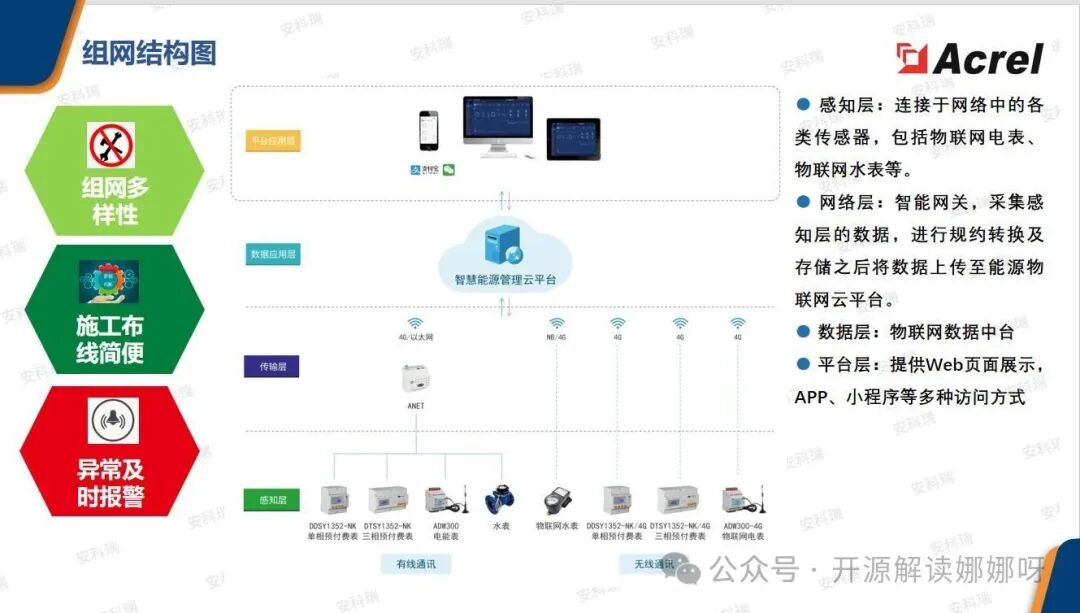
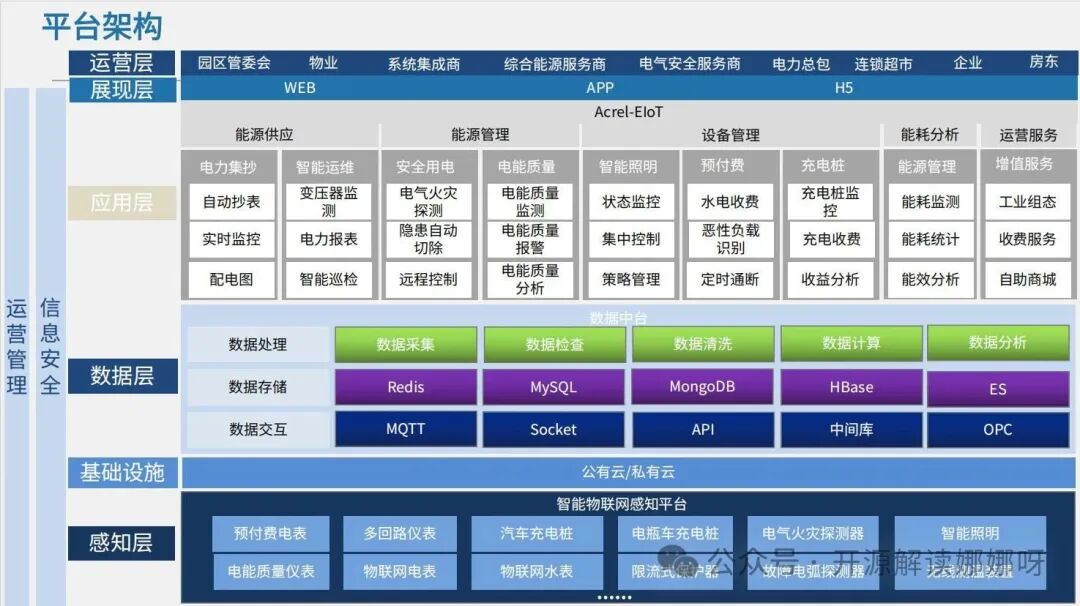
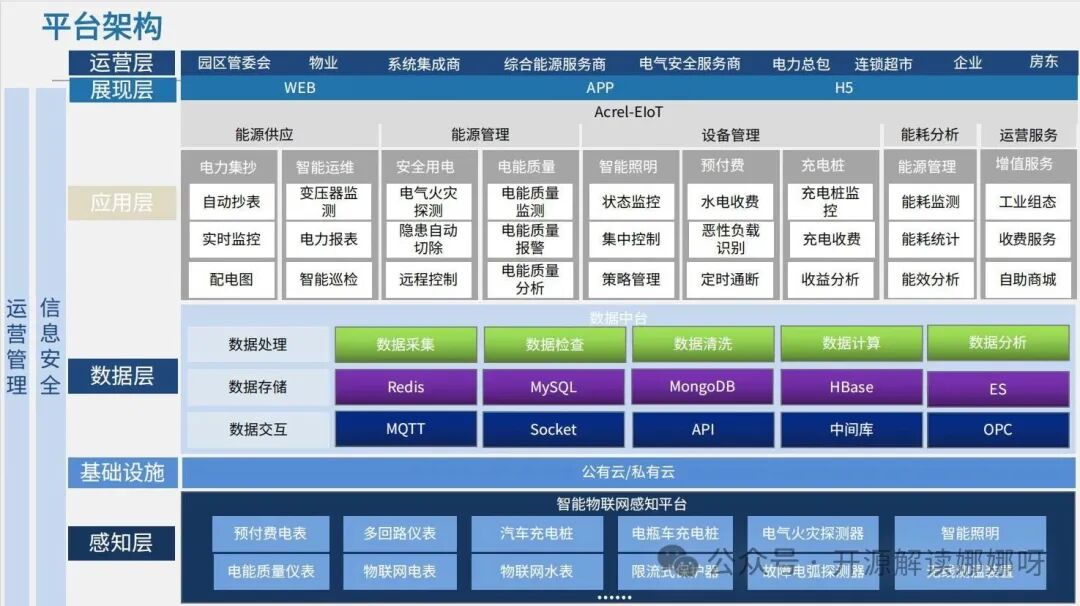
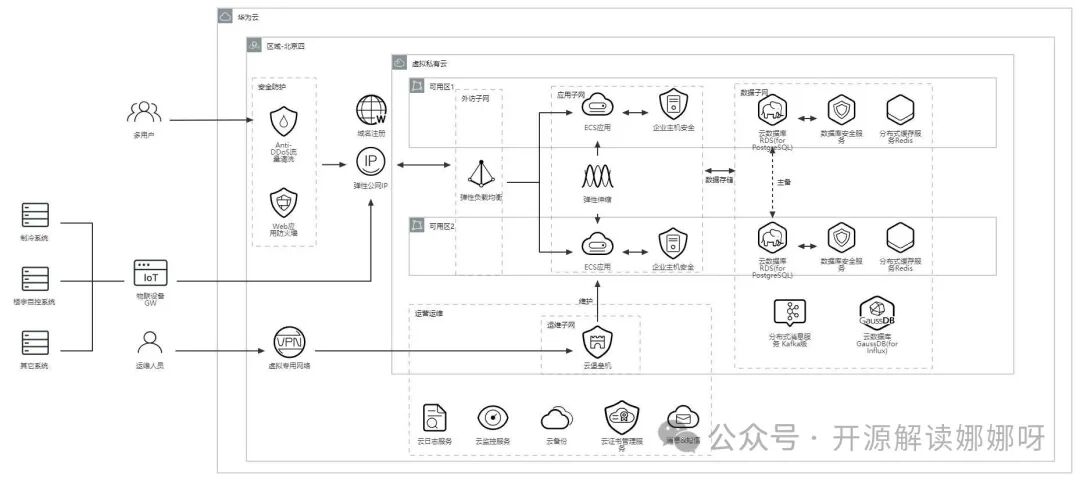
1.1 Overall Architecture Diagram
Hardware Layer (ESP32 + Sensors) → Communication Layer (MQTT/WiFi) → Backend Service Layer (FastAPI + MySQL) → Analysis Layer (Pandas/Prophet) → Frontend Display Layer (Plotly/Matplotlib)1.2 Module Division
| Module | Technology Stack | Function Description |
|---|---|---|
| Hardware Collection End | ESP32 + Water/Electricity/Gas Sensors | Real-time data collection and MQTT protocol upload |
| Communication Layer | MQTT Broker (EMQX/Mosquitto) | Data relay and lightweight message transmission |
| Backend Service | FastAPI + PyMySQL + MySQL | Data storage, API interface, user permission management |
| Data Analysis | Pandas + NumPy + Prophet | Data cleaning, statistical analysis, and energy consumption forecasting |
| Frontend Display | Plotly + Matplotlib + ECharts | Real-time dashboard, historical trends, forecast visualization |
2. Hardware Implementation
2.1 Hardware List
- Core Controller: ESP32 Development Board (supports WiFi/BLE)
- Sensors:
- Water flow sensor (e.g., YF-S201, pulse output)
- Current sensor (e.g., SCT-013, non-invasive)
- Gas flow sensor (e.g., MQ-7, CO detection or vortex flowmeter)
- Communication Module: ESP32 built-in WiFi, or external 4G module (for expansion)
- Power Supply: 5V/12V DC power supply or solar panel (for outdoor scenarios)
2.2 Code Example (ESP32 Side)
#include <WiFi.h>
#include <PubSubClient.h>

// Sensor pin definitions
#define WATER_SENSOR_PIN 34
#define CURRENT_SENSOR_PIN 35
#define GAS_SENSOR_PIN 32

// MQTT configuration
const char* mqtt_server = "your_mqtt_broker_ip";
WiFiClient espClient;
PubSubClient client(espClient);

void setup() {
  Serial.begin(115200);
  WiFi.begin("SSID", "PASSWORD");
  client.setServer(mqtt_server, 1883);
}

void loop() {
  if (!client.connected()) { reconnect(); }

  // Read sensor data
  float water_flow = analogRead(WATER_SENSOR_PIN) * 0.1; // Example conversion
  float current = analogRead(CURRENT_SENSOR_PIN) * 0.5;
  float gas_flow = analogRead(GAS_SENSOR_PIN) * 0.2;

  // MQTT publish
  char payload[256];
  snprintf(payload, sizeof(payload),
           "{\"water\":%.2f,\"current\":%.2f,\"gas\":%.2f}",
           water_flow, current, gas_flow);
  client.publish("energy/data", payload);

  delay(5000); // Collect every 5 seconds
}
3. Backend Service Implementation
3.1 Core FastAPI Interface
from fastapi import FastAPI
from pydantic import BaseModel
import pymysql
from datetime import datetime

app = FastAPI()

class EnergyData(BaseModel):
    water: float
    current: float
    gas: float
    timestamp: datetime = datetime.now()

@app.post("/api/data")
async def save_data(data: EnergyData):
    conn = pymysql.connect(host='localhost', user='root', password='password', db='energy_db')
    cursor = conn.cursor()
    sql = """
    INSERT INTO energy_records (water, current, gas, timestamp)
    VALUES (%s, %s, %s, %s)
    """
    cursor.execute(sql, (data.water, data.current, data.gas, data.timestamp))
    conn.commit()
    return {"status": "success"}

@app.get("/api/history")
async def get_history(start_time: str, end_time: str):
    # Query the database and return historical data (example omitted)
    pass
3.2 Database Design
CREATE TABLE energy_records (
    id INT AUTO_INCREMENT PRIMARY KEY,
    water FLOAT NOT NULL,
    current FLOAT NOT NULL,
    gas FLOAT NOT NULL,
    timestamp DATETIME NOT NULL
);

CREATE TABLE users (
    id INT AUTO_INCREMENT PRIMARY KEY,
    username VARCHAR(50) UNIQUE NOT NULL,
    password_hash VARCHAR(128) NOT NULL,
    role ENUM('admin', 'user') DEFAULT 'user'
);
4. Data Analysis and Forecasting
4.1 Prophet Model Example
import pandas as pd
from prophet import Prophet

# Load historical data from the database
df = pd.read_sql("SELECT timestamp, water FROM energy_records", con=conn)
df.columns = ['ds', 'y']  # Prophet requires column names to be ds and y

# Train the model
model = Prophet(yearly_seasonality=True, daily_seasonality=True)
model.fit(df)

# Forecast for the next 7 days
future = model.make_future_dataframe(periods=7)
forecast = model.predict(future)

# Visualization
fig = model.plot(forecast)
fig.savefig('forecast.png')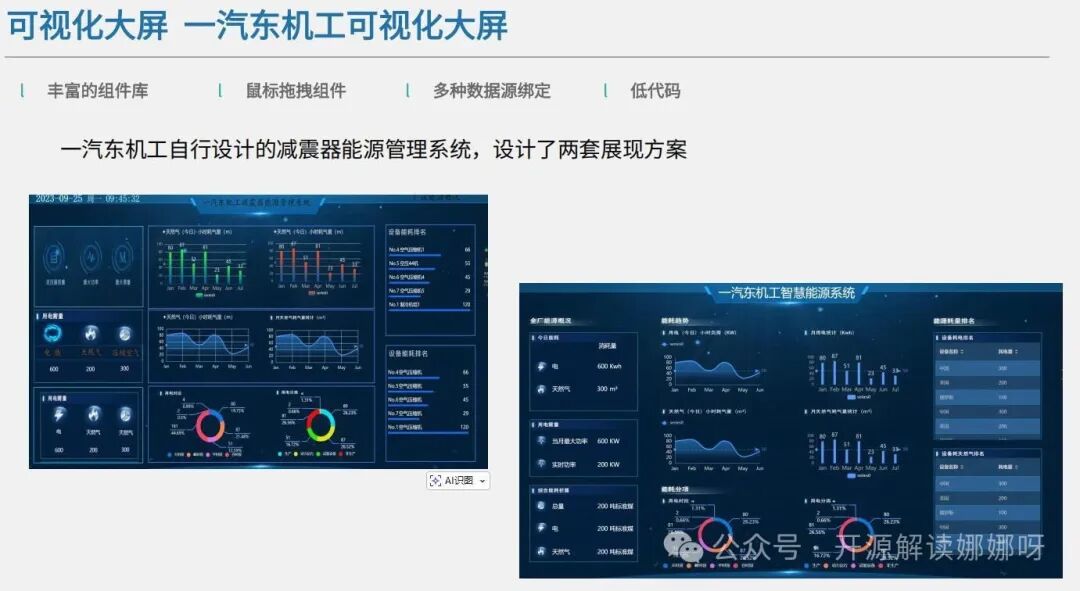
5. Frontend Display
5.1 Plotly Real-time Dashboard Example
import plotly.graph_objects as go
import pandas as pd

# Assume real-time data is obtained from the API
data = pd.DataFrame({
    'time': [...],
    'water': [...],
    'current': [...],
    'gas': [...]
})

fig = go.Figure()
fig.add_trace(go.Scatter(x=data['time'], y=data['water'], name='Water Flow'))
fig.add_trace(go.Scatter(x=data['time'], y=data['current'], name='Current'))
fig.add_trace(go.Scatter(x=data['time'], y=data['gas'], name='Gas Flow'))

fig.update_layout(title='Real-time Energy Consumption', xaxis_title='Time', yaxis_title='Value')
fig.write_html('dashboard.html')
6. Deployment Guide
-
Hardware Deployment:
- Connect sensors to the ESP32 and upload the firmware.
- Configure WiFi and MQTT broker address.
-
Backend Deployment:
# Install dependencies pip install fastapi uvicorn pymysql pandas prophet plotly # Start the service uvicorn main:app --reload --host 0.0.0.0 --port 8000 -
Database Initialization:
mysql -u root -p < schema.sql -
Frontend Access:
- Open a browser and visit
http://<server_ip>:8000/docsto view the API documentation. - Use the HTML file generated by Plotly or integrate it into a web framework (like React/Vue).
- Open a browser and visit
7. Contribution Guidelines
- Code Contribution:
- Fork the repository, create a branch, and submit a PR.
- Follow PEP8 standards and add unit tests.
- Feature Suggestions:
- Submit requirements or bug reports in Issues.
- Participate in discussions on design documents.
- Documentation Improvement:
- Add hardware wiring diagrams, detailed API descriptions, and deployment video tutorials.
Project Repository: GitHub link (example) Contact: [email protected]
This document covers the entire process from hardware to software, allowing developers to directly extend functionality based on example code (such as adding exception alarms, multi-park support, etc.). The lightweight design of the system (ESP32 + FastAPI) is suitable for resource-constrained scenarios, while the Prophet model provides basic intelligent forecasting capabilities, serving as a starting point for smart energy management.
Source code
https://www.gitpp.com/horizonrobot/project-energy-monitoring
A lightweight and highly extensible IoT energy management solution that supports real-time collection, transmission, visualization analysis, and intelligent forecasting of three types of energy: water, electricity, and gas. Completely free and open source, following the open-source license, users can freely deploy, modify, and extend. This system provides a closed-loop management process of “collection – transmission – storage – analysis – visualization” for parks/campuses/enterprises, offering a replicable and easily extensible technical paradigm for energy management, serving as a technical support tool in the fields of smart buildings and energy conservation. Developers, researchers, and corporate users are welcome to use and contribute code for free, jointly promoting the development of green energy management technology!