


Non-Destructive Testing of Batteries Using Electrochemical Impedance Spectroscopy

Non-Destructive Testing of Batteries Using Electrochemical Impedance Spectroscopy
First Author: Roby Soni
Corresponding Authors: Thomas S. Miller, Alexander J.E. Rettie,
Affiliation: University College London, UK
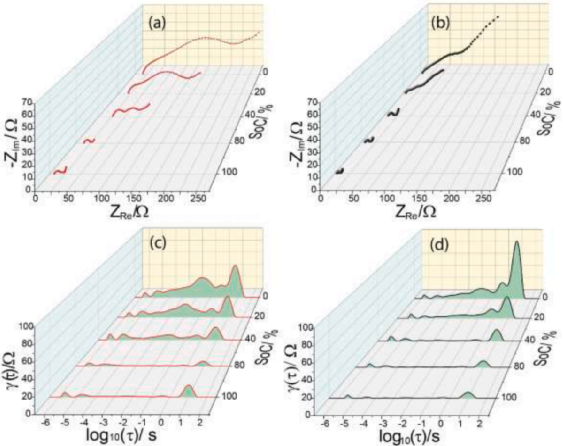
It is well known that Electrochemical Impedance Spectroscopy (EIS) has been widely used for battery analysis due to its simplicity and non-destructive nature. However, the data provided is generally a unified representation of all electrochemical processes within the battery, and many useful pieces of information are indistinguishable when using traditional analytical techniques. This issue is particularly pronounced when EIS is used to analyze systems with complex battery chemistries, such as lithium-sulfur (Li-S) batteries. Here, Professors Thomas S. Miller and Alexander J.E. Rettie from University College London quantitatively analyzed the EIS spectra of commercially available sulfur cathode-based Li-S batteries based on Distribution of Relaxation Times (DRT) technology, revealing the contributions of eight different electrode processes to the total battery polarization, and conducted in-depth analysis and diagnostics of the battery at different states of charge (SoC). The results indicate that DRT features are closely related to battery performance and can be accurately assigned to different battery reaction processes through experiments, which is of significant importance for Li-S battery diagnostics.
The related research titled “Lithium-sulfur battery diagnostics through distribution of relaxation times analysis” was published in Energy Storage Materials.
[Research Background]
Research shows that Li-S batteries undergo many complex battery reactions during cycling, where soluble polysulfides (PS) can easily be transported to the lithium anode, leading to the loss of active sulfur and capacity decay during cycling. Therefore, analyzing the electrochemical processes of Li-S batteries based on non-destructive testing technology is key to enhancing battery performance, and performing in-situ analysis of batteries at different states of charge (SoC) can provide substantial information that helps improve battery stability and extend cycle life. Among the available in-situ techniques, Electrochemical Impedance Spectroscopy (EIS) has been widely used for battery analysis due to its simplicity and non-destructive nature. Unfortunately, traditional EIS analysis, that is, equivalent circuit modeling, often fails to resolve or distinguish relaxation processes occurring within overlapping frequency ranges. For complex systems like Li-S batteries, where multiple reactions occur at both the cathode and anode, the analysis becomes more challenging.
Thus, considering the use of Distribution of Relaxation Times (DRT) technology as an analysis method for Li-S battery systems, DRT technology typically divides the electrochemical model into series of ohmic resistance and polarization impedance. Meanwhile, the polarization process can be expressed with a parallel resistor and capacitor, ultimately corresponding to the characteristic relaxation time τ=RC, where R is the resistor and C is the constant phase element. Therefore, DRT analysis can resolve overlapping relaxation processes into a series of local processes, thus elucidating subtle changes in EIS data. A few previous studies have used DRT to analyze EIS data from Li-S batteries, gaining insights into the intrinsic factors of capacity decay processes. Unfortunately, these studies often rely on symmetrical battery systems or mainly focus on the PS shuttle process, and in the case of testing full batteries, DRT analysis has largely been achieved by using literature data or predicted time constants, rather than experimentally obtaining results using equivalent batteries or electrodes, and many known Li-S battery processes cannot be linked with DRT technology.
[Core Content]
1. Identifying Relaxation Processes Based on DRT Technology
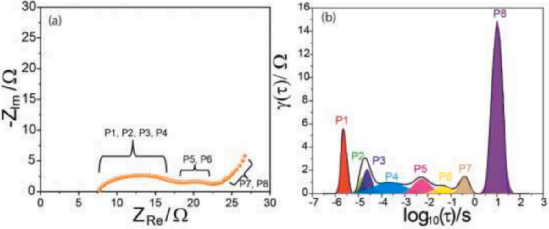
Impedance testing at 100% SoC in a lean electrolyte (E/S=5) is shown in Figure 1a, which contains two semicircles, one in the high-frequency region and one in the mid-frequency region, followed by a diffusion line in the low-frequency region, although specific reactions remain controversial. Meanwhile, the corresponding DRT curve displays eight local regions, with the maximum values representing the contribution of battery processes to the total polarization impedance of the battery. The time constant (τ) characterizes each polarization process, and the area under the peaks represents the contribution of a specific reaction to the overall battery polarization resistance (RP). Therefore, changes in the DRT curve can directly indicate the nature of the electrode reactions and variations in impedance magnitude. Among them, high-frequency P1, P2, P3, and P4 correspond to 2.28, 14.14, 23.6, and 217 µs, respectively, while mid-frequency reactions P5 and P6 correspond to 5.51 and 47.5 ms, and low-frequency diffusion processes P7 and P8 correspond to 0.384 and 10.12 s, respectively. It is interesting to observe two peaks in the diffusion region, indicating two different ionic diffusion mechanisms, a phenomenon that has not been confirmed previously in Li-S batteries.
Non-Destructive Testing of Batteries Using Electrochemical Impedance Spectroscopy
Figure 1. (a) EIS curve of LiS-5 recorded at 100% SoC; (b) corresponding DRT curve of impedance data.
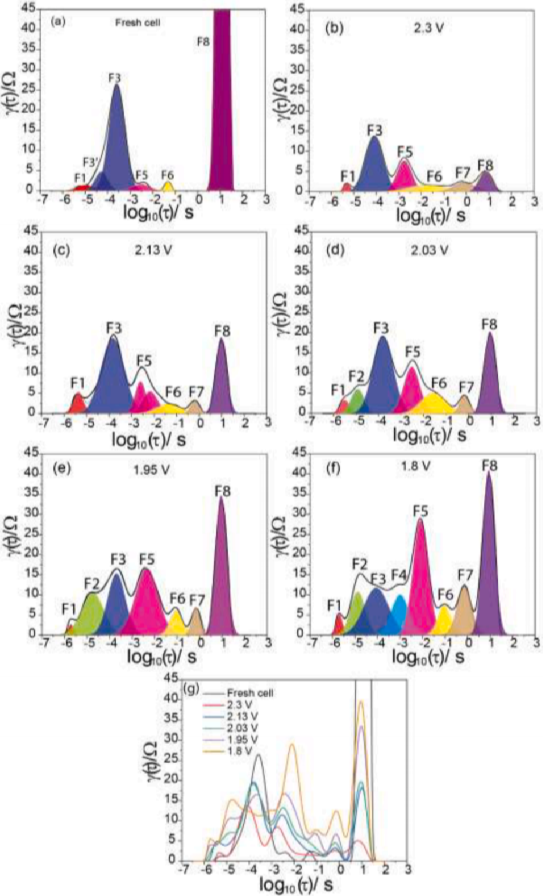
To elucidate the origins of P1-8, their behaviors at different SoCs were monitored. In freshly prepared batteries without any formation processes (100% SoC), the appearance of the DRT curve is relatively simple (Figure 2a). Once discharge begins, DRT becomes very complex; at 2.3 V, sulfur is reduced to PS, the cathode structure changes, producing new pore structures and losing electrode blocking behavior. This effect can be observed in the polarization resistance associated with the ionic diffusion process (F8 at 7.05 s), which significantly decreases from 162 Ω at 100% SoC to 3.70 Ω at 2.30 V (Figure 2b). This is likely related to the increased viscosity of the electrolyte at this potential, leading to more PS formation and dissolution in the electrolyte (Figure 2c). Through the 2.03 V process, precipitation of PS in the cathode and formation of Li2S2 layers are observed, where the changes in DRT are more subtle (Figure 2d). Additionally, when the battery recovers to 100% SoC, it shows some changes in higher polarization resistance and time constant values. These results indicate that the electrode structure and battery performance undergo irreversible changes during the charge-discharge process, likely related to the gradual deposition of Li2S and the reduction of PS at the anode.
Non-Destructive Testing of Batteries Using Electrochemical Impedance Spectroscopy
Figure 2. (a-f) DRT curves of a new battery at 100% SoC, then discharged to 2.3 V, 2.13 V, 2.03 V, 1.95 V, and fully discharged to 1.8 V; (g) combined DRT curves during discharge.
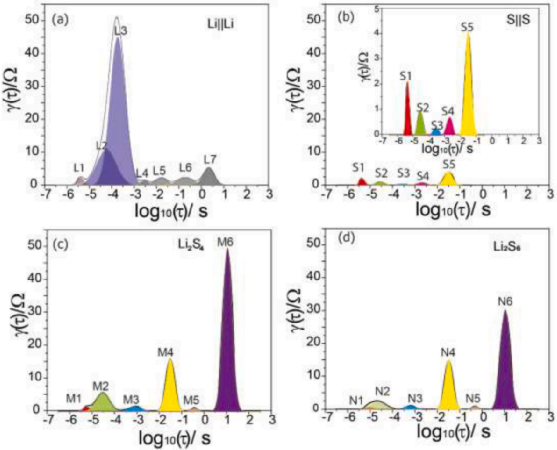
The features observed in the fresh battery (Figure 2a) and symmetrical Li||Li battery (Figure 3a) indicate the origin of P3. The DRT curves of both batteries are very similar, showing a peak close to 250 µs, indicating that the EIS response of the fresh Li||S battery is dominated by the lithium anode; the EIS spectra of the fresh battery and Li symmetrical battery also show similar features in the charge transfer region, consisting of a single broad semicircle. Previous studies have identified lithium ion migration as the rate-determining step in lithium metal anodes, while charge transfer and diffusion processes can be neglected, suggesting that P3 may be closely related to lithium ion migration. The presence of PSs also affects the migration and diffusion characteristics of lithium ions at the anode, manifesting as an increase in the peak area and distribution peak time constants in Li||Li batteries containing Li2S6 electrolyte (Figure 3). Interestingly, once the Li-S battery begins to discharge, the DRT curve changes rapidly; after 2.30 V, the pseudo-peak F3′ merges with F3 to form a single peak with significantly reduced overall area, indicating that an interfacial barrier must be overcome at the lithium anode during battery formation.
Non-Destructive Testing of Batteries Using Electrochemical Impedance Spectroscopy
Figure 3. (a) DRT curve of the lithium symmetrical battery; (b) sulfur symmetrical battery; (c, d) based on carbon paper symmetrical batteries containing 10 mM Li2S4 and Li2S6.
Non-Destructive Testing of Batteries Using Electrochemical Impedance Spectroscopy
Figure 4. Changes in Li-S batteries during charge-discharge processes and corresponding evolution of DRT characteristics.
2. DRT Analysis of Li-S Batteries Under Lean and Rich Electrolyte Conditions
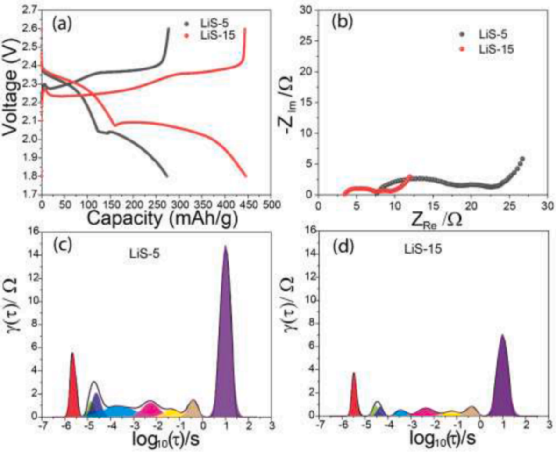
To fully realize the potential of Li-S batteries, their performance must be optimized under lean electrolyte conditions that maximize volume and weight energy density. Therefore, understanding the performance limiting steps of low electrolyte volume batteries is crucial for the commercialization of lithium-sulfur batteries. To this end, in-situ EIS tests were conducted on lean (LiS-5, 5 µl/mgs) and rich (LiS-15, 15 µl/mgs) batteries. Figure 5a shows the charge-discharge curves of the batteries measured at C/20 after formation cycling; the capacity of the lean electrolyte battery is about 273 mAh g-1, which is only 60% of the capacity of the rich electrolyte battery. The larger capacity indicates higher sulfur utilization and is consistent with the increased electrolyte volume that dissolves more PS, i.e., forming more cathode electrolyte.
Non-Destructive Testing of Batteries Using Electrochemical Impedance Spectroscopy
Figure 5. Charge-discharge curves of LiS-5 and LiS-15 recorded at C/20.
Li-S batteries exhibit different electrode reactions at different SoCs, making it necessary to reveal the impact of electrolyte volume throughout the battery’s electrochemical processes. Although LiS-5 and LiS-15 batteries have similar EIS patterns at 100%, 80%, 40%, 20%, and 0% SoC, there are significant differences in their impedance values (Figure 6a, b). Meanwhile, the DRT curves of LiS-5 and LiS-15 at different SoCs are shown in Figures 6c, d, with the RP value of LiS-5 being higher than that of LiS-15, which has a strong correlation with EIS measurements. When the battery discharges to 80% SoC in LiS-5 and 40% SoC in LiS-15, the RP values show gradual changes, after which the discharged batteries show a sharp increase in RP. This indicates that during the early stages of discharge under lean electrolyte conditions, kinetics and mass transport limitations begin to dominate.
Non-Destructive Testing of Batteries Using Electrochemical Impedance Spectroscopy
Figure 6. EIS and DRT analysis at different SoCs.
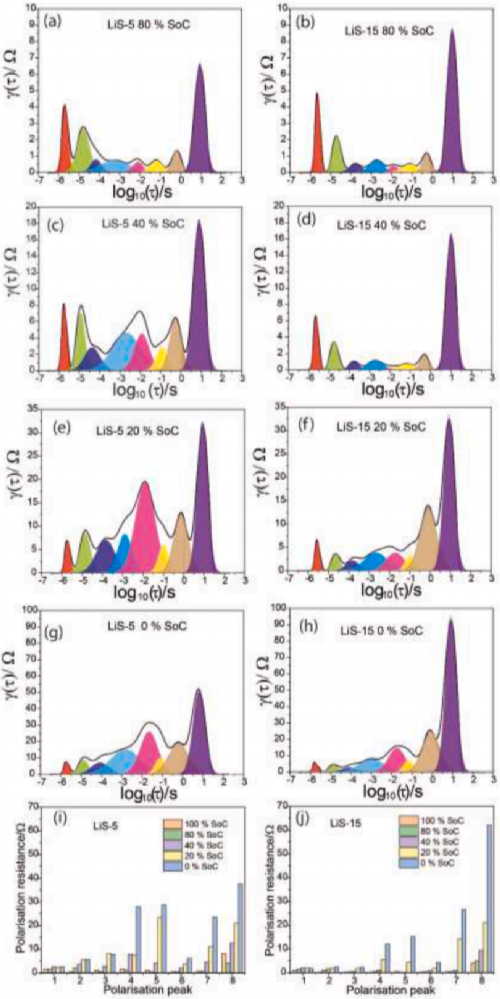
DRT analysis of LiS-5 and LiS-15 at each SoC is shown in Figures 7a-h, with LiS-5 continuing the overall trend of higher RP values, indicating that lean electrolyte conditions significantly affect electrode kinetics and mass transport, although not all polarizations (P1-8) are the same across all SoCs. The different DRT curves of lean electrolyte batteries and rich electrolyte batteries are caused by different PS solubilities, battery conductivities, and electrochemically inert solid precipitates. DRT can quantitatively test various electrode polarizations individually, thus DRT is crucial for understanding the impact of electrolyte content on battery behavior.
At 80% SoC, an increase in RP for LiS-15 can be observed, and the peak in LiS-5 broadens, indicating increased polarization at the electrode surface, which can be attributed to a thicker Li2S layer at the cathode. At 40% SoC, when the conversion of Li2S4 to Li2S2 is ongoing, the peak characteristics of PS reactions and diffusion exhibit a sharp increase in RP, and it is significantly broadened in LiS-5. At 20% SoC, Li2S is insulating and electrochemically inert, exhibiting high ionic diffusion resistance. When the battery is fully discharged to 0% SoC, it shows a very high RP value. However, the RP of the diffusion resistance (P8) in LiS-15 is nearly twice that observed in LiS-5, which primarily results from the dissolution of more PSs in LiS-15, leading to higher diffusion resistance. It can be seen that the diffusion characteristics of Li-S batteries are determined by the complex interactions of PS concentration in the electrolyte and electrode structure, with the dissolution of PS and the deposition of Li2S2/Li2S changing continuously during battery discharge. In Figures 7i-j, the RP values of polarizations P1-P8 in LiS-5 and LiS-15 are compared, showing that P1-P8 in both batteries are directly related to the SoC of the battery.
Non-Destructive Testing of Batteries Using Electrochemical Impedance Spectroscopy
Figure 7. Comparison of DRT curves of LiS-5 and LiS-15 at 100%, 80%, 40%, 20%, and 0% SoC, as well as the evolution of RP for various electrode processes at different SoCs in LiS-5 and LiS-15.
[Conclusion and Outlook]
In summary, this paper analyzes the EIS spectra of Li-S batteries based on DRT, identifying eight characteristic local maxima related to interparticle impedance, double-layer relaxation, anode polarization, and cathode polarization and ionic diffusion resistance. These features represent the “fingerprint” of Li-S batteries. Importantly, the authors found through DRT analysis of original batteries and at different SoCs that the impedance response of Li-S batteries is dominated by the cathode after initial charge-discharge, while the impedance characteristics of original batteries are dominated by the lithium metal anode. During the battery formation cycle, the positions, amplitudes, and number of peaks change somewhat; importantly, during the first charge after discharge, the battery does not return to its original configuration. Studies on lean and rich electrolyte batteries indicate that high electrolyte content can improve electrode kinetics and ionic diffusion, resulting in high capacity, while under lean electrolyte conditions, high polarization resistance is observed throughout the discharge process. More broadly, the results presented here demonstrate the capability of the DRT method to analyze complex electrochemical systems and contribute to the study of other emerging energy storage chemistries, including sodium-sulfur batteries, zinc-ion batteries, metal-air batteries, and more.
[References]
Roby Soni, James B. Robinson, Paul R. Shearing, Dan J.L. Brett, Alexander J.E. Rettie*, Thomas S. Miller*, Lithium-sulfur battery diagnostics through distribution of relaxation times analysis, 2022, Energy Storage Materials.
https://doi.org/10.1016/j.ensm.2022.06.016

Solid-state batteries cycle over 2000 times! Cryo-electron microscopy reveals Li/polymer electrolyte interface design

2022-07-01

Non-Destructive Testing of Batteries Using Electrochemical Impedance Spectroscopy

What to do about rough electrode surfaces? “Quinary electrolyte” aids in achieving uniform lithium deposition

2022-07-01
Non-Destructive Testing of Batteries Using Electrochemical Impedance Spectroscopy

Hunan University EnSM: Potassium ion insertion-deposition mechanism achieves high-performance potassium metal batteries

2022-07-01

Non-Destructive Testing of Batteries Using Electrochemical Impedance Spectroscopy

Professor Ren Xiangzhong’s team from Shenzhen University: In-depth understanding of how the composite method of oxide solid electrolytes affects the performance of solid-state lithium metal batteries

2022-07-01

Non-Destructive Testing of Batteries Using Electrochemical Impedance Spectroscopy

Team Huang Jianyu Small: A new type of all-solid-state battery based on sulfide and PEO composite electrolyte

2022-07-01
Non-Destructive Testing of Batteries Using Electrochemical Impedance Spectroscopy

Is “SEI easily dissolvable” a benefit or a drawback? Professor Lynden A. Archer’s latest SEI “reaction-dissolution” new mechanism

2022-06-30

Non-Destructive Testing of Batteries Using Electrochemical Impedance Spectroscopy

Different “DOL Open Loop Polymerization”! Professor Lynden A. Archer’s latest AM

2022-06-30
Non-Destructive Testing of Batteries Using Electrochemical Impedance Spectroscopy

Professor Tan Guoqiang from Beijing University of Technology and others: Thermochemical cyclization constructs high-energy lithium-ion batteries using high-nickel layered oxide cathodes with bridging double coating layers

2022-06-30
Non-Destructive Testing of Batteries Using Electrochemical Impedance Spectroscopy

Capacity/rate performance dual enhancement! Constructing insertion/alloy-type anodes to achieve high-performance batteries

2022-06-30

Non-Destructive Testing of Batteries Using Electrochemical Impedance Spectroscopy

Prussian blue derivatives modified separator aids high power lithium metal batteries

2022-06-30

Non-Destructive Testing of Batteries Using Electrochemical Impedance Spectroscopy

Leave a Comment