This article mainly references the mathematical model established by Fu Baopu (1992) in “The Impact of Topography and Altitude on Precipitation,” which reflects the relationship between precipitation, topography, altitude, and climatic conditions, to solve for the altitude at which precipitation in mountainous areas reaches its maximum value. No detailed formula derivation will be provided, this is simply a record.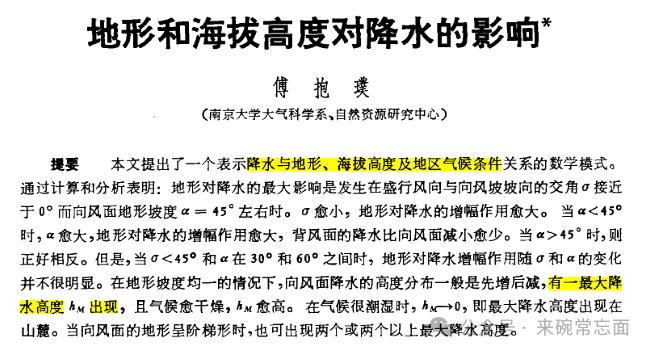
- Definition and Formula
The Maximum Precipitation Height refers to the turning point where precipitation in mountainous areas first increases and then decreases with altitude, that is, the altitude at which precipitation reaches its maximum value.At this point, precipitation satisfies: Where precipitation P is:
 (For details of each parameter, see the original text)Thus, we can obtain the transcendental equation:
 The equation cannot be solved directly; graphical methods must be used. The specific method is as follows.Define the functions:
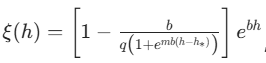 and
and By plotting the curves of the above two functions as they change with h, the x-coordinate of their intersection is the maximum precipitation height.The codeHere, we mainly control other variable parameters fixed, focusing on the impact of atmospheric relative humidity on the maximum precipitation height!
import numpy as np
import matplotlib.pyplot as plt

# Parameter settings
def set_parameters(R0=0.9):
    """Set model parameters"""
    params = {'R0': R0,  # Relative humidity at the foot of the mountain (0-1)
              'm': 0.0255 / 1.7e-4,  # Parameter (controls function shape)
              'b': 1.7e-4,  # Comprehensive parameter (Equation 24)
              'q': 1.6e-4,  # Precipitation efficiency parameter (Equation 24)
              'h_star': -np.log(R0) / (0.0725 * 6.5e-3),  # Saturation height h* (Equation 12)
              'P0': 155.7,  # Precipitation at the foot of the mountain (mm/month)
              'M': 329.6  # Topographic amplification parameter (mm/month) caused by topographic uplift
              }
    return params

# Define functions ξ(h) and ζ(h)
def xi(h, params):
    """Function ξ(h)"""
    term = 1 - params['b'] / (params['q'] * (1 + np.exp(params['m'] * params['b'] * (h - params['h_star']))))
    return term * np.exp(params['b'] * h)

def zeta(h, params):
    """Function ζ(h)"""
    term1 = 1 / (1 + np.exp(-params['m'] * params['b'] * params['h_star'])) - params['P0'] / params['M']
    term2 = (1 + np.exp(params['m'] * params['b'] * (h - params['h_star']))) ** (1 / params['m'])
    return term1 * term2

# Solve for h_M (intersection point)
def find_hM(params, h_range=np.linspace(0, 5000, 1000)):
    """Solve for h_M through function intersection"""
    h_values = h_range
    xi_values = [xi(h, params) for h in h_values]
    zeta_values = [zeta(h, params) for h in h_values]

    # Find intersection point
    diff = np.abs(np.array(xi_values) - np.array(zeta_values))
    idx = np.argmin(diff)
    h_M = h_values[idx]
    return h_M, h_values, xi_values, zeta_values

# Plotting function
def plot_functions(params, h_M, h_values, xi_values, zeta_values, filename=None):
    """Plot ξ(h) and ζ(h) curves and intersection point"""
    plt.figure(figsize=(10, 6))
    plt.plot(h_values, xi_values, label=r'$9(h)$', color='blue', linewidth=2)
    plt.plot(h_values, zeta_values, label=r'$6(h)$', color='red', linewidth=2)
    plt.axvline(x=h_M, linestyle='--', color='gray', label=f'$h_M$ = {h_M:.1f} m')
    plt.scatter(h_M, xi(h_M, params), color='k', zorder=5, s=100)
    plt.xlabel('$h$ (m)', fontsize=14)
    plt.ylabel('Function Values', fontsize=14)
    plt.title(f'ξ(h) and ζ(h) Functions\n'$R_0$ = {params["R0"]}', fontsize=16)
    plt.legend(fontsize=12)
    plt.grid(True, linestyle='--', alpha=0.7)
    if filename:
        plt.savefig(filename, dpi=300, bbox_inches='tight')
    plt.show()

# Main program
if __name__ == "__main__":
    # Case 1: Default parameters (humid climate)
    params = set_parameters(R0=0.9)
    h_M, h_values, xi_values, zeta_values = find_hM(params)
    plot_functions(params, h_M, h_values, xi_values, zeta_values, filename="case1.png")

    # Case 2: Dry climate (R0=0.607)
    params_dry = set_parameters(R0=0.607)
    h_M_dry, h_values_dry, xi_values_dry, zeta_values_dry = find_hM(params_dry)
    plot_functions(params_dry, h_M_dry, h_values_dry, xi_values_dry, zeta_values_dry, filename="case2.png")

    # Case 3: Extremely dry climate (R0=0.2)
    params_steep = set_parameters(R0=0.2)
    h_M_steep, h_values_steep, xi_values_steep, zeta_values_steep = find_hM(params_steep)
    print(f"In extremely dry climate, h_M = {h_M_steep:.1f} m")
    plot_functions(params_steep, h_M_steep, h_values_steep, xi_values_steep, zeta_values_steep, filename="case3.png")
-
Results
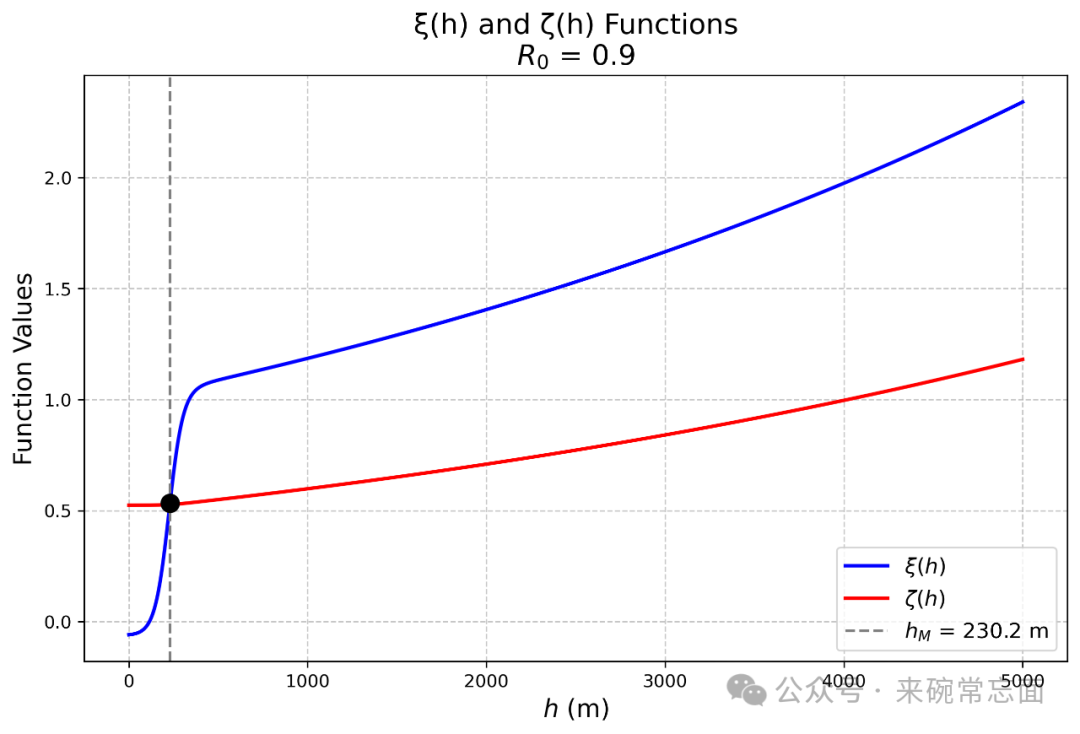
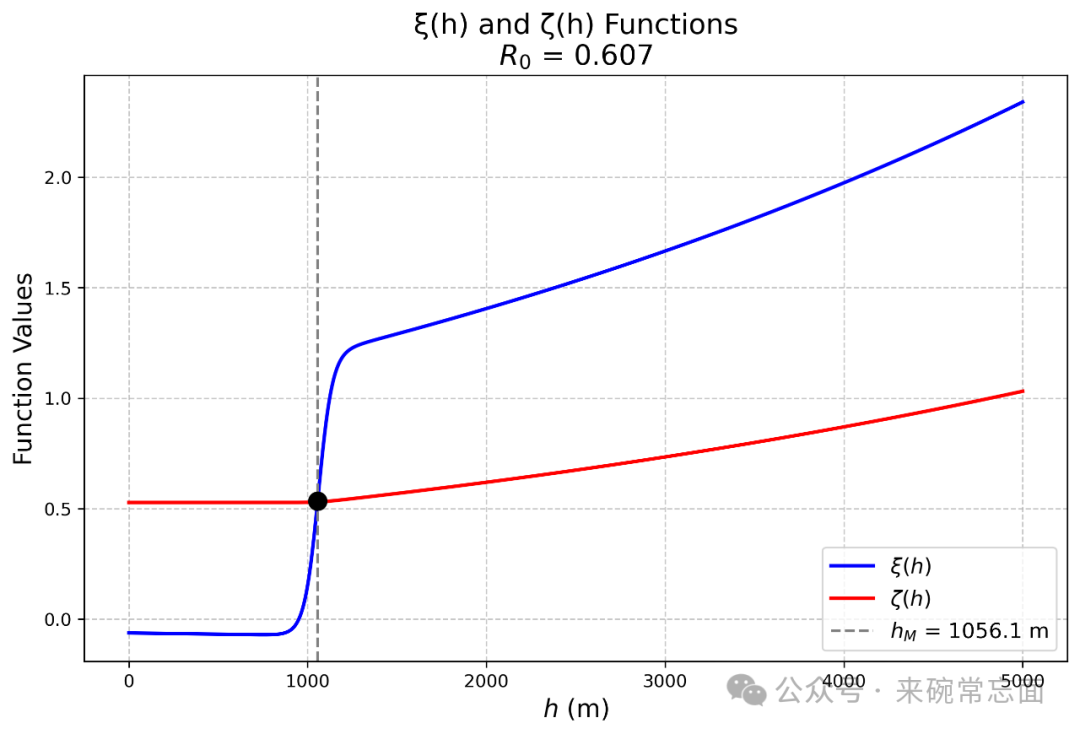
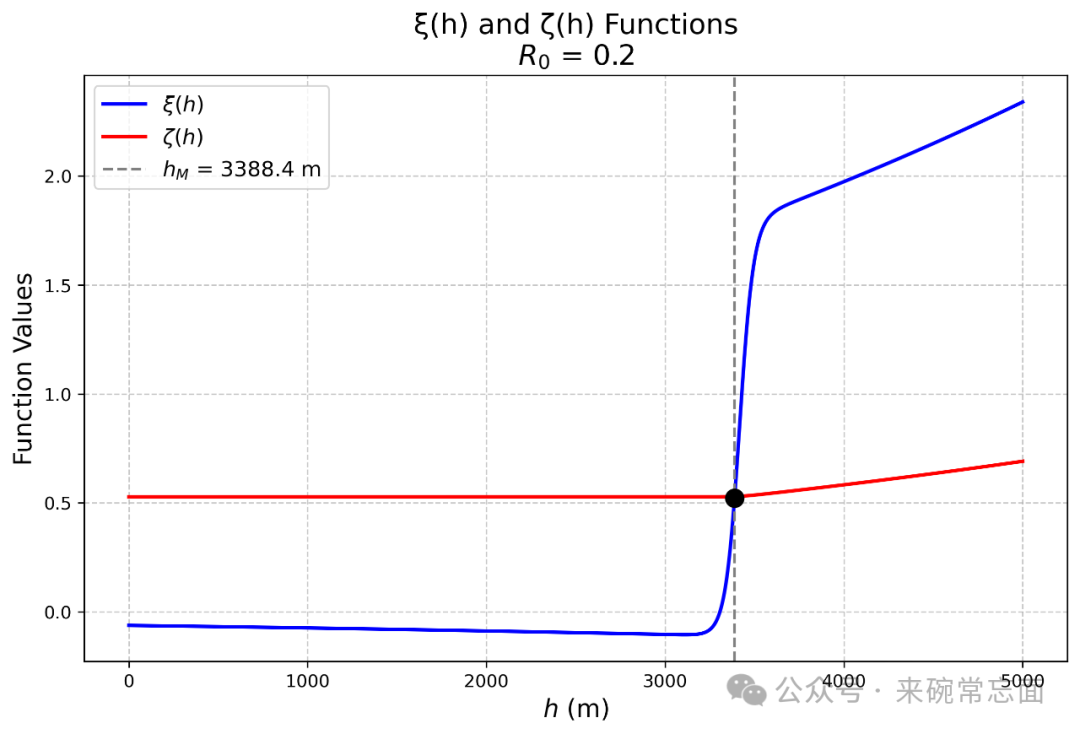 It can be observed that, with factors such as topographic slope, uplift rate, the angle between the prevailing wind direction and the windward slope, and atmospheric stability remaining constant, as atmospheric humidity decreases, the maximum precipitation height gradually increases! In humid climate zones, there is sufficient low-level moisture, which quickly saturates after uplift, resulting in precipitation concentrated at low altitudes. In dry climate zones, the atmosphere must be lifted to higher altitudes to reach saturation, hence the maximum precipitation height is higher.This content is merely a simple discussion based on previous viewpoints and is for reference only!