
MATLAB Visualization of Summer Sea Surface Flow Field
Author: The Eighth Galaxy – Xiang Xianjun
Email: [email protected]
close all;clear;clc;
% Data import and assign NaN values
load("D:\matlab2022\toolbox\uvssh.mat");  ssh(ssh<-99999)=NaN;
% Set base map to Miller projection, determine longitude and latitude range
m_proj('miller', 'lon',[105140], 'lat',[025]);
% Draw coastline map, fill with RGB gray, remove land contours
m_coast('patch', [0.750.750.75], 'edgecolor','none');hold on
%% Data processing
% Remove all rows and columns of length 1 from the first layer of u matrix
u1 = squeeze(u(:,:,1))';
% Remove all rows and columns of length 1 from the first layer of v matrix
v1 = squeeze(v(:,:,1))';
% Sparsification process
llon = lon(1:4:end);
llat = lat(1:4:end);
lu1 = u1(1:4:end, 1:4:end);
lv1 = v1(1:4:end, 1:4:end);
[llon1,llat1] = meshgrid(llon, llat);
%% Draw sea surface height contour map
[c, h] = m_contourf(lon, lat, ssh', 500);
set(h, 'linestyle', 'none');
colormap(m_colmap('divering'));
%% Draw 2D vector map
q = m_quiver(llon1, llat1, lu1, lv1, 1, 'k');hold on
axis image
hold on
%% Image detail processing
% Adjust colorbar
cb = colorbar;
cb.Label.String = 'SLA [m]';
set(cb,'Location','southoutside', 'FontName','Times New Roman');
hold on
% Add text
str1 = 'Summer';
text(-0.28, 0.42, str1, 'fontsize',8, 'FontName','Times New Roman', 'FontWeight','bold');
% Border outline style is black and white striped
m_grid('box','fancy');
%% Image display and save
print('sla_velocity_scs_wp.png','-dpng','-r150');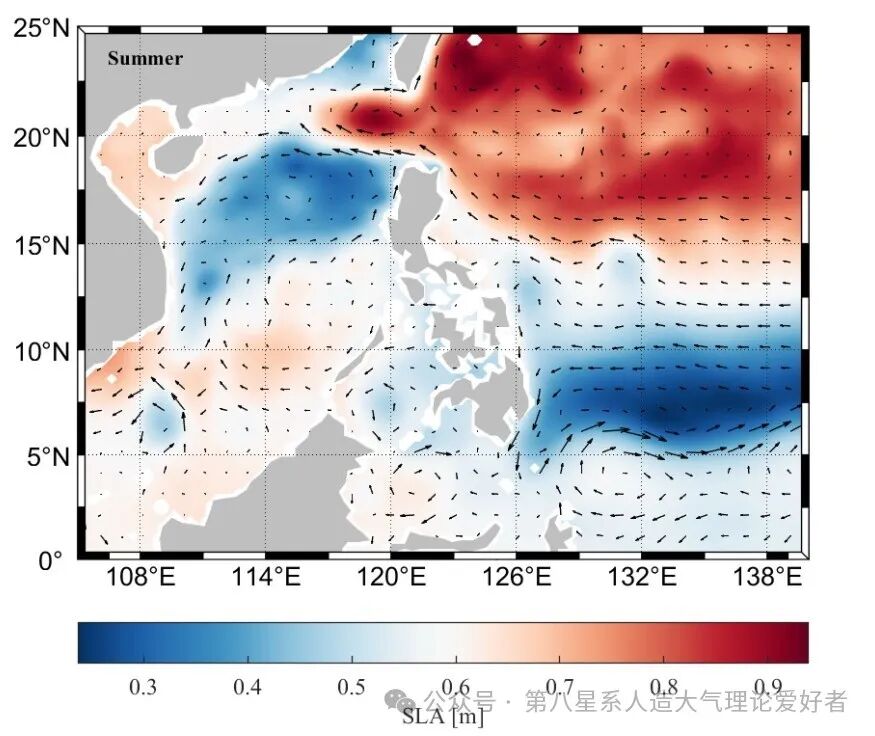
END