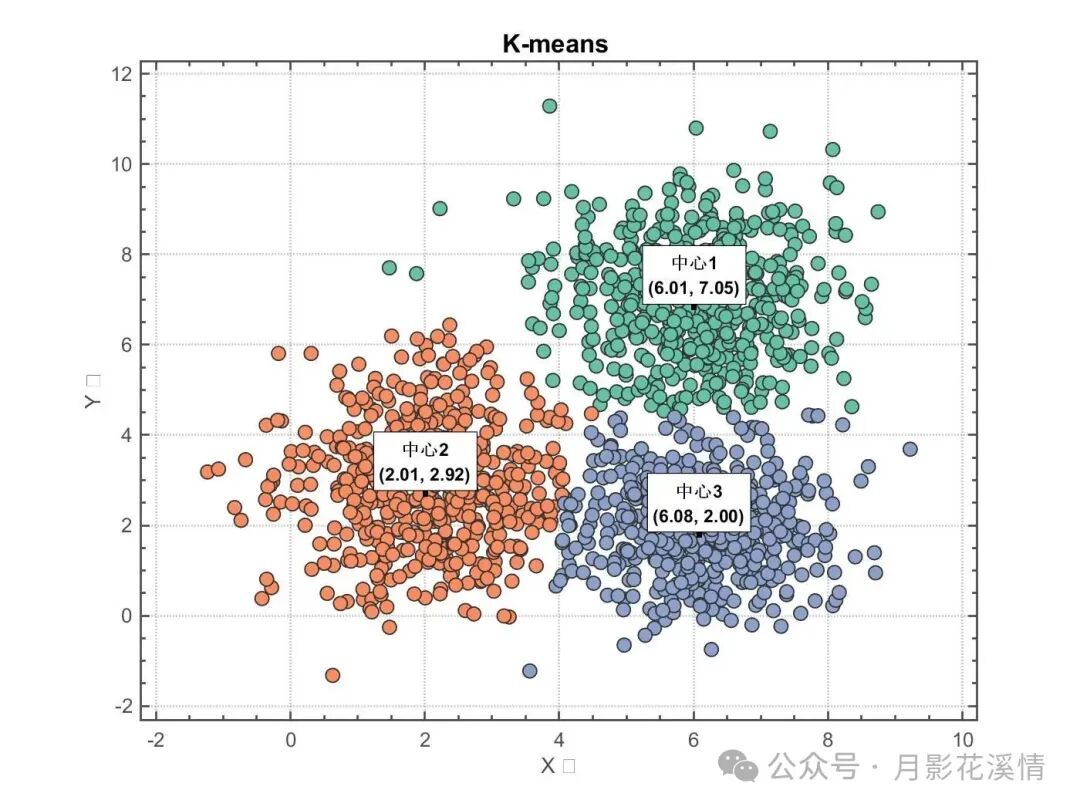
Today, I bring you the K-means clustering in MATLAB, which is a powerful tool in MATLAB that can automatically segment data into meaningful groups. Recently, I’ve been quite busy and tired, and with the weather getting colder, I feel less inclined to exercise.
rng(42); % Set random seed
% Generate three different distributed datasets
PntSet1 = mvnrnd([2 3], [1 0; 0 2], 500);
PntSet2 = mvnrnd([6 7], [1 0; 0 2], 500);
PntSet3 = mvnrnd([6 2], [1 0; 0 1], 500);
X = [PntSet1; PntSet2; PntSet3];
% Execute K-means clustering
K = 3;
[idx, C] = kmeans(X, K);
% Define color scheme
colorList = [
0.40 0.76 0.65; % Teal
0.99 0.55 0.38; % Orange
0.55 0.63 0.80; % Blue
0.23 0.49 0.71; % Dark Blue
0.94 0.65 0.12; % Gold
0.70 0.26 0.42; % Dark Red
0.86 0.82 0.11 % Yellow
];
% Create figure window
figure(‘Position’, [100, 100, 800, 600]);
hold on
% Plot scatter plot
for i = 1:K
% Plot data points for each cluster
scatter(X(idx == i, 1), X(idx == i, 2), 60, colorList(i, :), …
‘filled’, ‘LineWidth’, 0.8, ‘MarkerEdgeColor’, [0.2 0.2 0.2]);
end
% Plot cluster centers (using larger markers)
for i = 1:K
scatter(C(i,1), C(i,2), 200, ‘Marker’, ‘+’, ‘LineWidth’, 3, …
‘MarkerEdgeColor’, ‘k’, ‘MarkerFaceColor’, ‘k’);
end
% Add legend
legend_labels = cell(K, 1);
for i = 1:K
legend_labels{i} = sprintf(‘Cluster %d’, i);
end
legend([legend_labels; {‘Cluster Center’}], ‘Location’, ‘best’, ‘FontSize’, 12);
% Set axis properties
ax = gca;
ax.LineWidth = 1.2;
ax.Box = ‘on’;
ax.TickDir = ‘in’;
ax.XMinorTick = ‘on’;
ax.YMinorTick = ‘on’;
ax.XGrid = ‘on’;
ax.YGrid = ‘on’;
ax.GridLineStyle = ‘:’;
ax.GridAlpha = 0.3;
ax.XColor = [0.3, 0.3, 0.3];
ax.YColor = [0.3, 0.3, 0.3];
ax.FontWeight = ‘normal’;
ax.FontName = ‘Arial’;
ax.FontSize = 11;
% Set title and labels
title(‘K-means Clustering’, ‘FontSize’, 14, ‘FontWeight’, ‘bold’);
xlabel(‘X Axis’, ‘FontSize’, 12);
ylabel(‘Y Axis’, ‘FontSize’, 12);
% Set axis limits for better visualization
xlim([min(X(:,1))-1, max(X(:,1))+1]);
ylim([min(X(:,2))-1, max(X(:,2))+1]);
% Add grid and beautify
grid on;
% Display cluster center coordinates
for i = 1:K
text(C(i,1), C(i,2)+0.5, sprintf(‘Center %d\n(%.2f, %.2f)’, i, C(i,1), C(i,2)), …
‘HorizontalAlignment’, ‘center’, ‘FontSize’, 10, …
‘FontWeight’, ‘bold’, ‘BackgroundColor’, ‘white’, …
‘EdgeColor’, ‘black’, ‘Margin’, 3);
end
hold off;
% Output clustering statistics
fprintf(‘Clustering results statistics:\n’);
for i = 1:K
cluster_size = sum(idx == i);
fprintf(‘Cluster %d: %d points (%.2f%%)\n’, i, cluster_size, cluster_size/size(X,1)*100);
end
fprintf(‘\nCluster center coordinates:\n’);
for i = 1:K
fprintf(‘Cluster %d center: (%.2f, %.2f)\n’, i, C(i,1), C(i,2));
end
The results are as follows: