Click the blue text above to follow our public account, where we share a LabVIEW case every day.
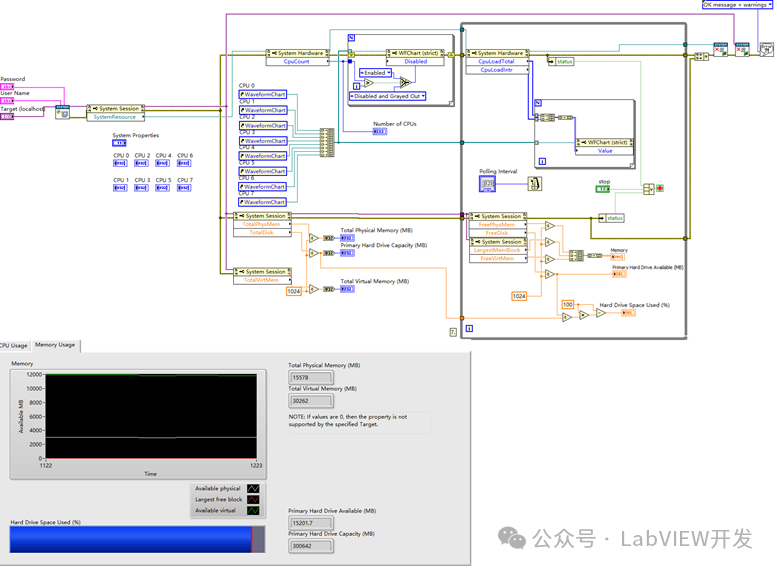
The tool utilizes NI System Configuration to monitor the total and available status of CPU, disk, and memory resources on target devices (such as RT controllers and local hosts), visually presenting the data in waveform and numerical formats to grasp system resource load and ensure stable device operation.
System resources (CPU, disk, memory) are the core support for device operation, and their usage status directly reflects device performance and load. “Resource monitoring” collects resource usage data through low-level interfaces and presents it in visual or numerical forms, which is essential for fault diagnosis, performance optimization, and system operation and maintenance, making it a key aspect of engineering equipment management.
Function Description
-
System Session and Hardware Reference
-
Function: Establish a system session with the target device to obtain a reference channel for hardware resources (such as CPU count and load).
-
Usage Scenario: The starting point for all system resource monitoring scenarios, which is a prerequisite for resource data collection.
-
Features: Supports authentication (username and password) to ensure the legality of resource access; can collect data across devices (local/remote RT targets).
-
Usage Notes: Ensure the target device is network reachable and has sufficient permissions; sessions should be properly closed after use to free up resources.
-
CPU Resource Monitoring
-
Function: Collect data on the number of CPU cores, total load, interrupt load, etc., and dynamically display it through waveforms.
-
Usage Scenario: Scenarios that require analysis of CPU load distribution (such as multi-core task scheduling and performance bottleneck diagnosis), such as real-time testing systems and industrial control device maintenance.
-
Features: Automatically adapts to the number of CPU cores (up to 8 cores displayed, excess cores are grayed out), with strong data real-time performance.
-
Usage Notes: Polling intervals should be set reasonably (to avoid excessive resource consumption with too short intervals or data lag with too long intervals); pay attention to “interrupt load” to diagnose the impact of hardware interrupts on the CPU.
-
Similar Function Comparison: Compared to the CPU monitoring in Windows Task Manager, it is better suited for NI RT devices and supports detailed load display for multi-core systems, meeting the monitoring needs of embedded real-time systems.
-
Memory Resource Monitoring
-
Function: Collect total and available amounts of physical and virtual memory, as well as the size of the largest contiguous memory block.
-
Usage Scenario: Scenarios that require diagnosing memory leaks or assessing whether memory capacity meets task requirements, such as large data acquisition and real-time simulation systems.
-
Features: Covers both physical and virtual memory dimensions, reflecting the degree of memory fragmentation (largest contiguous block); some parameters (virtual memory) may display as 0 due to system compatibility.
-
Usage Notes: Virtual memory parameters should be judged in conjunction with the target system’s compatibility; pay attention to the “largest contiguous memory block” to assess the feasibility of large memory allocation tasks.
-
Similar Function Comparison: Compared to professional memory analysis tools (such as Valgrind), it is more lightweight, integrated into the NI system configuration ecosystem, suitable for rapid memory state assessment at the engineering level.
-
Disk Resource Monitoring
-
Function: Collect total disk capacity and available space, and calculate disk usage rate.
-
Usage Scenario: Scenarios that require monitoring storage device load (such as data recording devices and embedded system storage) to avoid task interruptions due to insufficient disk space.
-
Features: Can visually present disk usage rates, with data update real-time performance determined by polling intervals.
-
Usage Notes: Ensure the target device’s disk is mounted; when disk usage approaches 100%, timely cleaning or expansion is required.
About Us
This is a feature introduction of LabVIEW. For more usage methods and development cases, please visit our official website for more information. If you need LabVIEW project collaboration, please contact us. Join our public account to stay updated on the latest technology trends.13691203761 Manager Wang (Mobile WeChat)