
Source: Old Thousand and His Friends
Original Author: Sun Qian
Before elaborating on the Time-of-Flight Secondary Ion Mass Spectrometry technology, let’s first review the basic concepts and principles of Secondary Ion Mass Spectrometry.
1 What is Secondary Ion Mass Spectrometry (SIMS)?
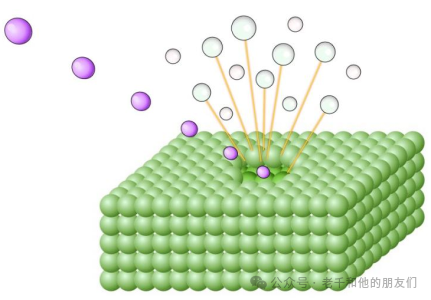
Secondary Ion Mass Spectrometry (SIMS) is a technique used to study solid surfaces by bombarding the sample surface with a focused primary ion beam and analyzing the ejected secondary ions(as shown in the figure below). By measuring the mass of the secondary ions, the elements, isotopes, and/or molecular composition of the surface can be determined.
SIMS instruments consist of the following basic elements:
1TheIon Source,2Ion Lens, used to accelerate primary ions and focus them onto the sample,3Sample Chamber and Stage,4Mass Analyzer, which separates secondary ions based on their mass-to-charge ratio,5Detection System, used to count the types of ions of interest.
1.1 Mass Analyzers in SIMS
The mass analyzers used in SIMS instruments mainly include three types.
Quadrupole Mass Analyzer: Separates mass through a resonant electric field, allowing only selected masses to pass through. Although quadrupole mass analyzers can scan the entire mass spectrum, their ability to apply stable fields allows control over which secondary ions can pass through. As fewer ions are scanned per cycle (only those within the selected mass-to-charge ratio range), these analyzers can significantly improve sensitivity to specific mass peaks.
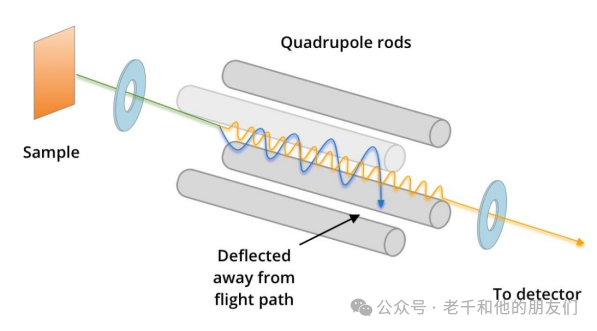
Figure 1 Quadrupole Mass Analyzer Working Principle: Quadrupole uses a resonant electric field applied to secondary ions to make them resonate at specific frequencies. If the resonance is stable (as indicated by the yellow wave), these ions will pass through the detector. If the resonance is unstable (as indicated by the blue wave), they will be deflected and cannot pass through the detector. The resonant electric field is set so that ions with the desired mass achieve stable resonance and are thus detected.
Magnetic and Electrostatic Sector Mass Analyzers: Combining electrostatic and magnetic analyzers can be used to separate secondary ions based on their mass-to-charge ratio. Magnetic fields deflect ions based on their mass, with lighter ions being deflected more than heavier ions (with the same charge). This is helpful when it is necessary to refocus or separate specific ions. The operation of the electrostatic analyzer is similar to that of the magnetic analyzer, except that they use electric fields to focus ions based on their kinetic energy.
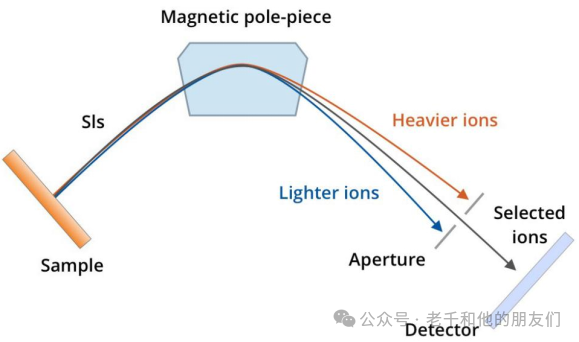
Figure 2 Magnetic and Electrostatic Sector Mass Analyzer Working Principle: Secondary ions are deflected by a magnetic field based on their mass, so only selected ions reach the detector through the exit slit.
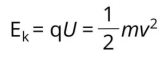
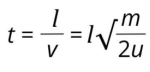
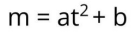
Time-of-Flight Mass Analyzer: Separates ions based on their speed in a field-free drift path. Secondary ions with the same charge enter the analyzer with the same kinetic energy (Ek). Their speed (v) and the time of flight through the drift path vary with their mass (m), as determined by the formula Ek=1/2mv².
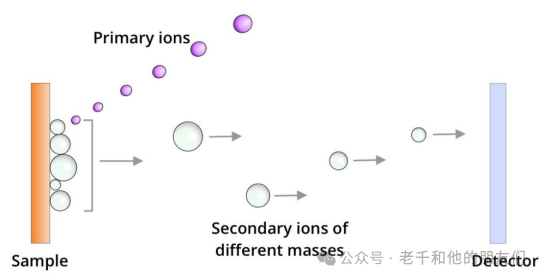
Figure 3 Time-of-Flight Mass Analyzer Working Principle: In the time-of-flight analyzer, secondary ions are separated based on their mass.
1.2 Applications of SIMS
SIMS is used to analyze the distribution and relative concentration of elements, molecules, and isotopes in solid samples under ultra-high vacuum conditions, making it one of the most sensitive surface analysis techniques. SIMS can be used for imaging, spectral analysis, and depth profiling/three-dimensional analysis.
Applications include:
Earth Sciences: Trace element analysis, stable isotope analysis, geochemistry, and geological dating.
2 Interaction of Ions with Samples
Here we consider the bombardment of a monoenergetic ion beam (i.e., all impacting ions have the same energy) that releases particles from the sample.
Generally, ions are generated by:Electron bombardment of gaseous atoms or clusters, plasma sources (such as dual proton accelerators), thermal emission, or field ionization (such as liquid metal ion guns). The generated ions are then accelerated to energies in the kiloelectronvolt range to produce an ion beam.
When the ion beam strikes the sample, the incident ions penetrate the surface of the sample and dissipate energy through collisions with atoms in the sample. In turn, the recoil of these atoms can displace other atoms, resulting in a series of collisions, some of which point towards the sample surface. If the momentum transfer of the surface atoms is sufficient to overcome their binding energy, these atoms will be ejected from the sample.
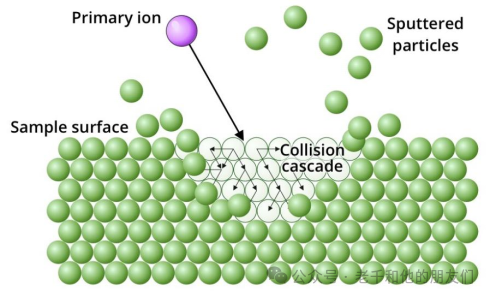
Figure 4 Particles ejected or “sputtered” include atoms and molecules, most of which are electrically neutral. The ions that are ejected by the bombardment—”secondary ions”—are directed to the mass analyzer by an electric field, and only these ions will be analyzed.
Since particles must be both emitted from the sample and ionized to be detected, the signal strength of the generated secondary ions X+ or X– depends on:X’s fractional concentration, the incident ions’ (sputtering yield), and the proportion of charged particles (ionization probability). All of these are strongly influenced by the chemical environment (often referred to as the “matrix”). For example, the secondary ions produced from oxidized metal surfaces can be one to three orders of magnitude higher than those from corresponding unoxidized surfaces. Therefore, determining concentration based on SIMS signal strength usually requires calibration standards of varying concentrations for specific analytes, which is often impractical.
Although the depth of penetration of the incident ions (primary ions, PI) is in the range of several tens of nanometers, it leaves a damaged area behind. However, most (>95%) of the sputtered particles come from the top two atomic layers. Therefore, SIMS has the potential to provide very specific surface composition analysis.
However, since each incident ion (PI) impact causes local changes in surface composition, if the analysis is to be limited to the sample surface, it is necessary to avoid analyzing in these damaged areas. To do this, the PI dose can be controlled to remain below 1013 cm-2, or more cautiously, below 1012 cm-2. Traditionally, analyses below this threshold are referred to as “static SIMS” because the analysis assumes there is no change to the sample surface.
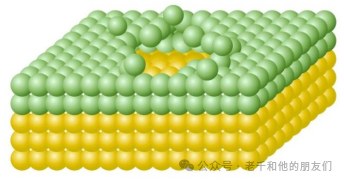
Figure 5 Schematic of the damaged area on the sample surface after the impact of incident ions. Initially, most of the particles ejected after impact come from the top two atomic layers (green). This causes the underlying atoms (yellow) to be impacted in the same position by subsequent impacts.
Since the yield of secondary ions decreases with decreasing PI dose, the inevitable result of working under static conditions is a decrease in signal strength. Therefore, for analyses aimed at detecting low-abundance elements (such as dopants), or when surface specificity is not critical, working within the static limit may not be practical.
Competitive requirements for working within or outside the static limit will influence the type of PI source, mass analyzer, and detector used. These will be discussed later. Historically, this has led to the division of secondary ion mass spectrometers into so-called “Static” and “Dynamic” types.
3 Static SIMS vs. Dynamic SIMS
SIMS analysis is sometimes distinguished based on the ion flux of ions in the incident ion beam (the number of ions impacting per square centimeter of the sample) into “static” and “dynamic”. Compared to static SIMS, dynamic SIMS uses a much higher primary ion flux, leading to greater penetration of the sample (from nanometers to microns). This also provides greater sensitivity for analyzing low-concentration ions (such as dopants and low-abundance isotopes).
Static SIMS has a lower incident ion flux, which reduces the analysis depth, making the technique more surface-specific. It also reduces fragmentation, favoring the analysis of molecular species.
Since different instruments can adopt different operational modes, the following will focus on the types of instruments used.
|
Static SIMS |
Dynamic SIMS |
|
Low flux |
High flux |
|
Typically uses gold, bismuth, gallium ions |
Typically uses oxygen or cesium ions |
|
Aiming at the topmost atomic and molecular ions |
Eroding continuous layers of the sample (nanometers to microns) |
|
Suitable for characterization of molecules, isotopes, and elements |
Suitable for characterization of isotopes and elements |
|
Typically analyzed using time-of-flight mass spectrometers |
Typically analyzed using magnetic sector or quadrupole mass spectrometers |
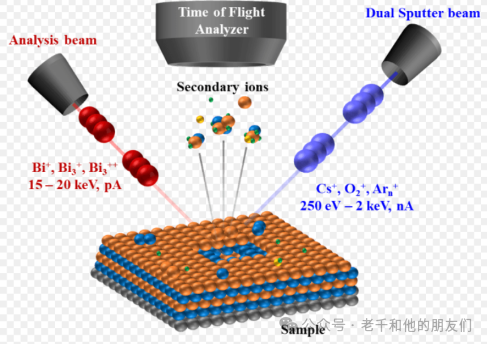
4 Time-of-Flight Secondary Ion Mass Spectrometer (ToF-SIMS)
Modern ToF-SIMS instruments generally use liquid metal ion guns (LMIG) as the ion (PI) source. Compared to electron impact sources, plasma sources, or surface ionization sources, liquid metal ion guns provide higher “brightness” (i.e., current density, about 1010 Am-2 sr-1) and a narrower ion beam. The brightness and diameter of the ion beam are key to achieving sub-micron spatial resolution imaging.
LMIG emitters consist of fine tungsten needles within a metal container. When melted, the metal flows over the tungsten needle forming a thin layer. A high voltage extraction field is applied at the needle tip (radius less than 1 micron) to produce ion emission.
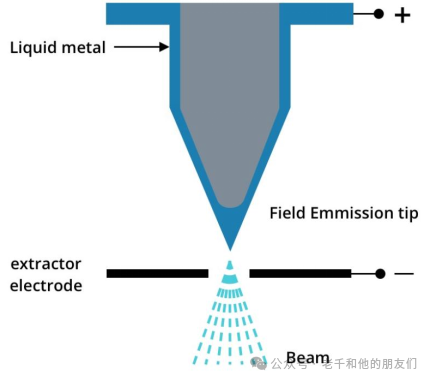
Figure 6 Schematic of LMIG emitter generating an ion beam
Early LMIGs used Ga (M = 69 u); however, since secondary ion (SI) yield typically increases with the mass of the primary ion, the sources of ToF-SIMS instruments now typically employ heavier elements such as Au (197 u) or Bi (209 u). Most of the emitted ions are monatomic and monovalent ions; however, cluster ions (Aunm+ and Binm+) are also present in the incident ion beam. Due to the larger mass of these ions, they can further enhance SI yields; however, as m and n increase, the proportion of cluster ions gradually decreases, offsetting the corresponding increase in signal strength.
The advantage of cluster ions is that they can provide higher molecular SI relative yields. This is because ion clusters break upon impact, distributing total energy among n atoms. This “softens” the interaction of the ions with the target, reducing fragmentation within the sample.
Additionally, clusters can provide more larger secondary ions, which is particularly beneficial for the analysis of polymers and biological samples, leading to the development of larger PI sources, such as C60+ and gas clusters (such as Arn+, n=102). Generally, these cluster ions cause less chemical damage to the molecules in the sample; thus, the rate of signal intensity decline (attenuation) associated with these larger SIs is not rapid. On the other hand, cluster ions sources are not as bright as LMIGs, and spatial resolution is also poorer.
As previously mentioned, to avoid significant damage to the sample surface, a low PI dose must be maintained. Therefore, the ion current reaching the sample must be in the picoamp range. However, to achieve stable emission from the emitter, the beam current must be in the microamp range.
To achieve the desired picoamp range, the continuous ion beam emitted from the emitter needs to be pulsed. The continuous ion beam emitted from the emitter is deflected before reaching the aperture. The deflection voltage is periodically turned off for about 20-50 nanoseconds, allowing the incoming ion beam to pass through the aperture.
To achieve good mass resolution (m/Δm), it is necessary to shorten the length of each pulse to below 1 ns. Simply shortening the time the ion packet passes through the aperture adversely affects the SI signal strength and spatial resolution.
On the contrary, the pulse is usually compressed along its moving axis (slowing down the front end of the pulse relative to the back end, or accelerating the back end of the pulse relative to the front end), or both (compressing the pulse around its center). This compression is generally referred to as bunching.
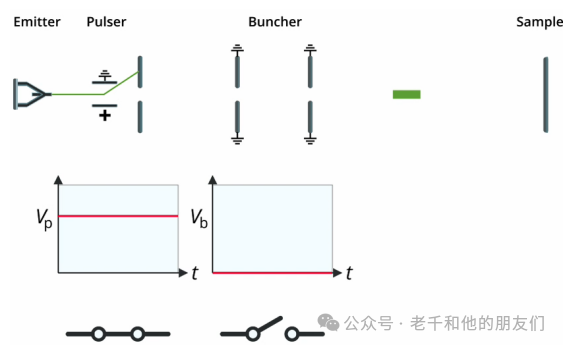
Figure 7 . 1 By applying voltage (Vp) to the deflection plate located in front of the aperture on the pulse generator, the continuous incoming ion beam from the emitter can be deflected.
2 By intermittently turning off Vp and then turning it back on, the ion beam is cut into pulses and passes through the aperture.
3 When entering the buncher, an entrance aperture is applied with a voltage (Vb), which accelerates the ions in the pulse.
4 The ions at the back of the pulse stay longer in the buncher than those at the front, thus they are accelerated for a longer time. Therefore, they start to “catch up” with the ions in front, compressing the length of the pulse, but at the same time losing focus.
5 The settings of the buncher are designed to achieve the minimum pulse length when the ions reach the sample.
A negative consequence of bunching is the increased diffusion of ion energy within the pulse, leading to chromatic aberration, thus reducing the focusing capability of the ion beam. The spatial resolution of unbunched ion beams can exceed 100 nanometers, while that of bunched ion beams is typically greater than 1 micron.
However, the mass resolution of bunched ion beams exceeds 10,000, while that of unbunched ion beams is about 100.
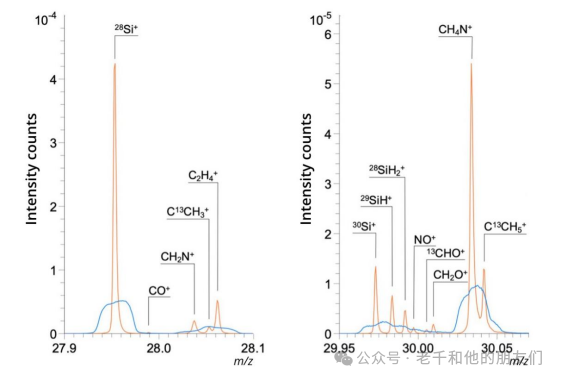
Figure 8 Positive ion spectra obtained from silicon wafers. The blue shows data from unbunched ion pulses, while the orange shows data collected from bunched pulses. All other instruments and collection parameters are the same. The signals assigned to ions not containing silicon are the result of surface contamination such as organic compounds in the air.
To resolve the contradiction between mass and spatial resolution, various methods have been developed. For example, dividing unbunched pulses into “pulse trains”, and bunching them before entering the mass analyzer (“delayed extraction”). The availability of these techniques depends on the supplier and model of the ToF-SIMS instrument used. These details are beyond the scope of this discussion and will not be elaborated further.
5.1 Time-of-Flight Analyzers—Overview
The Time-of-Flight (ToF) analyzer measures the time required for secondary ions (SI) to reach the detector, which is a function of their mass and charge. The SI sputtered from the surface is collected by an extractor, which releases it into a tube via a pulsed switch, and then through the tube to the detector.
From the sample surface, ions with the same charge are accelerated to the same kinetic energy (Ek) by the extractor, thus, due to the relationship Ek=1/2mv², heavier SIs (larger m) travel at lower speeds, resulting in longer times to reach the detector. Lighter ions travel faster and will reach the detector before heavier ions.
Charge on SI also affects the time it takes to reach the detector. Two ions with the same mass but different charges have different kinetic energies. Ions with larger charges will reach the detector before those with smaller charges.
The schematic diagram of these two concepts is shown below.
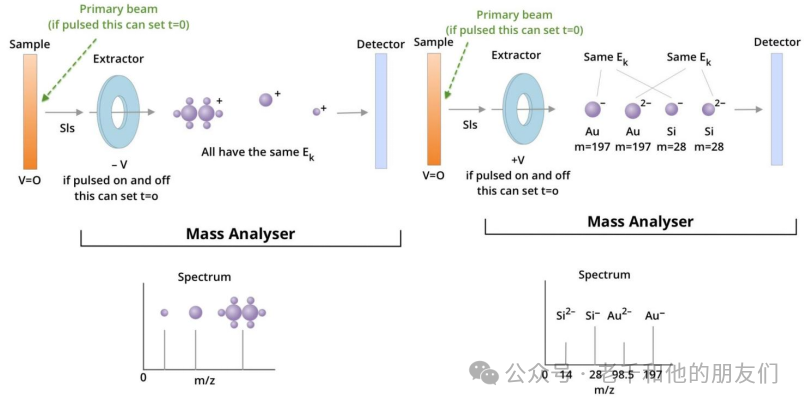
Figure 9. This illustrates the incident ion beam striking the sample and releasing secondary ions (SI). There is a voltage difference between the sample and the extractor, which determines the polarity of the ions to be collected. SIs are collected by the extractor, setting a time t0 for each SI entering the selector. Additionally, t0 can sometimes be set by a pulsed ion beam, allowing scattered ion packets to strike the sample at continuous t0s. Setting t0 is necessary for calculating flight time.
Left figure: shows several monovalent SIs separated by mass, and how they correspond to peaks on the spectrum.
Right figure: shows ions of different masses and different charges separated based on both. The kinetic energy of divalent ions passing through the extractor is equivalent to that of monovalent ions multiplied by two, thus traveling faster through the selector.
It should be noted that ions are separated by mass-to-charge ratio, which is displayed on the x-axis of the spectrum.
After the incident ion (PI) pulse strikes the sample, the sample immediately releases secondary ions (SI). Through the potential gradient between the sample and extractor, these ions are accelerated to the mass analyzer.The extractor is located at the entrance of the selector, and the voltage it generates is referred to as the extraction voltage (U). The direction of this gradient determines the polarity of the SIs extracted during the analysis process.The typical value of U is about 2 kilovolts, and its working distance (the distance between the sample and the entrance of the selector) is several millimeters.
After entering the selector, the SIs drift in a field-free region of about 2 meters before reaching the detector.
The relationship between the mass of the ions and their flight time is precisely the origin of the name of this selector.
According to the formula, two ions of the same mass should take exactly the same time to reach the detector.
But in reality, the kinetic energy of ions when sputtered from the surface can slightly vary (affected by instrument and sample factors). This leads to variations in their flight times (Δt), resulting in changes in their measured masses (Δm).
Consequently, slight differences in kinetic energy are also manifested as peak broadening in the mass spectrum (i.e., mass resolution m/Δm), thus increasing the uncertainty in peak determination. To improve resolution, ToF SIMS instruments typically use one of two designs of selectors to enhance “energy focusing”: reflectrons or electrostatic sector analyzers (ESA).
The resolution of the selector will determine the extent to which closely spaced masses can be distinguished. For example, sulfur has a mass of 32.07, while the mass of an oxygen molecule is 2 x 15.99 = 32.00.
Reflectron-TOF: The reflectron ToF selector ensures that ions of the same mass reach the detector simultaneously, regardless of slight variations in their energy. This is achieved by reflecting ions with an ion mirror. Compared to lower energy ions, higher energy ions will move further toward the ion mirror before being reflected. This allows ions of the same mass and charge to be focused and reach the detector simultaneously, regardless of their kinetic energy. Additionally, using a reflectron can increase the flight path, thereby improving the resolution of the mass spectrometry.
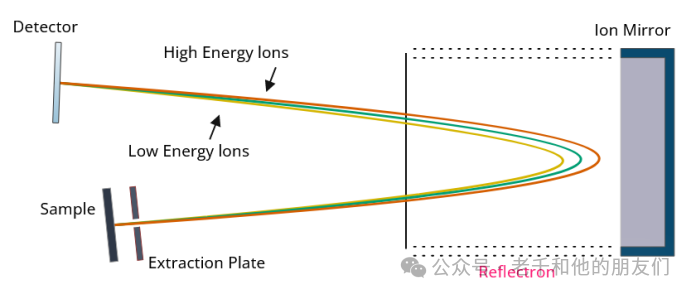
Figure 10 illustrates how the reflectron ToF selector utilizes an ion mirror to reflect ions of different energies, allowing them to reach the detector simultaneously.
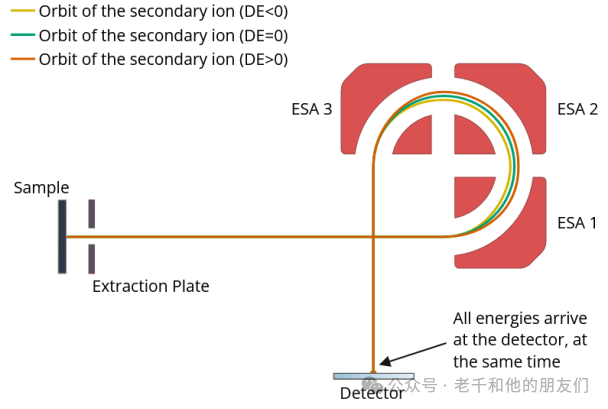
Electrostatic Sector Analyzer (ESA) ToF: Similar to the reflectron, the ESA uses multiple electrostatic analyzers to focus ions of various energies, allowing them to reach the detector simultaneously.
As ions pass through the electric field, they are deflected in multiple electric fields, focusing them based on their kinetic energy. Due to the way ions are deflected, ions with too high or too low kinetic energies are blocked and cannot fully move around the selector, thus being excluded from the system. This only allows ions of specific kinetic energies to pass, eliminating any unwanted ion products. This technique offers high mass resolution and high transmission efficiency.
5.2 ToF-SIMS Detectors
The detector of ToF-SIMS instruments records the flight time of secondary ions as they exit the mass analyzer. Due to the low flux of these ions, the detector must be capable of detecting single ions, thus modern instruments typically use microchannel plate (MCP) detectors.
The microchannel plate consists of a glass plate with a row of parallel channels approximately 5-50 microns in diameter, extending from the top surface to the bottom surface. These channels are inclined at about 10° to the vertical, allowing incoming SIs to collide with the channel walls. The coating on the channel walls emits electrons in response to the collisions. Under the potential applied between the two sides of the plate, electrons move down the microchannels. Further collisions of electrons with the channel walls generate more electrons, forming a cascade that amplifies the signal from the original SI collision (e.g., 103 times).
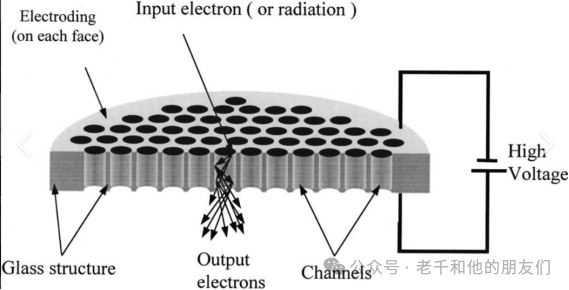
The electron beam flowing from the plate can either be collected by an anode or converted into photons through collisions with scintillators, which are then detected by photomultiplier tubes. The photomultiplier tubes can further amplify the signal.The time digital converter (TDC) assigns the signal to a time scale.
Heavy SIs (moving slowly) may not have enough momentum to cause electron emission upon reaching the detector. To improve the recording of these signals, a “post-acceleration” voltage can be set in front of the detector.
Typically, the time required to record SI impacts is on the order of tens of nanoseconds, during which the detector cannot record any subsequent impacts. This period is referred to as the “dead time”; if the frequency of SI impacts exceeds this time, the detector will reach “saturation”. In practice, this means that two (or more) SIs arriving at the detector during dead time will be recorded as a single count, thus the number of SIs produced by each PI pulse will no longer have a linear relationship with the number detected.
If the number of SIs arriving during the dead time is fewer than four, linear response can be restored through Poisson statistical correction. This is generally performed automatically by the instrument software.
Some instruments may have extended dynamic range (EDR) capabilities, in which case SIs that produce detector saturation are redirected through filters that attenuate their signal strength. For example, if a PI pulse generates 25 X+ SIs, the signal associated with that ion will reach saturation; however, if these ions pass through a filter that attenuates by 10%, only 2 or 3 ions will reach the detector, which falls within the range for Poisson correction.
If the analysis of the ions of interest generates saturated signals and there is no EDR selector, saturation can be alleviated by reducing the number of PIs per pulse (e.g., shortening the pulse length). The downside of this is that it will correspondingly reduce the strength of all other SI signals. EDR, on the other hand, only filters specified SIs.
6 ToF-SIMS Data
Unlike other techniques that detect electrons, photons, or energy, SIMS detects ions (charged particles), capable of detecting a variety of elements from hydrogen to uranium, as well as various molecular ions with masses in the range of 105 atomic mass units (amu). These ions are separated in the selector based on their mass/charge (m/z), which is directly related to atomic mass units.
For example, copper has two natural isotopes, one with a mass of 63 amu and the other with a mass of 65 amu. Therefore, we can observe two Cu+ peaks at m/z 63 and m/z 65. The intensity of the two signals corresponds to their isotopic abundances.
The ionization efficiency varies for each atom and molecule based on their ionization potentials (Ki). Some elements and molecules ionize better than others. For instance, if copper and zinc are at equal concentrations, copper has an ionization potential of 750 kJ/mol, while zinc has an ionization potential of 900 kJ/mol. Therefore, even though copper and zinc are at the same concentration, copper is more easily ionized, resulting in more detected Cu+ ions than Zn+ ions.
Ionization efficiency is influenced by various factors, particularly the chemical environment of the relevant atoms. Thus, quantifying analysis using SIMS is very complex and requires matrix-matched standards for all ions.
In some newer instruments, large complex molecular ions can be selected from the first mass analyzer and then sent to a second mass analyzer for fragmentation to allow for more precise identification.
7 Sample Requirements for ToF-SIMS
Secondary ion mass spectrometers operate in ultra-high vacuum (UHV) systems, so liquids, volatile samples, or any substances that would contaminate the instrument chamber under vacuum conditions should not be placed in the instrument. Additionally, ToF-SIMS has high surface sensitivity, so samples must be handled appropriately to avoid contamination.
When preparing ToF-SIMS samples, it is recommended to handle samples and sample holders with clean tweezers and gloves. It should be noted that due to the high surface sensitivity of the instrument, even certain types of gloves, such as powder gloves and some latex gloves, may contaminate the samples.
Organosilicon is one of the most common surface contaminants, easily brought in by various materials, such as oils, greases, heating fluids, sealants, adhesives, surfactants, and medical devices. Special care should be taken not to allow these substances near the samples.
In general, solid substrates and samples can be directly fixed onto the sample plate using carbon tape. However, some samples (such as powders) must be handled with care to prevent loose particles from entering the vacuum chamber, as they can contaminate the vacuum system.
7.1 Powder Samples
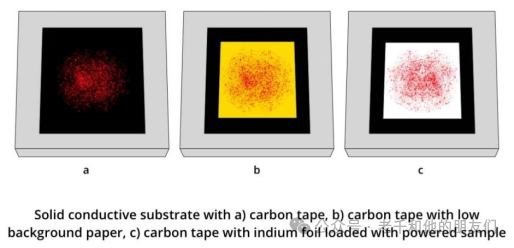
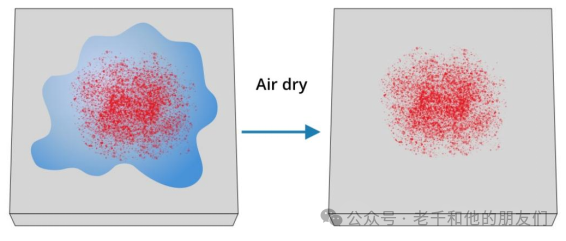
Figure 14 Can directly drop suspensions and solutions onto conductive substrates (such as silicon wafers) and let them dry.
8 ToF-SIMS Classic ApplicationsToF-SIMS was initially applied primarily to the analysis of inorganic materials and minerals, including semiconductors, industrial materials, and coatings, as well as the chemical analysis and mapping of organic contaminants. Recently, with significant advancements in technologies associated with this technique, ToF-SIMS analysis of polymer samples, pharmaceuticals, biomolecules, tissue samples, and forensic or diagnostic applications has been increasingly common.
8.1 Pharmaceutical Sciences
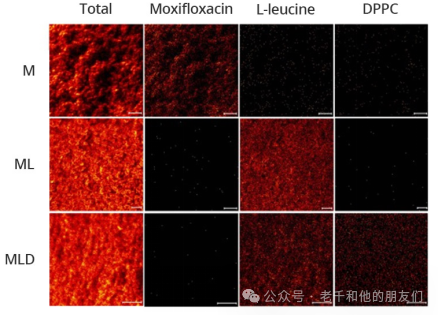
Zhou et al. (2013) demonstrated that coating lubricants on sticky particles can improve the aerosolization of low-concentration excipients in inhalable drugs. Since this is purely related to the outermost surface chemical composition, ToF-SIMS can be used to analyze surface changes and determine the composition and distribution of surface excipients.
Tof-SIMS has also been used to study the effects of surfactants l-leucine and 1,2-dipalmitoyl-sn-glycero-3-phosphocholine (DPPC) on improving the aerosolization of pyrazinamide and moxifloxacin co-spray-dried powders.
8.2 Geology and Mineralogy
High-precision analysis of trace elements and surface chemistry plays an important role in geology and mining. ToF-SIMS can provide elemental and molecular information of the topmost atomic layers of surfaces on a particle-by-particle basis.
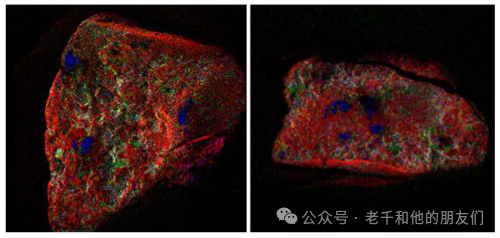
Figure 16 Individual silicon sand grains show red for silicon, green for aluminum, blue for iron.
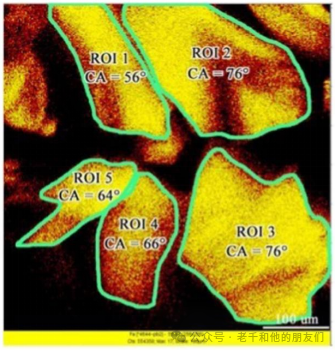
Figure 17 Predicting the contact angle of different pyrite particles based on ToF-SIMS images (Xu, 2020)
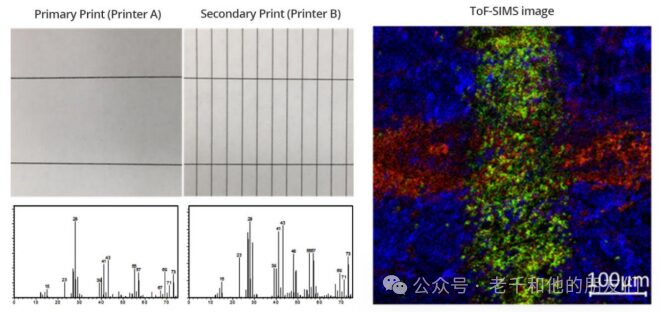
8.3 Forensic EvidenceToF-SIMS provides small area analysis to characterize surface elements and organic components. ToF-SIMS is suitable for identifying and inquiring about suspicious marks from pencils, ballpoint pens, and certain dyes (Denman, 2010). This may help determine the source of forged or altered documents.
END
Reprinted content only represents the author’s views
It does not represent the position of the Institute of Semiconductors, Chinese Academy of Sciences
Editor: Renowned No Name Wei Classmate
Editor in Charge: Six Dollar Fish
Submission Email: [email protected]