The digital multimeter is a powerful assistant for measuring electrical signals. Although it is called a “universal” meter, its common functions are limited to measuring voltage, current, and resistance. Voltage and current measurements also include AC and DC ranges. In addition, some multimeters can measure inductance, capacitance, continuity, diode forward voltage, transistor current gain, counting and frequency, temperature, and more.
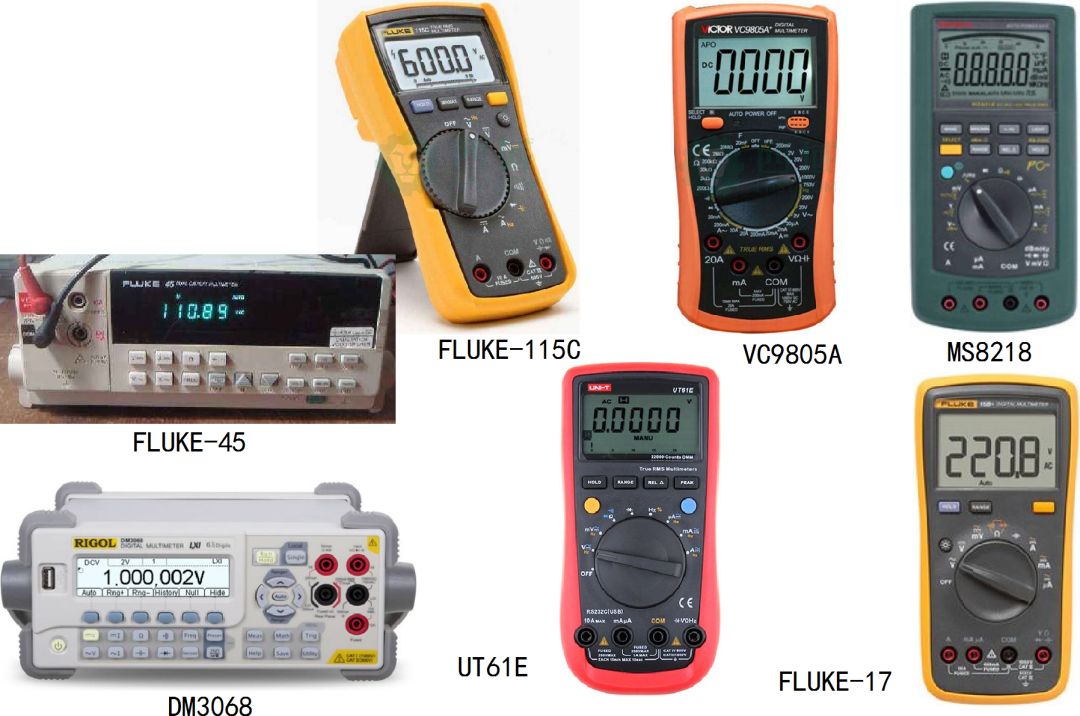
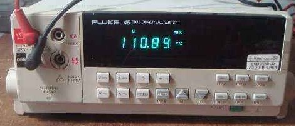
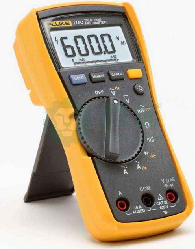
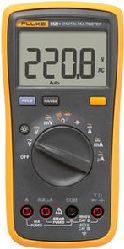
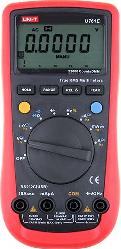
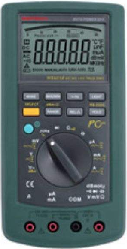
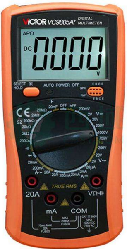
Common handheld and bench multimeters
Random noise signals are commonly found in circuits. Sometimes they need to be eliminated, but at other times they can be utilized for measurements. For example, they can be used to test the effective bandwidth of amplifiers, identify system disturbances, determine the source of interference, and measure some basic physical quantities.
Can a digital multimeter measure the magnitude of random noise?
Before analyzing, we can first compare the measurement results of random noise using several different multimeters.
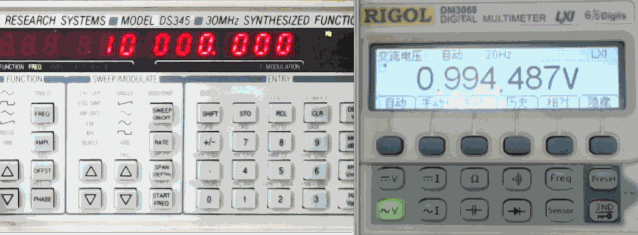
Using the DS345 digital signal generator to produce random noise with an effective value of 1V as the measured signal.
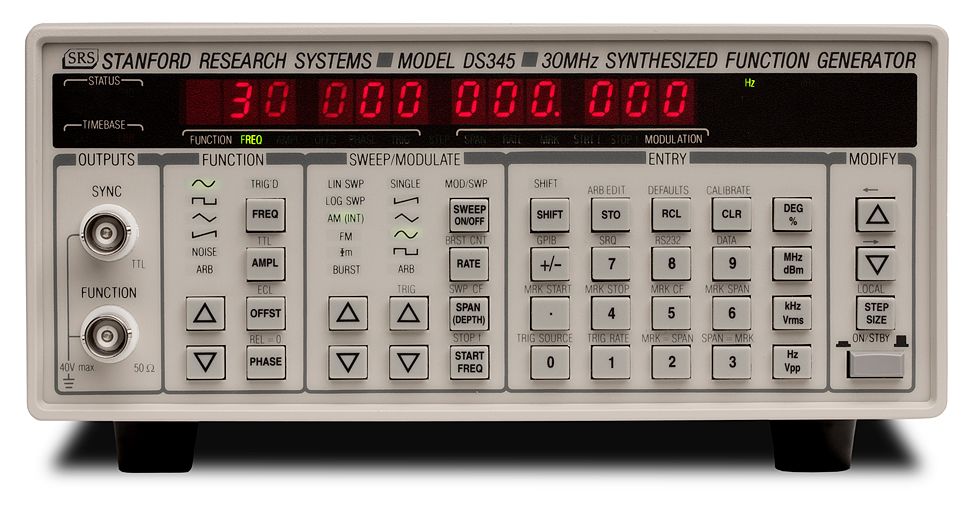
Digital signal generator:DS345
The time-domain waveform of the random signal observed through the oscilloscope shows that due to the output impedance of the digital signal generator being 50Ω, and the external load also being 50Ω, the output signal’s amplitude is halved.
Observing the output signal of the digital signal generator directly with the oscilloscope, since the oscilloscope’s input impedance is very high (1MΩ), the actual amplitude of the signal observed by the oscilloscope is twice the nominal output value of the DS345.
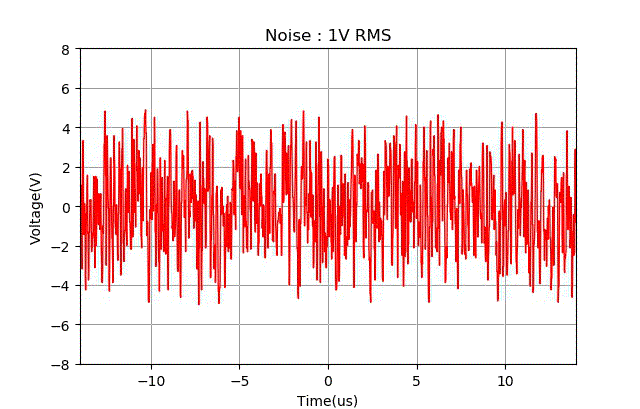
Random signal waveform collected by the oscilloscope
Re-adjusting the output amplitude of the DS345 random signal to 0.5Vrms, the actual output signal’s amplitude is then 1Vrms.
Using seven different digital multimeters to measure the AC voltage range of the DS345 output random noise signal, they display different values, all less than 1V, with significant differences among them.
The highest reading is from the DM3068 six-and-a-half digit digital multimeter, which shows a value of only 0.587V, 42% lower than the output of the signal source at 1V.
Table:Different digital multimeters measuring 1Vrms random noise readings
| Multimeter | Measured Value (V) | Remarks |
| DM3068 | 0.587 |
Very stable reading |
| FLUKE-45 | 0.2729 |
Very stable reading |
| FLUKE-115C | 0.183 |
Large fluctuations in the reading |
| FLUKE-17 | 0.097 |
Some fluctuations in the reading |
| UT61E |
|
Some fluctuations in the reading |
| MS8218 | 0.216 |
Very stable reading |
| VC9805A | 0.065 |
Very stable reading |
Why do the effective values measured by digital multimeters in the AC voltage range differ significantly from the actual signal values? Is it possible that the effective value of the random signal itself is not 1V?
Using the oscilloscope to collect 280,000 data points from the random noise signal above and sending them to a computer, the histogram distribution of these values is shown below.
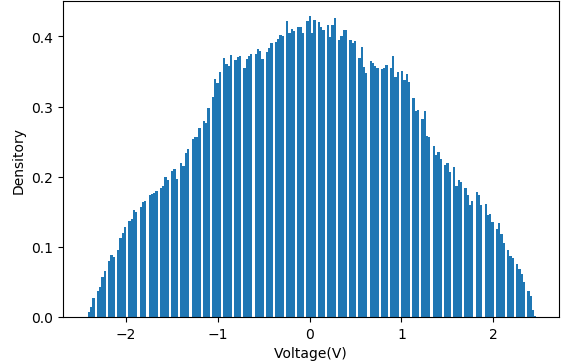
Histogram distribution of signal values read by the oscilloscope
The standard deviation of the data is: 1.0368V. This indicates that the effective value of the random signal generated by the signal generator matches its displayed value, which is 1V.
The previous digital multimeters, regardless of model or price, whether they claim to measure true effective values or not, all show significant differences between the effective values of the measured signals and the actual values. Why is there such a large difference in measuring random signals compared to ordinary sine AC signals?
Ordinary random signals and sine signals share commonalities in that they are both AC signals and possess power (energy).
Sine signals of different frequencies
The difference lies in the frequency components contained in the signals. Ordinary sine signals primarily consist of their fundamental frequency and some high-frequency harmonic signals. The power of the fundamental frequency signal constitutes the overwhelming majority. As long as the multimeter can measure the fundamental frequency signal accurately, the displayed result will be accurate.
Below is the frequency spectrum measurement value of a 5MHz sine wave signal generated by the DS345.
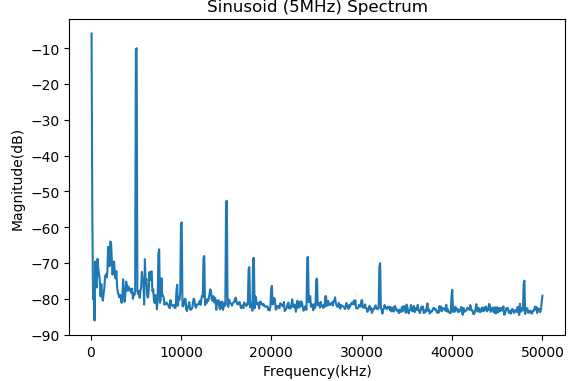
Frequency spectrum of the 5MHz sine signal generated by DS345
For random signals, the frequency components are very rich and present a continuous distribution within a certain range. Below is the frequency spectrum measurement curve of the random signal generated by the DS345.
Its frequency components extend from low frequencies up to about 30MHz, with the vast majority of signal components concentrated below 10MHz.
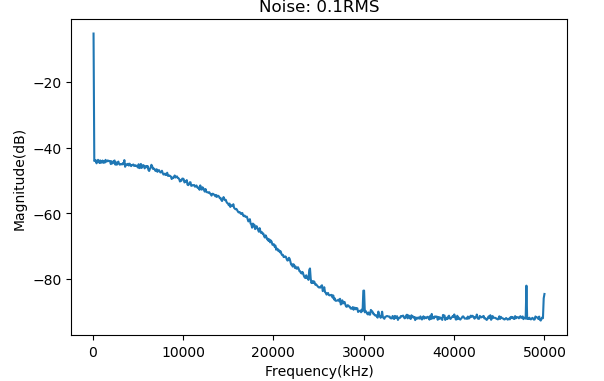
Frequency spectrum of the random signal generated by DS345
Digital multimeters yield different measurement results for AC signals of different frequencies, often having a frequency upper limit. Beyond this upper limit, the measured results will decrease.
Different multimeters have different frequency measurement upper limits. Below, the DS345 generates a sine signal with a frequency ranging from 10kHz to 6MHz, with an effective value of 1V, and the DM3068 digital multimeter measures the signal’s amplitude.
Measuring the frequency curve of the digital multimeter using a digital signal generator
When the frequency is below 500kHz, the readings of the digital multimeter remain around 1V. When the frequency exceeds 500kHz, the readings begin to decrease. For every doubling of frequency, the reading halves.
When the frequency exceeds 5.2MHz, the reading suddenly drops below 0.2V.
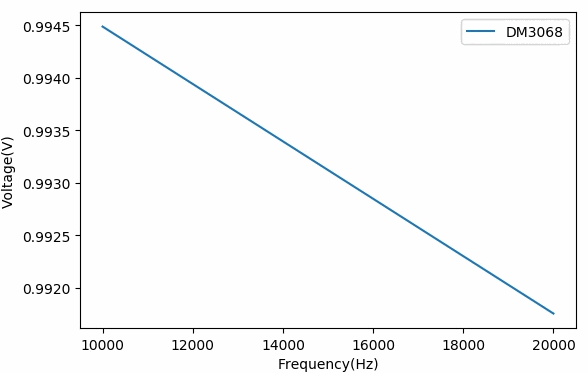
Frequency curve of the DM3068 digital multimeter
Digital multimeters yield different measurement results for different frequency sine signals. Since the frequency spectrum of random noise signals extends to about 30MHz, the results of frequency components beyond 500kHz are attenuated.
Using the frequency gain curve of the DM3068 digital multimeter mentioned earlier, the gain of each frequency component in the random noise signal can be calculated. Then, by summing the energies of these frequency components, we can obtain the effective value of the actual measured signal.
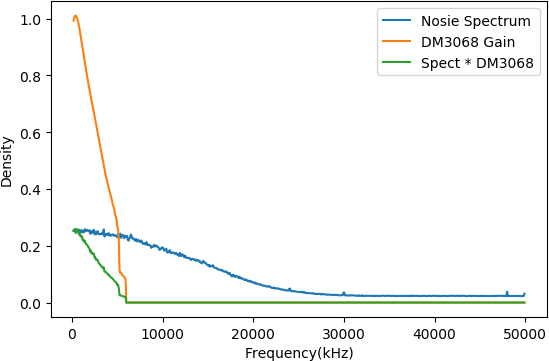
Random signal spectrum (blue), DM 3068 frequency characteristics (yellow), actual measured values of random noise frequency components (green)
The specific calculation formula is shown below. The integral operation is approximated using numerical summation.
The resulting ratio R represents the reduction ratio of the effective value of the random noise Sn generated by the DS345.
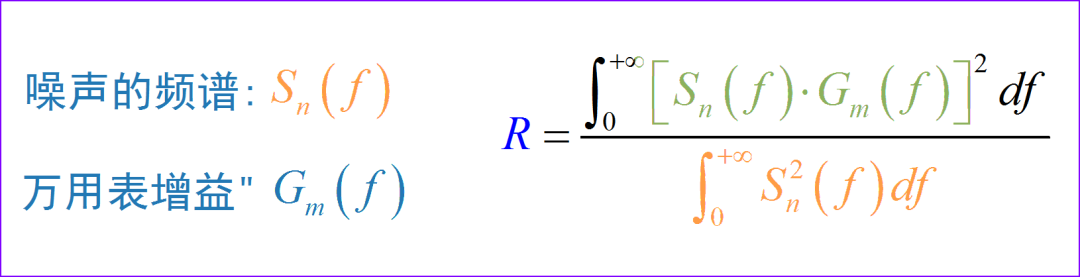
Using the above data, numerical integration yields the reduction ratio of the DM3068 multimeter’s measurement result for this noise: sqrt(R)= 0.591.
The previous measurement result using the DM3058 for the effective value of 1V random noise generated by the DS345 wasV=0.587V. It can be seen that this value is consistent within the error range with the result obtained from the formula above.
Due to the different frequency curves of each multimeter, the reduction ratios of the measured effective values of random noise also differ. Below are the frequency curves obtained using the same method for the FLUKE45 and MD8218 digital multimeters.
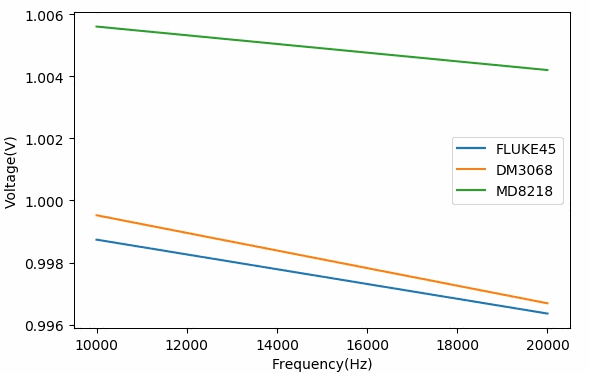
Frequency curves of different digital multimeters
Using the same method as above, the reduction ratios sqrt(R) for the readings of each digital multimeter for the random signal generated by the DS345 are as follows:
FLUKE45: 0.274
MM8218: 0.254
UT61E: 0.162
Comparing the previous measurement results for the effective value of 1V random signals, it can be seen that the reduction ratios are consistent with the actual readings of the multimeters.
If the frequency spectrum of the random signal falls within the frequency range of the digital multimeter, the multimeter can provide accurate readings. If the frequency spectrum of the random signal exceeds the frequency range of the digital multimeter, the readings provided by the multimeter will deviate. Using the above method, the ratio of measurement results can be obtained, and the corrected readings of the digital multimeter can accurately reflect the effective value of the random signal with a certain frequency distribution.