Introduction: This article is a step-by-step technical guide on using InfluxDB 3 and Grafana to centralize data from smart home devices onto a unified platform.
Dear partners, did you know that smart home devices in your home generate a large amount of scattered data?
This tutorial will show you how to use InfluxDB 3 and Grafana to centralize this data onto a unified platform. We can not only track the vital signs of the home, but also learn professional software development concepts such as time series database design and building resilient data pipelines suitable for various monitoring and analysis systems.
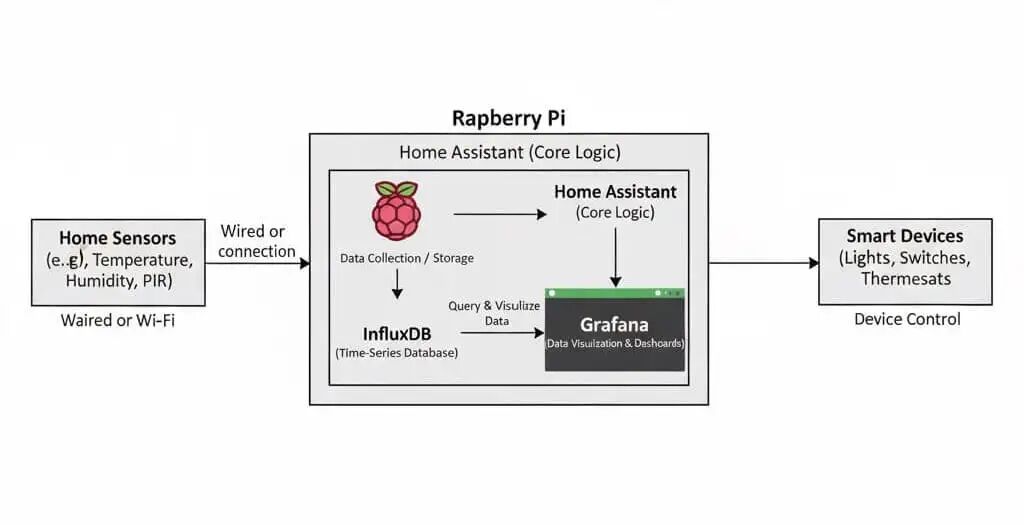
Before we begin, please ensure you are familiar with the following technologies or knowledge:
- Familiarity with Python and API concepts
- Management access to the router (for bandwidth monitoring)
- At least one smart device (Nest thermostat, smart meter, etc.)
- A computer or Raspberry Pi to run InfluxDB 3, Grafana and Python programs.
Understanding the Content You Are Using
Time series data fundamentally differs from traditional relational data. We focus not on the relationships between entities, but on the changes in values over time. Each data point contains:
- Timestamp: The time of measurement.
- Measurement: What we are measuring (temperature, power, bandwidth).
- Tags: Metadata that helps us categorize the data (device_id, location, type).
- Fields: The actual measured values.
This structure makes InfluxDB very suitable for handling IoT data, as it is optimized for write-intensive workloads based on time-based queries.
We define it using a syntax called “line protocol”; see the example below:
|
1 2 |
weather,location=london,season=summer temperature=301465839830100400200 |
To understand this syntax:
- “ weather “ is the name of the database table, also known as the measurement.
- “location=london,season=summer” is a comma-separated key-value pair or “tag set” that provides metadata.
- “ temperature=30 “ is the field set, i.e., the actual data set.
- “ 1465839830100400200 “ is optional; it is actually a timestamp in RFC3339 format 2016-06-13T17:43:50.1004002Z. If you do not provide a timestamp, InfluxDB will use the local nanosecond-level UTC timestamp of your server.
Setting Up InfluxDB 3
We will use the free home license of InfluxDB 3 Enterprise, which only requires you to provide an email address. It includes 2 CPUs and is for personal use only. You will need to check your inbox and verify the link to activate the home license.

InfluxData is the creator of the leading time series platform InfluxDB. It collects, stores, and analyzes time series data of various scales. Developers can query and analyze timestamped data to make real-time predictions, responses, and adjustments.
Now, let’s proceed with the following coding steps:
|
1 2 3 4 5 6 7 8 9 10 11 12 13 14 15 16 17 18 |
# Pull image from Docker for InfluxDB 3 Enterprise docker pull influxdb:3–enterprise
# Run InfluxDB 3 Enterprise with proper configuration docker run–d\ |