 Reprinted with permission from Fanastr“Cyberpunk 2077” is a very popular single-player game recently.The game is set in the year 2077, in a highly developed yet chaotic “cyberpunk” city.In this world, although technology is highly advanced, the living standards of humans are extremely low, or rather, the living standards of the poor are extremely low.Moreover, apart from a very small number of wealthy capitalists, the rest are all poor.So, this is an extreme world, containing many elements. Visually, the prosperous three-dimensional city is filled with neon lights, and artificial light is the only source of illumination, with no sunlight at all.Correspondingly, in the slums, it is dark and damp.The boundaries between the virtual and the real are blurred, artificial intelligence and artificial humans are indistinguishable, and the divide between the rich and the poor is extreme, filled with terrorism.In short, it is an absolutely dystopian world. If you are interested, you can delve deeper into it, but I will just touch on it for now!This issue mainly introduces a “cyberpunk” style Python library, 「mplcyberpunk」GitHub:https://github.com/dhaitz/mplcyberpunkFirst, install it via pip.
pip install mplcyberpunk
Since the author did not write any usage documentation and only provided a part of the example code…It is really difficult to study!Let’s first look at the first example.
import matplotlib.pyplot as plt
import mplcyberpunk

# Add style
plt.style.use("cyberpunk")

plt.plot([1, 3, 9, 5, 2, 1, 1], marker='o')
plt.plot([4, 5, 5, 7, 9, 8, 6], marker='o')

# Set line glow + area chart
mplcyberpunk.add_glow_effects()
plt.show()
This produces an area chart with glowing lines.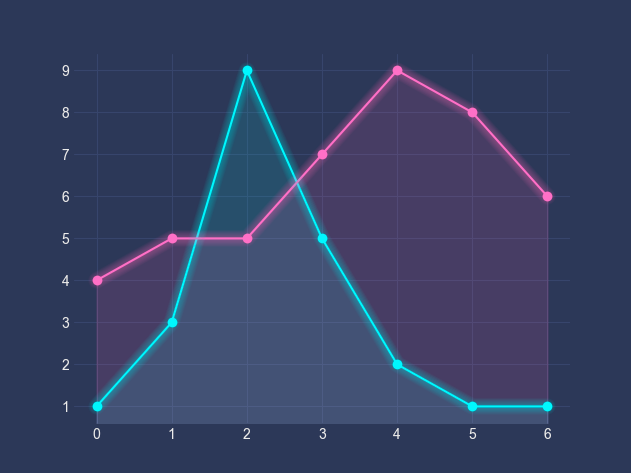 It indeed matches the neon light style of cyberpunk, with artificial light sources.By examining the library’s source file core.py, we find the two main functions of this library.
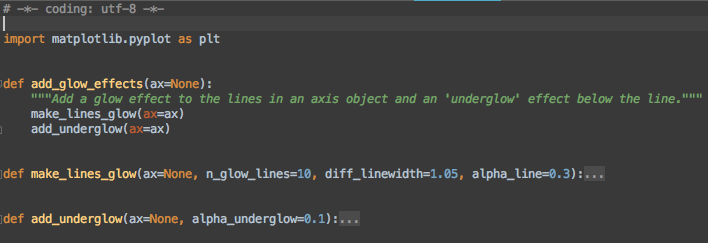 Namelymake_lines_glow(glowing lines) andadd_underglow(area chart with glow). Next, we will use each method once.
import numpy as np
import mplcyberpunk
import matplotlib.pyplot as plt
plt.style.use("cyberpunk")
# Data
x = np.arange(-7, 7, 0.1)
y1 = np.sin(x)
y2 = np.sin(x) + x
y3 = np.sin(x) * x
y4 = np.sin(x) / x
plt.plot(x, y1)
plt.plot(x, y2)
plt.plot(x, y3)
plt.plot(x, y4)
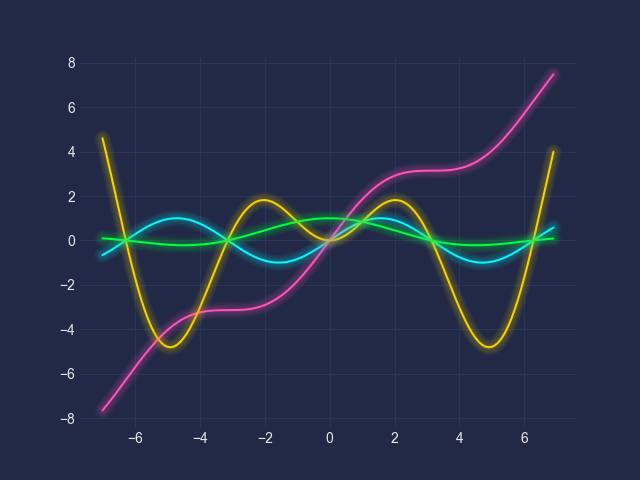
# Glowing lines
mplcyberpunk.make_lines_glow()
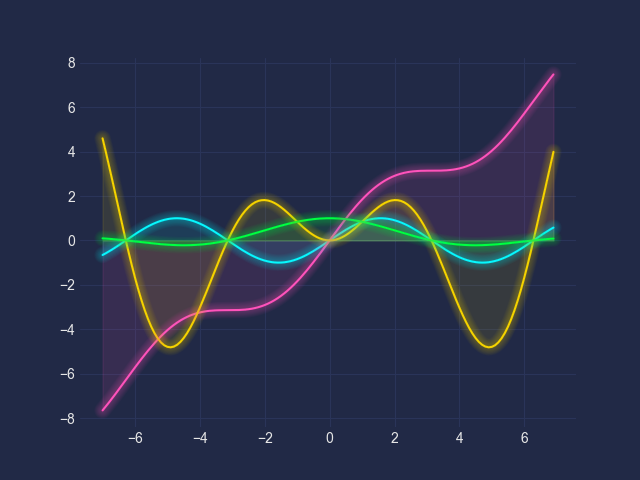
# Area chart
mplcyberpunk.add_underglow()
# Save image
plt.savefig("defalut.png")
The first is the default format, the second adds glowing lines, and the third is glowing lines + area chart.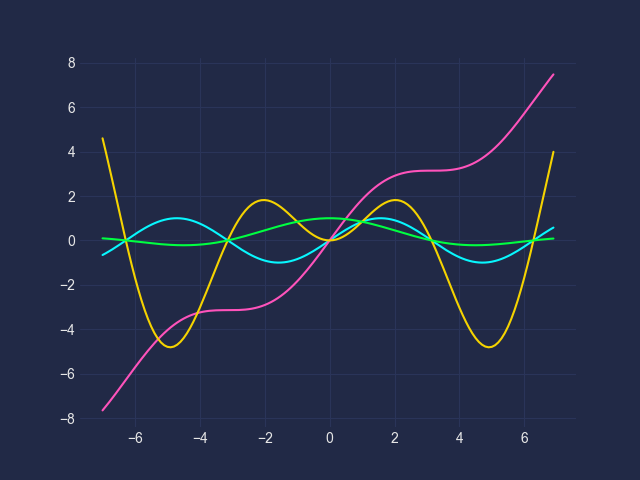
 Compared to the author’s example images, it lacks titles and legends, which you can add yourself!Additionally, you can customize some other types of colors.The defaultcolormapiscool.
import matplotlib.pyplot as plt
from matplotlib import cm
import mplcyberpunk
import numpy as np
# time
t = np.arange(0, 6.4, 0.1)
# frequency
f = 1
amplitudes = np.arange(-10, 11, 1)
# amplitude
A = [x * np.cos(f*t) for x in amplitudes]
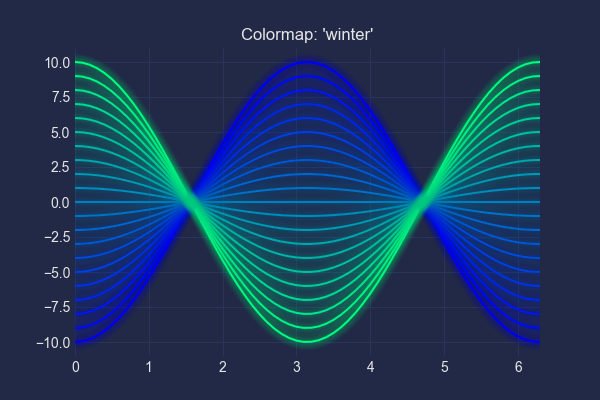
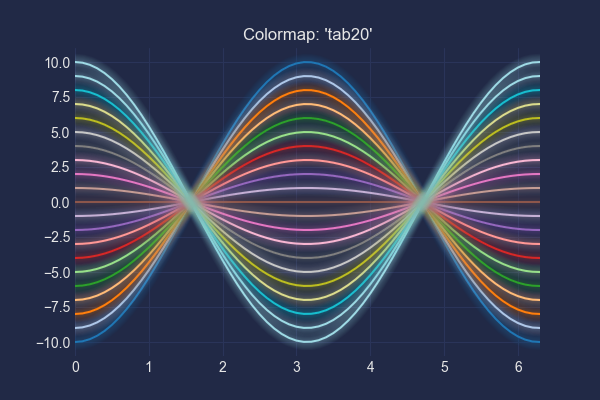
# Set color style, cool, spring, winter, tab20, coolwarm
colormap_sect = np.linspace(0, 1, len(amplitudes))
colors = [cm.coolwarm(x) for x in colormap_sect]
plt.rcParams['figure.figsize'] = [6, 4]
plt.style.use("cyberpunk")
plt.xlim(right=6.3)
for i in range(21):
plt.plot(t, A[i], color=colors[i])
mplcyberpunk.make_lines_glow()
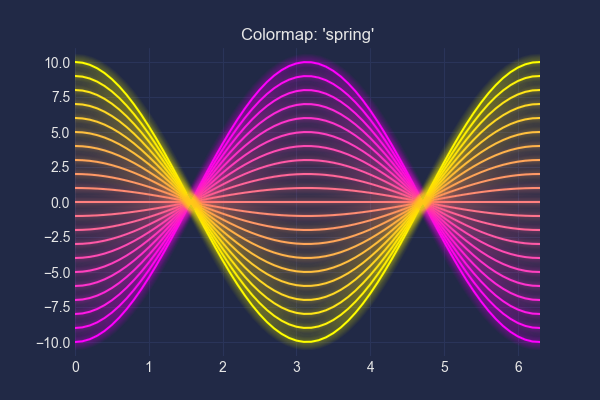
# Title name, cool, spring, winter, tab20, coolwarm
plt.title("Colormap: 'coolwarm'")
plt.savefig("colormap.png")
This produces a chart with five color schemes.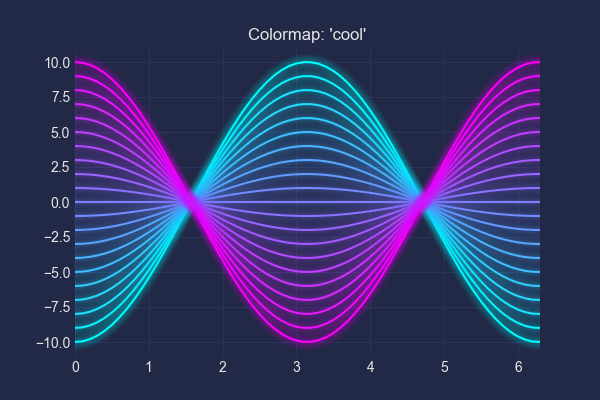
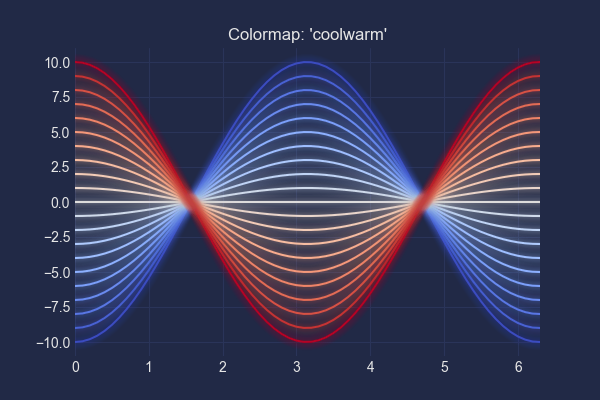 They all look stunning!Finally, you can also generate a “cyberpunk” style map.This uses theridge_mapfor ridge maps.GitHub:https://github.com/ColCarroll/ridge_map
# Install
pip install ridge_map
# Install library dependencies
pip install scikit-image==0.14.2
Note that when installingscikit-image, you need to specify version 0.14.2, otherwise it will throw an error.Since the content of theridge_maplibrary is quite extensive, I won’t elaborate on it.
import matplotlib.font_manager as fm
import matplotlib.pyplot as plt
from ridge_map import RidgeMap
import mplcyberpunk

# Cyberpunk style
plt.style.use("cyberpunk")

# Chinese display
plt.rcParams['font.sans-serif'] = ['SimHei'] # Windows
plt.rcParams['font.sans-serif'] = ['Hiragino Sans GB'] # Mac
plt.rcParams['axes.unicode_minus'] = False

# Font
font_prop = fm.FontProperties(fname="方正兰亭刊黑.ttf")

# Get data, special techniques are needed here to succeed
rm = RidgeMap(bbox=(-156.250305, 18.890695, 154.714966, 20.275080), font=font_prop)

# Set the number of lines, orientation, and other properties
values = rm.get_elevation_data(num_lines=200, viewpoint='north')
values = rm.preprocess(values=values,
                       water_ntile=10,
                       vertical_ratio=240)

# Set title, line color, background color, etc.
rm.plot_map(values, label="Hawaii", kind='gradient', line_color=plt.get_cmap('spring'), background_color='#212946')
plt.savefig('夏威夷.png')
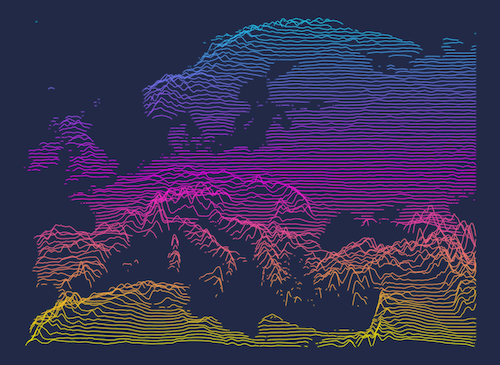
This produces a ridge map of Hawaii, full of punk style!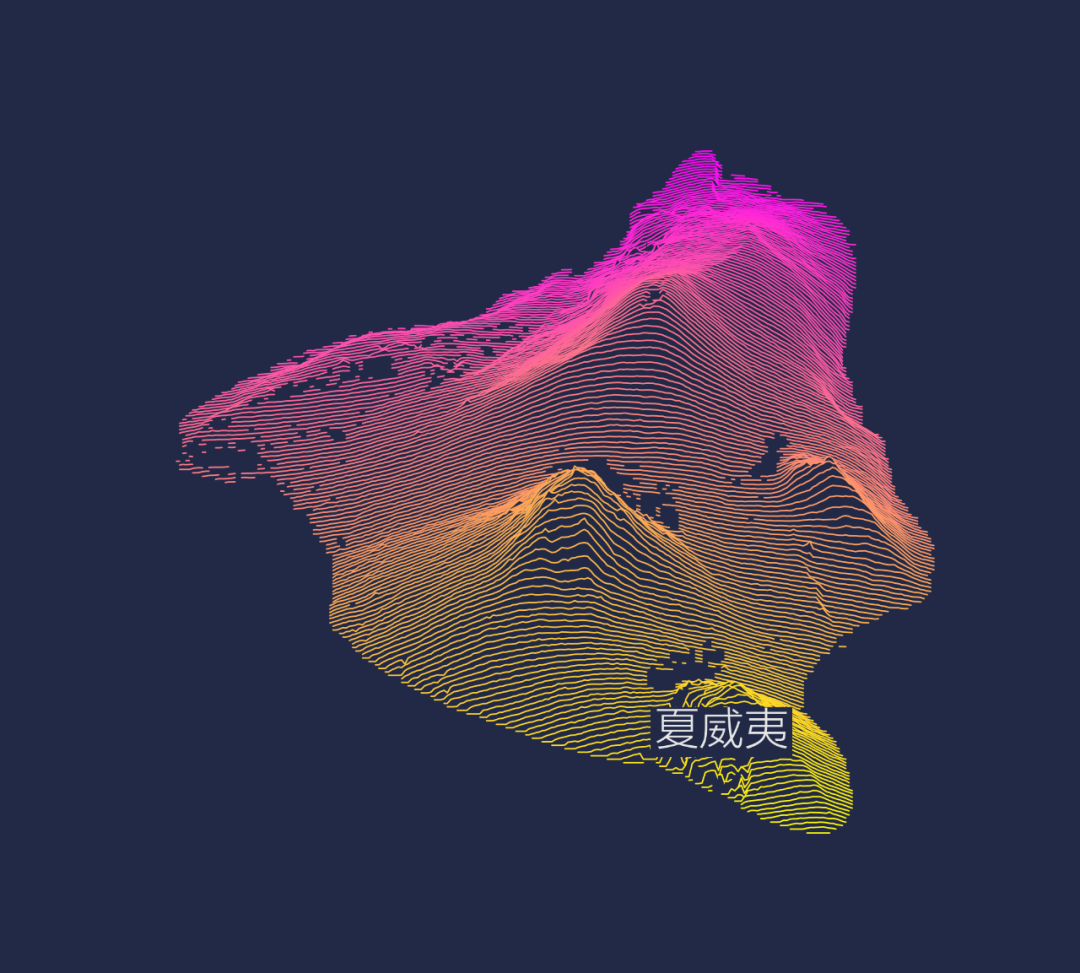 The author provided two images, a world map and a European map, but the data retrieval took too long, so I chose to give up.It seems that you can directly implement it using images inheightmapsformat, so interested friends can try it out!
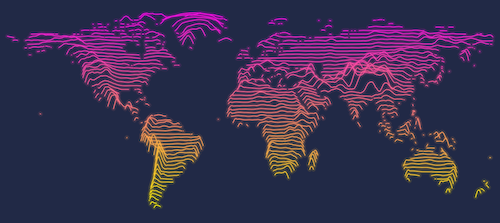
 Next, let’s experiment with a smaller area, Taiwan Province.
import matplotlib.font_manager as fm
import matplotlib.pyplot as plt
from ridge_map import RidgeMap
import mplcyberpunk

# Cyberpunk style
plt.style.use("cyberpunk")

# Chinese display
plt.rcParams['font.sans-serif'] = ['SimHei'] # Windows
plt.rcParams['font.sans-serif'] = ['Hiragino Sans GB'] # Mac
plt.rcParams['axes.unicode_minus'] = False

# Font
font_prop = fm.FontProperties(fname="方正兰亭刊黑.ttf")

# Get data, special techniques are needed here to succeed
rm = RidgeMap(bbox=(122.014, 25.344, 120.036, 21.902), font=font_prop)

# Set the number of lines, orientation, and other properties
values = rm.get_elevation_data(num_lines=200, viewpoint='north')
values = rm.preprocess(values=values,
                       water_ntile=10,
                       vertical_ratio=240)

# Set title, line color, background color, etc.
rm.plot_map(values, label="Taiwan Province", kind='gradient', line_color=plt.get_cmap('spring'), background_color='#212946')
plt.savefig('台湾省.png')
The latitude and longitude coordinates can be obtained through Tencent Location Services.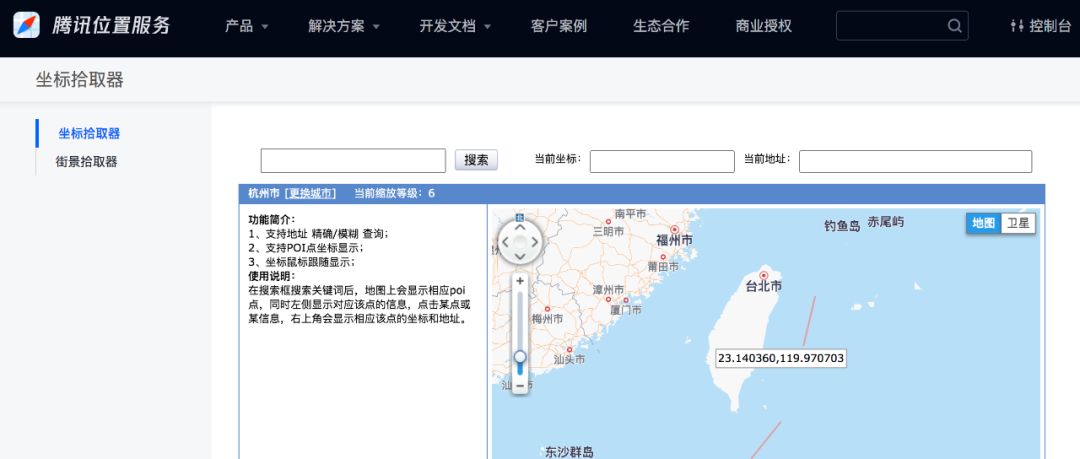 This produces a ridge line map of Taiwan Province.
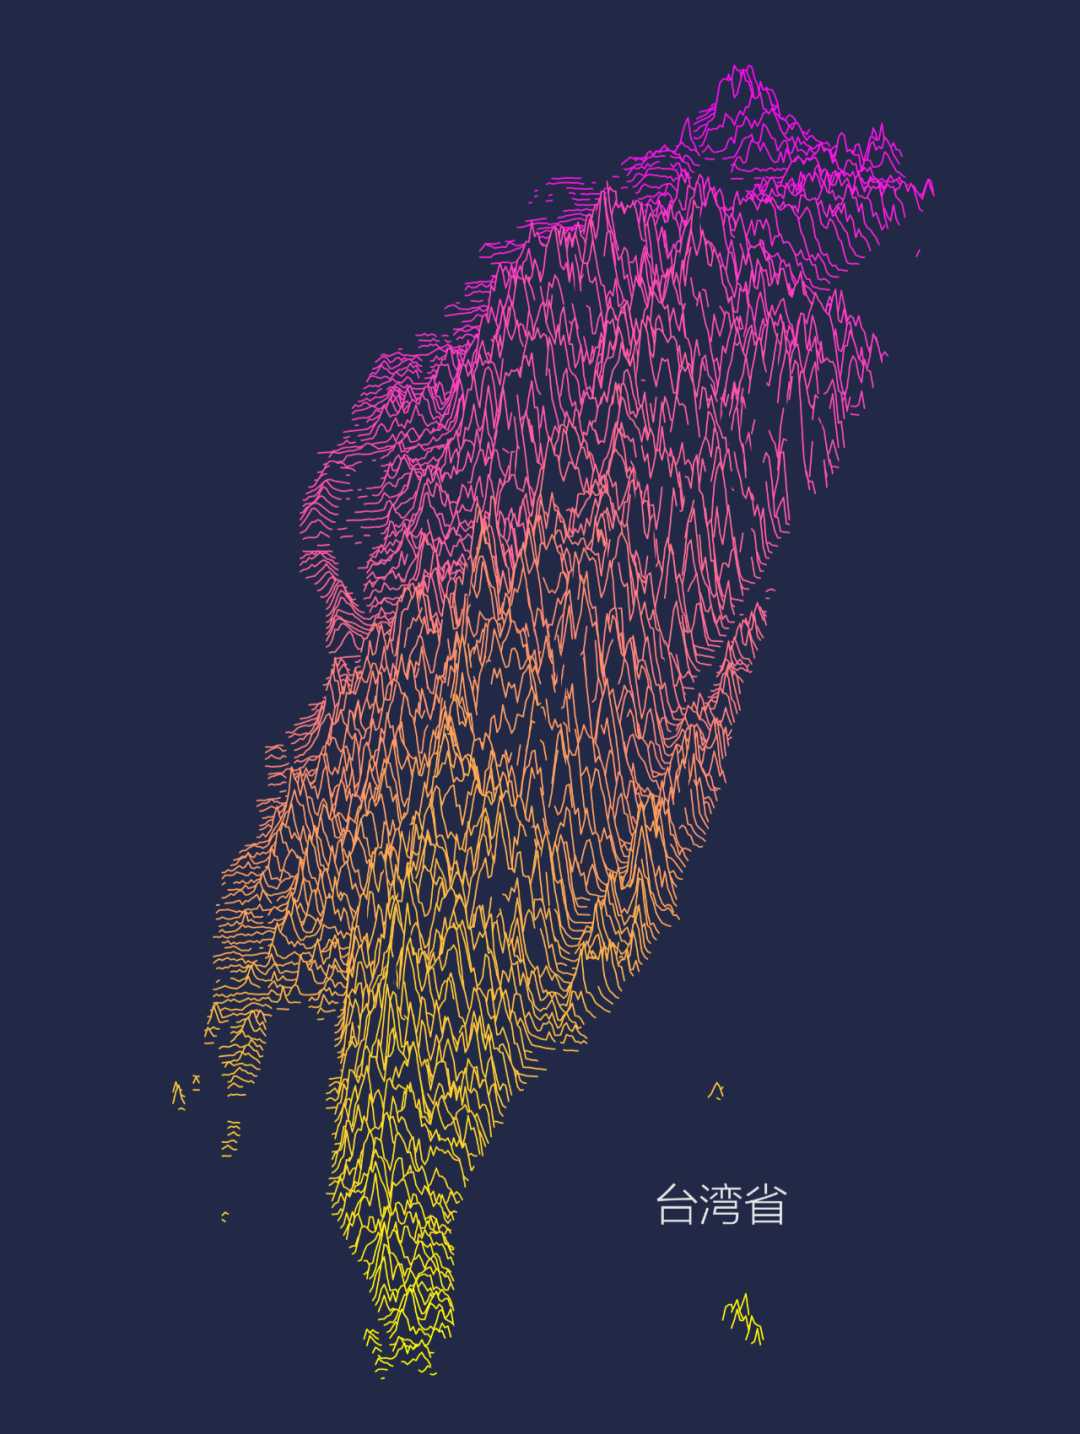 Indeed, it is a mountainous nation; apart from the coastal plains, the rest are all mountains…Alright, this concludes this issue. As for “cyberpunk” style bar charts, pie charts, etc., I will leave it for everyone to explore!
 Those who click “Like” become more attractive!