

Written by︱Dan Xiaocai, Cao Jun, Zhao Yifan
Editor︱Wang Sizhen
Edited by︱Yang Binwei
Alzheimer’s disease (Alzheimer’s disease, AD) is the most common form of dementia, leading to memory loss and cognitive impairment. According to the World Health Organization, over 55 million people are currently diagnosed with some form of dementia[1, 2]. The increasing global aging population demands more effective and accurate AD diagnostic techniques. Electroencephalography (EEG) is a diagnostic method used to study changes and degeneration in the brain’s bioelectric functions, providing direct access to neuronal signals with several unique advantages: non-invasiveness, high temporal resolution, wide availability, and low cost[3,4]. The functional connectivity (functional connectivity, FC) of the human brain characterizes the statistical correlation of information flow between cortical regions, which is significant for studying intrinsic brain networks and their functional mechanisms. Since channels are discrete and discontinuous in the spatial domain, the structure of EEG determines that the functional connectivity network is non-Euclidean data, where each EEG channel can be viewed as a node, with cross-channel interactions existing between nodes. Compared to traditional convolutional neural networks, geometry-based deep learning methods are more suitable for learning the cross-channel topological features of EEG. Graph Convolutional Networks (graph convolutional neural network, GCN) can effectively handle highly complex graph data with spatiotemporal interactions by mining specific node sequential features and cross-node topological association features.Although GCN has begun to attract significant academic attention, there is currently a gap in the industry regarding AD diagnostic methods based on GCN related models utilizing FC features.
On June 25, 2022, a team led by Zhao Yifan from Cranfield University in the UK published an article titled “Spatial-Temporal Graph Convolutional Network for Alzheimer Classification based on Brain Functional Connectivity Imaging of EEG”, introducing a novel spatiotemporal GCN (spatial-temporal graph convolutional neural network, ST-GCN) algorithm for classifying healthy individuals and AD patients. Unlike existing studies that focus solely on brain functional topological features or EEG temporal features, the proposed ST-GCN can simultaneously mine the functional connectivity topological features between EEG channels and the dynamic features of specific EEG channels. Unlike traditional convolutional neural networks, the proposed ST-GCN fully utilizes the adjacency matrix information that represents functional connectivity. Testing results on clinical EEG datasets (AD patients and healthy controls) indicate that the proposed method achieves better classification performance than state-of-the-art methods (92.3%).
The spatial topological interaction information carried by EEG signals plays a crucial role in the classification of AD/controls (HC) [5-8]. As shown in Figure 1, the input to the ST-GCN model is: each data segment represents the adjacency matrix of spatial topological correlation W∈ Rⁿ×ⁿ and channel signals X∈ Rⁿ×M. Specifically, the original EEG signal of each channel and the associations between channels are modeled by a graph. The nodes in the graph represent the feature vectors of the EEG signals, i.e., the original EEG data. The Wi, j entry of the adjacency matrix represents the spatial coupling strength between the ith and jth channels, W indicates that all channels are interconnected with different weights. In some GCN-based brain disease studies [9-13], the channels of EEG lack effective prior guidance, and the adjacency matrix cannot effectively utilize the coupling information between channels. To address these issues, we first apply functional connectivity, which has been proven useful in AD classification, to construct an adaptive adjacency matrix to extract spatial coupling features. The adjacency matrix is constructed using Pearson correlation analysis (PC) and five other FC methods, without any preset thresholds to avoid potential risks from manual selection. The five FC methods include phase locking value (PLV) in the time domain, phase lag index (PLI), magnitude squared coherence (MSC), imaginary part of coherence (IPC) in the frequency domain, and wavelet coherence (WC) in the time-frequency domain.
As shown in Figure 1a, the proposed ST-GCN architecture consists of two spatiotemporal convolution blocks (ST-Conv Blocks), each ST-Conv block contains a spatial graph convolution layer (Spatial Graph-Conv) and two sequential convolution layers (Temporal 1D-Conv). The ST-Conv blocks can be stacked according to the complexity of the specific situation. Layer normalization is used in each ST-Conv block to prevent overfitting. The EEG channels with adjacency matrix W are uniformly processed by ST-Conv Blocks to coherently explore spatial and temporal dependencies. The feature flattening layer (flattened features) integrates comprehensive features to generate the final AD/HC classification. For comparison, the authors designed the classic temporal convolutional neural network (T-CNN) structure shown in Figure 1b, inspired by some related works[14-16].The difference between these two model structures is thatT-CNN only has the EEG channels X at the input end, without the adjacency matrix W, and the intermediate feature layers in T-CNN do not use spatial graph convolution units.Other aspects of T-CNN are the same as those of ST-GCN.
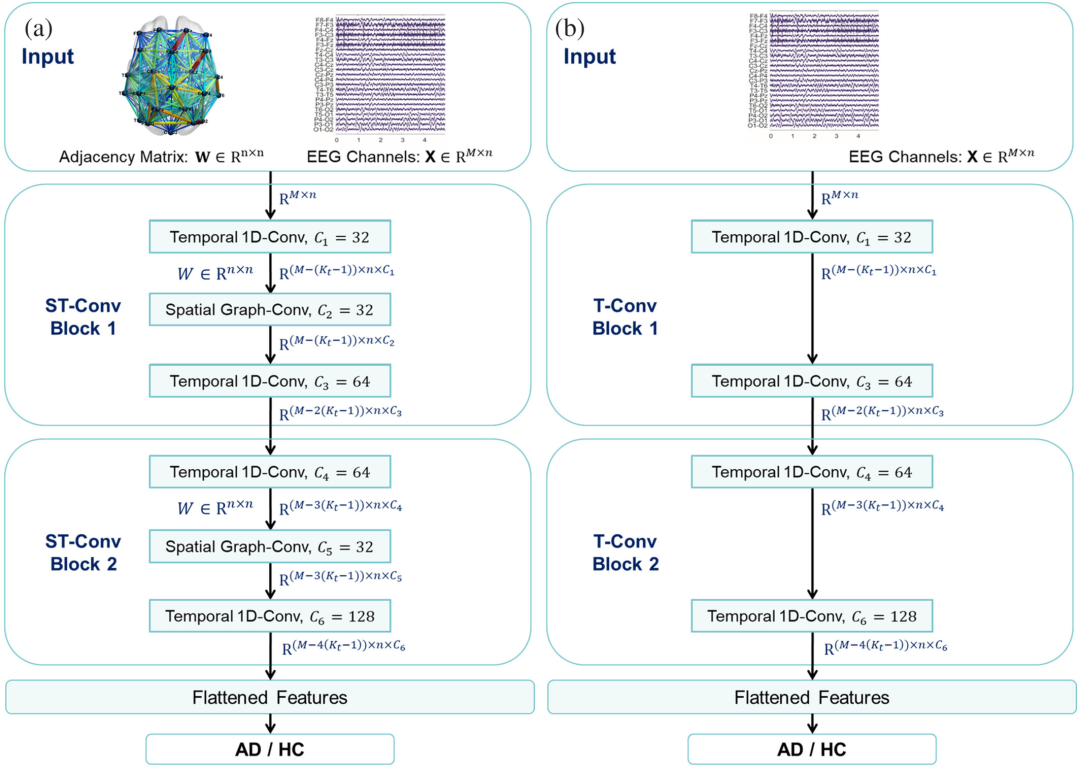
Figure 1 (a) The proposed ST-GCN framework and (b) the flowchart of the T-CNN framework for comparison.
(Image source: Shan et al., Hum Brain Mapp, 2022)
To compare the performance of ST-GCN and T-CNN models, six extracted FC adjacency matrices were used to independently train models on six frequency bands in both eyes-open and eyes-closed states, comparing the classification results for AD and HC. Tables 1 and 2 show the corresponding test accuracies of the ST-GCN and T-CNN models, respectively. For both types of models, the classification accuracy in the eyes-closed state for all frequency bands and adjacency matrix calculation methods is higher than that in the corresponding eyes-open state. For different frequency bands, when using the 1-48 Hz full-band signal and the corresponding adjacency matrix as input, the average classification accuracy of ST-GCN is about 91.1 % (higher than all sub-band data), while that of T-CNN is about 88.0 %. For the performance of ST-GCN on sub-band data, the average classification accuracy of the Beta band data is the highest (about 82.3 % in eyes-closed, about 77.7 % in eyes-open), while the average classification accuracy of the Delta band data is the lowest (about 73.1 % in eyes-closed, about 71.0 % in eyes-open). For the performance of T-CNN on sub-band data, the average classification accuracy of the Alpha band data is the highest (about 76.8 % in both eyes-open and eyes-closed), while the average classification accuracy of the Delta band data is the lowest (about 68.6 % in both eyes-open and eyes-closed).Overall, ST-GCN outperforms T-CNN in both eyes-open and eyes-closed states and almost all sub-band data, indicating that spatial topological constraints can indeed mine EEG features, thereby improving classification accuracy.
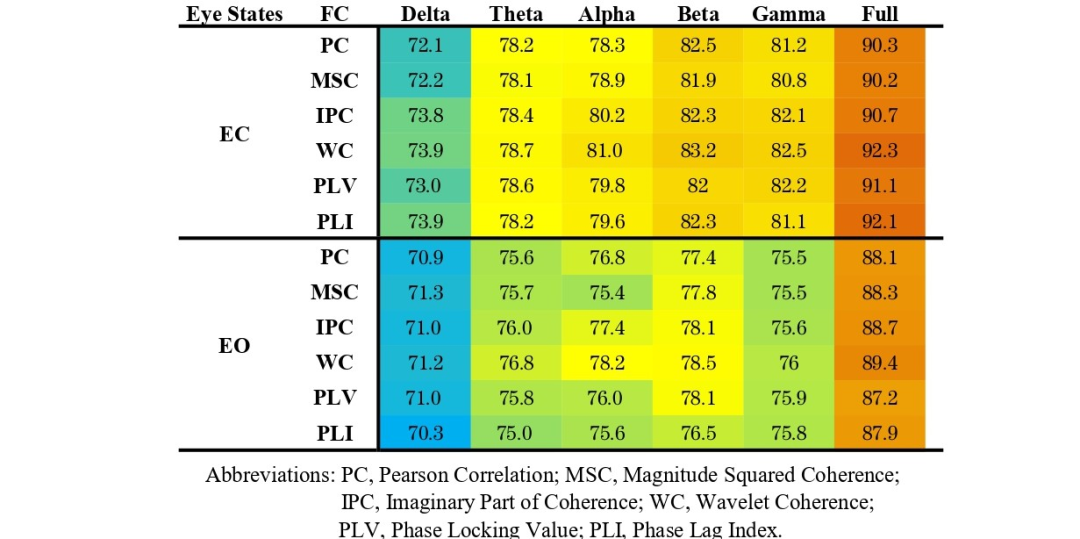
Table 1 Classification accuracy of HC and AD in eyes-open and eyes-closed states using different adjacency matrices with ST-GCN.
(Table source: Shan et al., Hum Brain Mapp, 2022)
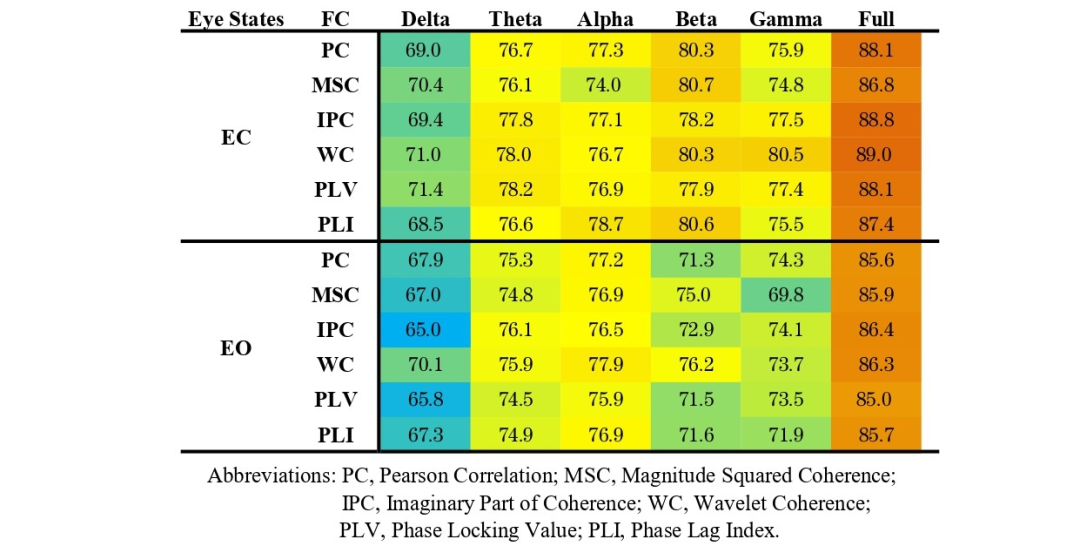
Table 2 Classification accuracy of HC and AD in eyes-open and eyes-closed states using different adjacency matrices with T-CNN.
(Table source: Shan et al., Hum Brain Mapp, 2022)
Notably, for different adjacency matrix calculation methods, the WC method outperforms all other methods in classification accuracy, demonstrating the effectiveness of time-frequency analysis in extracting coupling features between channels. For ST-GCN, the overall accuracy of the five functional connectivity methods is higher than that of the PC method, indicating that using functional connectivity as an adjacency matrix can improve the performance of the ST-GCN model to some extent.
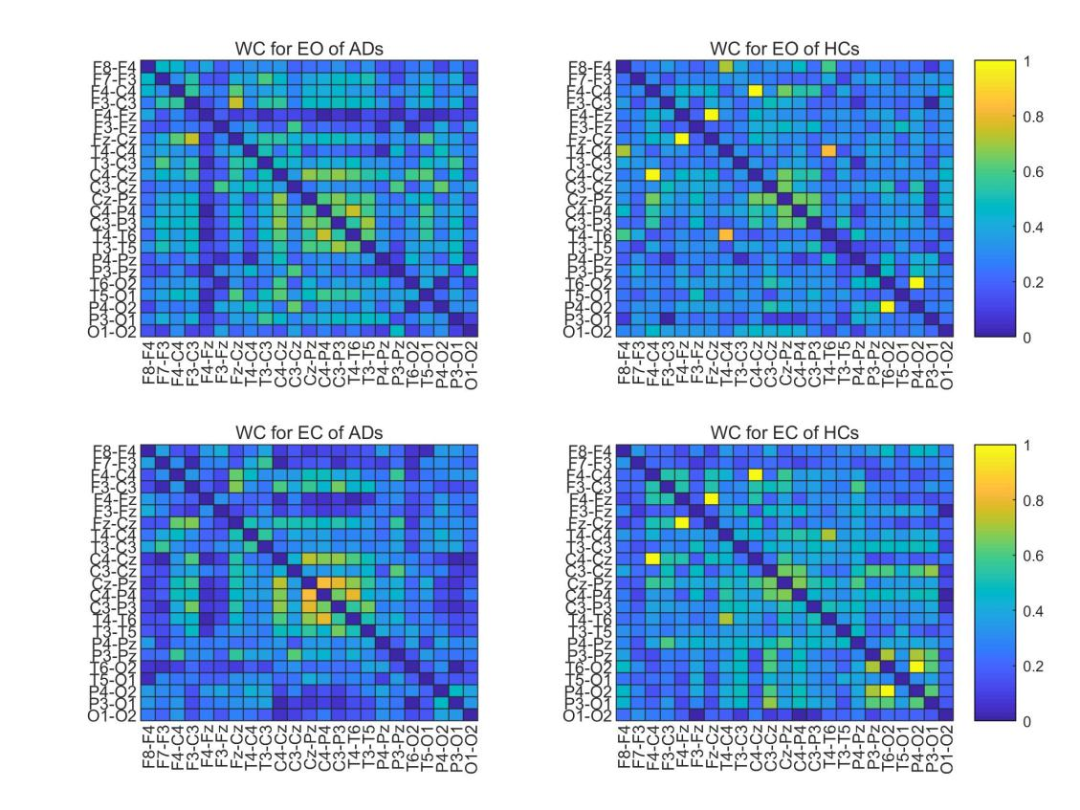
Figure 2 Average WC adjacency matrix of ADs and HCs.
(Table source: Shan et al., Hum Brain Mapp, 2022)
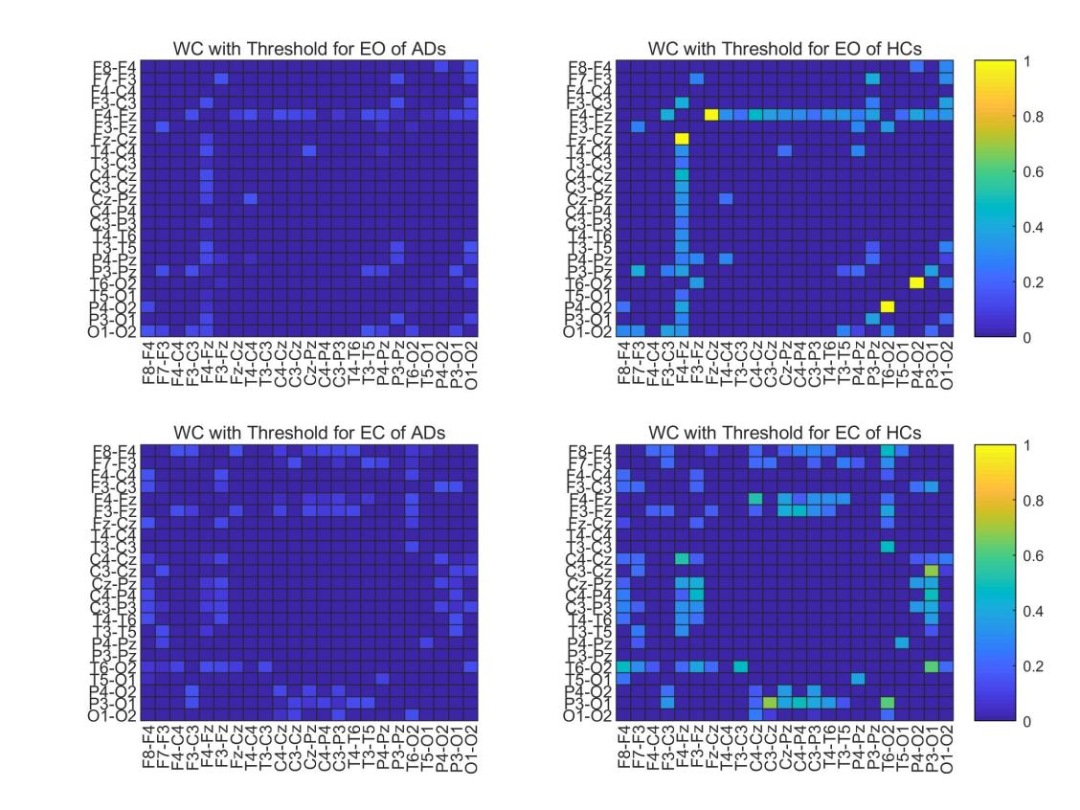
Figure 3 Average WC adjacency matrix of ADs and HCs with a threshold of 0.15.
(Table source: Shan et al., Hum Brain Mapp, 2022)
To further explore the effectiveness of using WC with optimal classification performance as an adjacency matrix, the authors conducted statistical analyses on all AD and HC data. As shown in Figure 2, by averaging the full-band WC adjacency matrices of all eyes-open and eyes-closed data segments for both AD and HC, their statistical characteristics can be analyzed.For AD, the coupling strength in the temporal-occipital region (the middle part of the adjacency matrix) is slightly higher in the eyes-closed state than in the eyes-open state, while for HC, the overall coupling strength in the eyes-closed state is slightly higher than in the eyes-open state. For both eyes-open and eyes-closed, the strongest inter-channel correlation for AD is less than 0.8 (the middle part of the left two images in Figure 2—temporal-occipital region), while HC has some inter-channel correlations close to 1 (the left anterior central and right posterior areas of the two images on the right in Figure 2). For both eyes-open and eyes-closed, the connectivity of ADs is lower than that of HCs in the lower right corner (posterior region). To visually display the connectivity between channels in the lower left corner in the eyes-open and eyes-closed states, the authors thresholded the two AD adjacency matrices on the left in Figure 2 to filter out channels with connectivity below 0.15 , and Figure 3 shows the corresponding indices for HC.
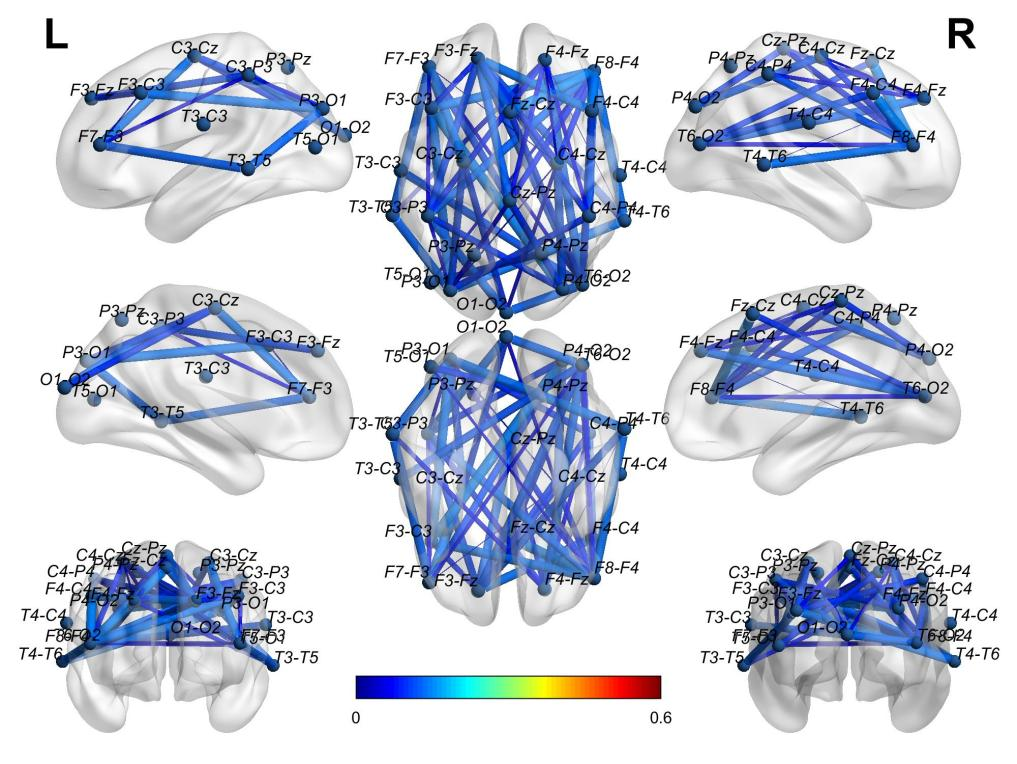
Figure 4 Average WC adjacency matrix of ADs in the eyes-open state shown in 3D brain mapping.
(Table source: Shan et al., Hum Brain Mapp, 2022)
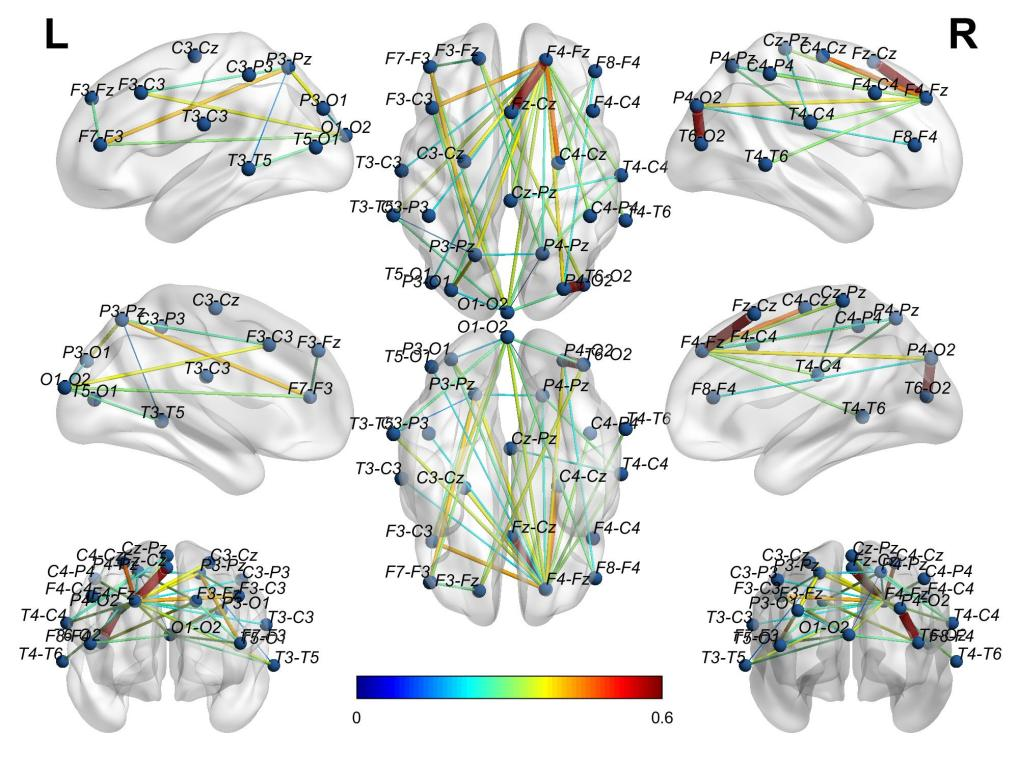
Figure 5 Average WC adjacency matrix of HCs in the eyes-open state shown in 3D brain mapping.
(Table source: Shan et al., Hum Brain Mapp, 2022)
Using the software BrainNet, the authors visually displayed the 3D connectivity distribution in the brains of AD and HC for both eyes-open (Figures 4, 5) and eyes-closed states (Figures 6, 7). Comparing the connectivity of channels in the front and back of the brain in the eyes-open state shown in Figure 4 and Figure 5, HC has far higher connectivity between channels than AD. The connectivity between channels from P4-O2 to T6-O2 and from F4-Fz to Fz-Cz in HC has the highest coupling strength (close to 0.6), while the corresponding coupling strengths in AD are close to 0. Comparing the connectivity in the eyes-closed state shown in Figure 6 and Figure 7, it can be observed that HC has far higher connectivity between channels in the posterior part of the brain than AD. For HC, the coupling strengths from C3-Cz to P3-O1 and from P3-O1 to T6-O2 are the highest (close to 0.6), while the corresponding coupling strengths in AD are as low as 0.1.
Figure 6 Average WC adjacency matrix of ADs in the eyes-closed state shown in 3D brain mapping.
(Table source: Shan et al., Hum Brain Mapp, 2022)
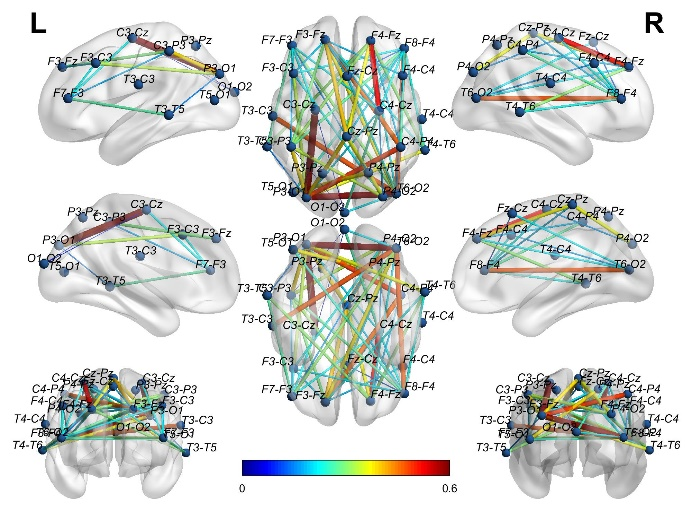
Figure 7 Average WC adjacency matrix of HCs in the eyes-closed state shown in 3D brain mapping.
(Table source: Shan et al., Hum Brain Mapp, 2022)
The conclusion and discussion of the article, inspiration, and outlook The authors proposed a spatiotemporal graph convolutional network (ST-GCN) that classifies Alzheimer’s disease (AD) and healthy controls (HC) by jointly utilizing cross-channel topological association features and channel temporal features recorded by electroencephalography (EEG). Unlike the leading GCN applications currently used for diagnosing brain diseases, this method explores the complex interaction information between EEG channels using brain functional connectivity methods. The main goal of this work is to explore whether cross-channel topological association features constrained by functional connectivity can reveal more hidden information effective for disease classification in EEG data and extend the applicability of GCN algorithms. For clinical AD and HC EEG datasets, ST-GCN achieves the highest classification accuracy when using wavelet coherence as the adjacency matrix. For the test dataset, the overall classification accuracy of ST-GCN is higher than that of the classic T-CNN method in both eyes-open and eyes-closed states and across different frequency bands, indicating that spatial topological constraints can indeed mine EEG features, thereby improving classification accuracy. Unlike existing studies on AD diagnosis based on EEG functional connectivity features [17-21] or temporal dynamic features [14-16, 22, 23], the proposed ST-GCN considers both the functional connectivity information of EEG channels and the corresponding dynamic features of EEG channels. ST-GCN can discover abnormalities in AD not only in the frequency response of local areas but also in the functional connectivity across regions. Additionally, the visualization of the wavelet coherence adjacency matrix provides evidence of abnormalities in the brains of AD, increasing the transparency of this solution. This research is significant as it will enhance trust in solutions developed based on artificial intelligence. The algorithm lays a potential effective strategy for applications in other brain diseases.
In this study, due to the limited number of subjects in the dataset, to avoid biased conclusions due to insufficient data, leave-one-out or cross-subject validation was not discussed. The accuracy of ST-GCN and T-CNN in cross-subject validation can be found in the supplementary materials. Although the overall accuracy of both methods significantly decreases, the proposed ST-GCN still outperforms T-CNN.
Original link:https://onlinelibrary.wiley.com/doi/10.1002/hbm.25994
Talent Recruitment【1】Talent Recruitment︱“Logical Neuroscience” is hiring for article interpretation/writing positions (online part-time, remote work)Selected Previous Articles【1】J Neuroinflammation︱Wu Qingping’s research group reveals important mechanisms of persistent neuronal sensitization and neuroinflammation in neuropathic pain【2】Neurosci Bull Review︱Research progress and challenges in constructing neural tube organoids【3】J Neuroinflammation︱Cao Song’s research group reveals that activation of locus coeruleus-spinal noradrenergic neurons alleviates pain in mice by reducing spinal dorsal horn neuroinflammation【4】STTT︱Jin Li/Zou Yunzeng/Li Liliang collaboration reveals that type 1 cannabinoid receptor antagonists alleviate antipsychotic drug-induced myocardial necrosis and toxicity【5】Nat Neurosci︱Breakthrough! Potassium channel rhodopsin mediates light-activated potassium channels for optogenetic inhibition【6】Acta Neuropathol︱Chen Chu’s research group reveals key factors promoting the development of Alzheimer’s disease after traumatic brain injury【7】Neurosci Biobehav Rev︱Tang Xiangdong’s team explores the efficacy of drug treatment and psychotherapy for PTSD night terrors【8】Cell Biosci︱Yi Litiao/Zhu Jixiao’s team reveals the role of the IL-1R/C3aR pathway in regulating synaptic pruning in depression【9】Cereb Cortex︱Wang Qun/Hu Wenhan/Wang Qian’s team reveals the two-stage auditory cortex processing mechanism regulated by speech intelligibility【10】Mol Neurobiol︱Liu Zhenhua’s research group reveals the role of DNAJ family genes in Parkinson’s diseaseRecommended High-Quality Research Training Courses【1】Patch Clamp and Optogenetics and Calcium Imaging Technology Seminar August 6-7 Tencent Meeting

References (Scroll to read)
[1] R. Brookmeyer, S. Gray, and C. Kawas, “Projections of Alzheimer’s disease in the United States and the public health impact of delaying disease onset.,” Am. J. Public Health, vol. 88, no. 9, pp. 1337–1342, 1998.
[2] R. Brookmeyer, E. Johnson, K. Ziegler-Graham, and H. M. Arrighi, “Forecasting the global burden of Alzheimer’s disease,” Alzheimer’s Dement., vol. 3, no. 3, pp. 186–191, 2007
[3] U. Smailovic et al., “Quantitative EEG power and synchronization correlate with Alzheimer’s disease CSF biomarkers,” Neurobiol. Aging, vol. 63, pp. 88–95, 2018.
[4] C. M. Michel, T. Koenig, D. Brandeis, L. R. R. Gianotti, and J. Wackermann, Electrical neuroimaging. Cambridge University Press, 2009.
[5] F. Babiloni et al., “Estimation of the cortical functional connectivity with the multimodal integration of high-resolution EEG and fMRI data by directed transfer function,” vol. 24, pp. 118–131, 2005, doi: 10.1016/j.neuroimage.2004.09.036.
[6] V. Sakkalis, “Review of advanced techniques for the estimation of brain connectivity measured with EEG/MEG,” Comput. Biol. Med., vol. 41, no. 12, pp. 1110–1117, 2011, doi: 10.1016/j.compbiomed.2011.06.020
[7] T. F. Tafreshi, M. R. Daliri, and M. Ghodousi, “Functional and effective connectivity based features of EEG signals for object recognition,” Cogn. Neurodyn., vol. 13, no. 6, pp. 555–566, 2019, doi: 10.1007/s11571-019-09556-7.
[8] P. van Mierlo et al., “Functional brain connectivity from EEG in epilepsy: Seizure prediction and epileptogenic focus localization,” Prog. Neurobiol., vol. 121, pp. 19–35, 2014, doi: 10.1016/j.pneurobio.2014.06.004.
[9] S. Zhang, D. Chen, Y. Tang, and L. Zhang, “Children ASD Evaluation Through Joint Analysis of EEG and Eye-Tracking Recordings With Graph Convolution Network,” Front. Hum. Neurosci., vol. 15, 2021.
[10] D. Zeng, K. Huang, C. Xu, H. Shen, and Z. Chen, “Hierarchy graph convolution network and tree classification for epileptic detection on electroencephalography signals,” IEEE Trans. Cogn. Dev. Syst., 2020.
[11] Y. Zhao et al., “EEG-Based Seizure detection using linear graph convolution network with focal loss,” Comput. Methods Programs Biomed., vol. 208, p. 106277, 2021..
[12] Y. Li, Y. Liu, Y.-Z. Guo, X.-F. Liao, B. Hu, and T. Yu, “Spatio-Temporal-Spectral Hierarchical Graph Convolutional Network With Semisupervised Active Learning for Patient-Specific Seizure Prediction,” IEEE Trans. Cybern., 2021.
[13] X. Chen, Y. Zheng, Y. Niu, and C. Li, “Epilepsy Classification for Mining Deeper Relationships between EEG Channels based on GCN,” in 2020 International Conference on Computer Vision, Image and Deep Learning (CVIDL), 2020, pp. 701–706.
[14] L. D. Deepthi, D. Shanthi, and M. Buvana, “An intelligent Alzheimer’s disease prediction using convolutional neural network (CNN),” Int. J. Adv. Res. Eng. Technol., vol. 11, no. 4, pp. 12–22, 2020.
[15] K. Li et al., “Feature Extraction and Identification of Alzheimer’s Disease based on Latent Factor of Multi-Channel EEG,” IEEE Trans. Neural Syst. Rehabil. Eng., vol. 29, pp. 1557–1567, 2021.
[16] C. J. Huggins et al., “Deep Learning of resting-state electroencephalogram signals for 3-class classification of Alzheimer’s Disease, Mild Cognitive Impairment and Healthy Ageing,” J. Neural Eng., 2021.
[17] M. Jalili, “Graph theoretical analysis of Alzheimer’s disease: Discrimination of AD patients from healthy subjects,” Inf. Sci. (Ny)., vol. 384, pp. 145–156, 2017.
[18] L. Tylová, J. Kukal, V. Hubata-Vacek, and O. Vyšata, “Unbiased estimation of permutation entropy in eeg analysis for alzheimer’s disease classification,” Biomed. Signal Process. Control, vol. 39, pp. 424–430, 2018..
[19] M. Fan, A. C. Yang, J.-L. Fuh, and C.-A. Chou, “Topological pattern recognition of severe Alzheimer’s disease via regularized supervised learning of EEG complexity,” Front. Neurosci., vol. 12, p. 685, 2018..
[20] Y. Zhao et al., “Imaging of nonlinear and dynamic functional brain connectivity based on EEG recordings with the application on the diagnosis of Alzheimer’s disease,” IEEE Trans. Med. Imaging, vol. 39, no. 5, pp. 1571–1581, 2019.
[21] L. Tait et al., “EEG microstate complexity for aiding early diagnosis of Alzheimer’s disease,” Sci. Rep., vol. 10, no. 1, pp. 1–10, 2020.
[22] X. Bi and H. Wang, “Early Alzheimer’s disease diagnosis based on EEG spectral images using deep learning,” Neural Networks, vol. 114, pp. 119–135, 2019..
[23] C. Ieracitano, N. Mammone, A. Bramanti, A. Hussain, and F. C. Morabito, “A convolutional neural network approach for classification of dementia stages based on 2D-spectral representation of EEG recordings,” Neurocomputing, vol. 323, pp. 96–107, 2019.
This article is complete

ᵐ