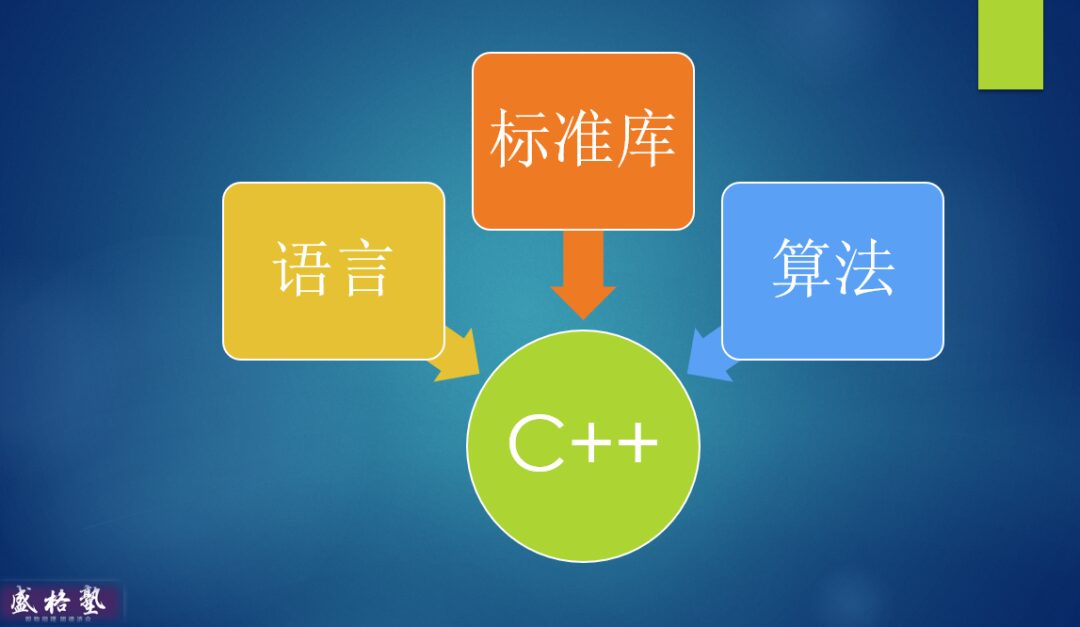
STL stands for Standard Template Library, one of the three major components of C++.
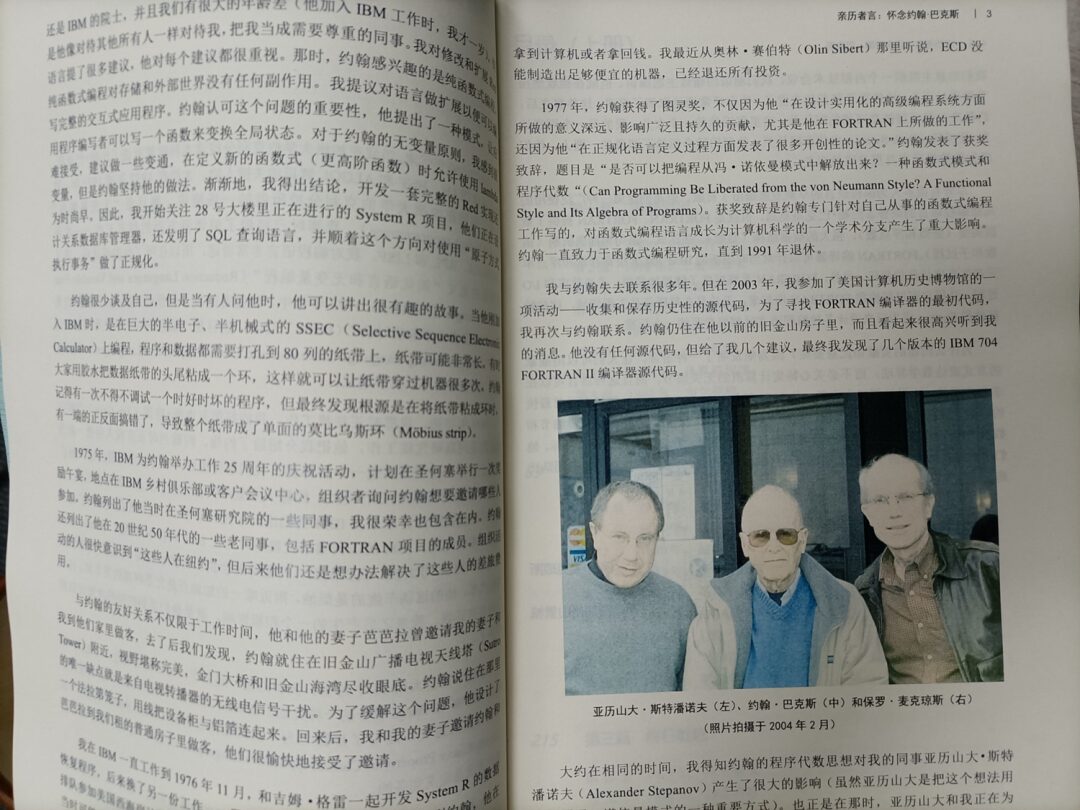
Alex is the core designer of STL. He was born in Moscow in 1950 and later moved to the United States, where he worked at companies like Adobe and A9.com. While working at Adobe, he was a colleague and good friend of Paul, and they co-published the book “Elements of Programming.”
I met Paul while writing “A Brief History of Software” and corresponded with him many times via email and video calls. In the preface of “A Brief History of Software,” he specifically mentioned that he and Alex once invited John Backus, the father of Fortran, to Adobe for a keynote speech.
The first major feature of STL is, of course, templates. Templates increase the generality of the STL library and give STL the following two characteristics:
– The source code is difficult to read and understand.
As for the debugging difficulties, they can be broken down into the following two points:
– The type names and function names after template expansion are often very long, convoluted, and intimidating.
– When observing STL objects, one often sees some difficult-to-understand design details and misses the attributes that users care about.
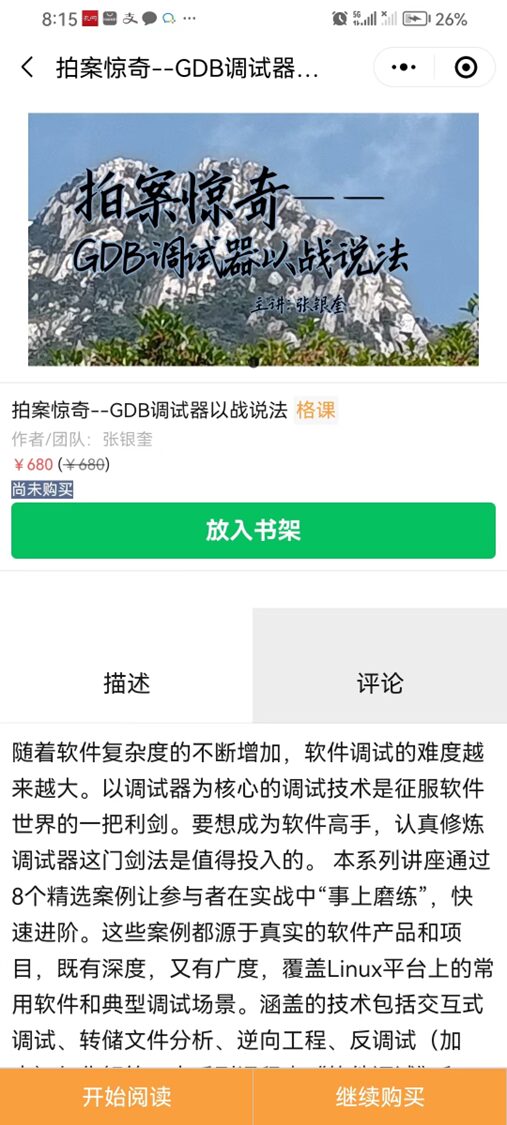
To address these issues, I shared a case in the preface of my GDB series lecture, discussing the challenges and solutions when debugging STL-related problems using GDB.
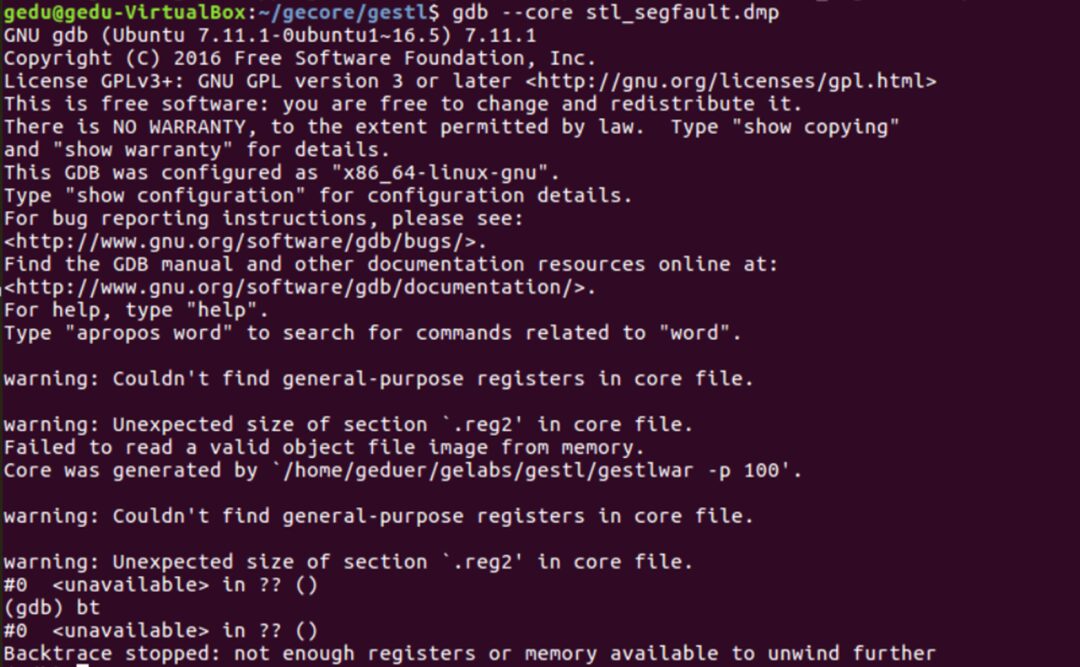
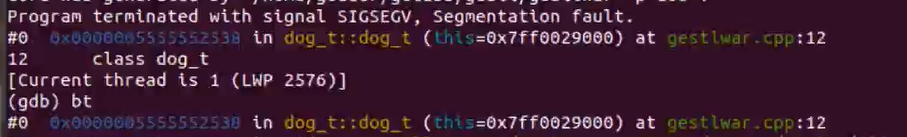
I first attempted to open the core file in an x86 virtual machine.
GDB gave four warnings, two pairs of question marks, and even basic information like registers were missing.
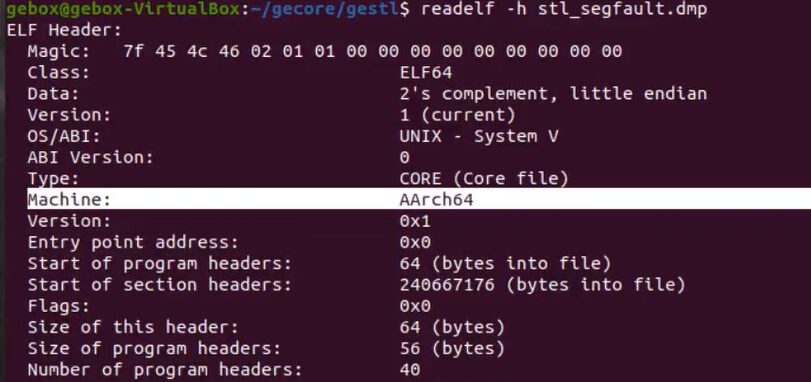
Using readelf to observe, the reason was that the core file was generated on an arm64 system.
So I switched to gdb-multiarch, and the situation improved significantly. Not only could I see the crash point, but I could also see a fairly complete call stack.
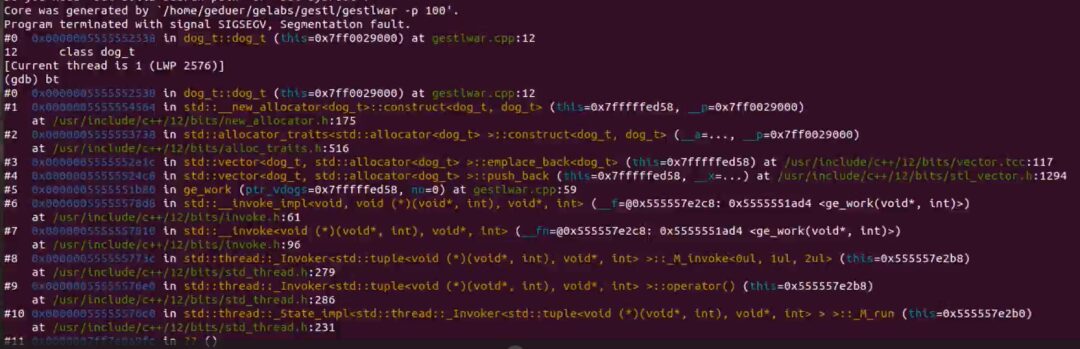
The crash occurred in the constructor of the dog_t class:
The constructor is extremely simple, and it seems like there shouldn’t be any errors:
dog_t(int age, const char* name) { age_ = age; name_ = name; }
From the disassembly, it appears that there was an error when accessing the object pointer.
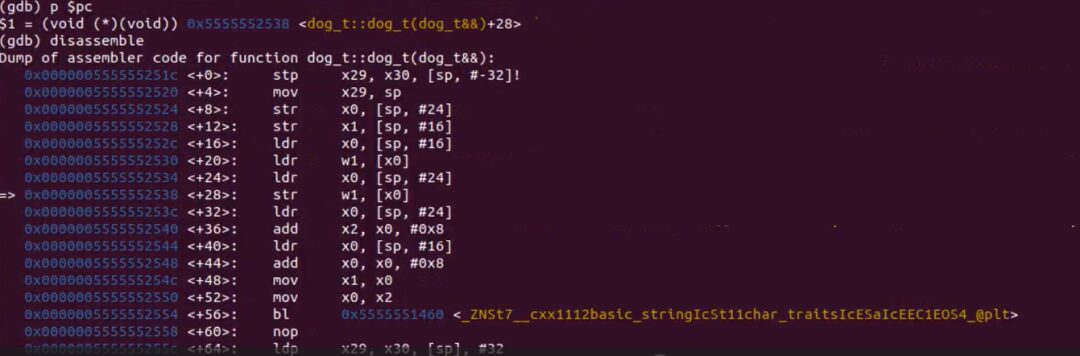
Where did the object pointer come from? From the parent function.
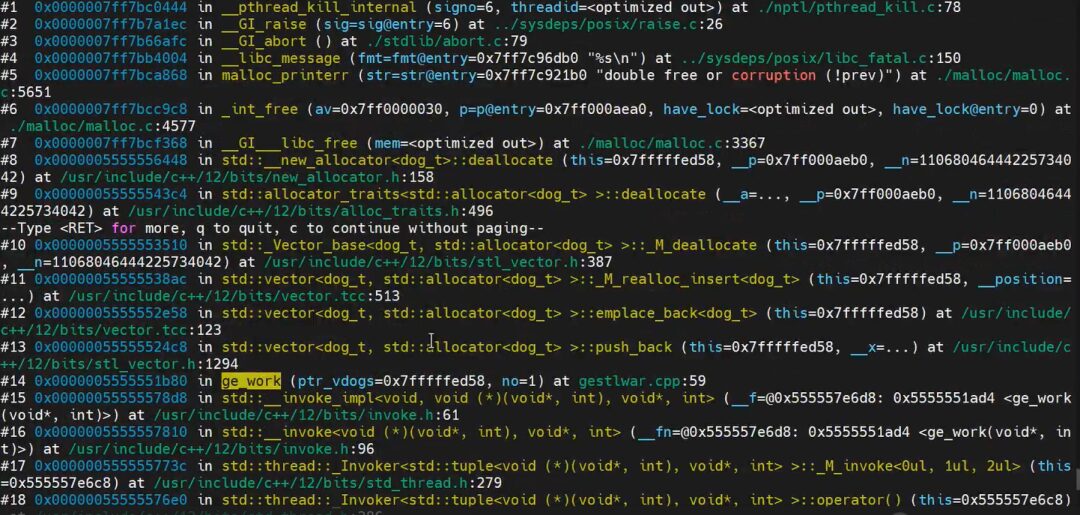
As I traced back through the call stack, I felt the earlier mentioned problem: long class names and long parameter names.
Only stack frame 5 was short, ge_work, which looks like a pure C function.
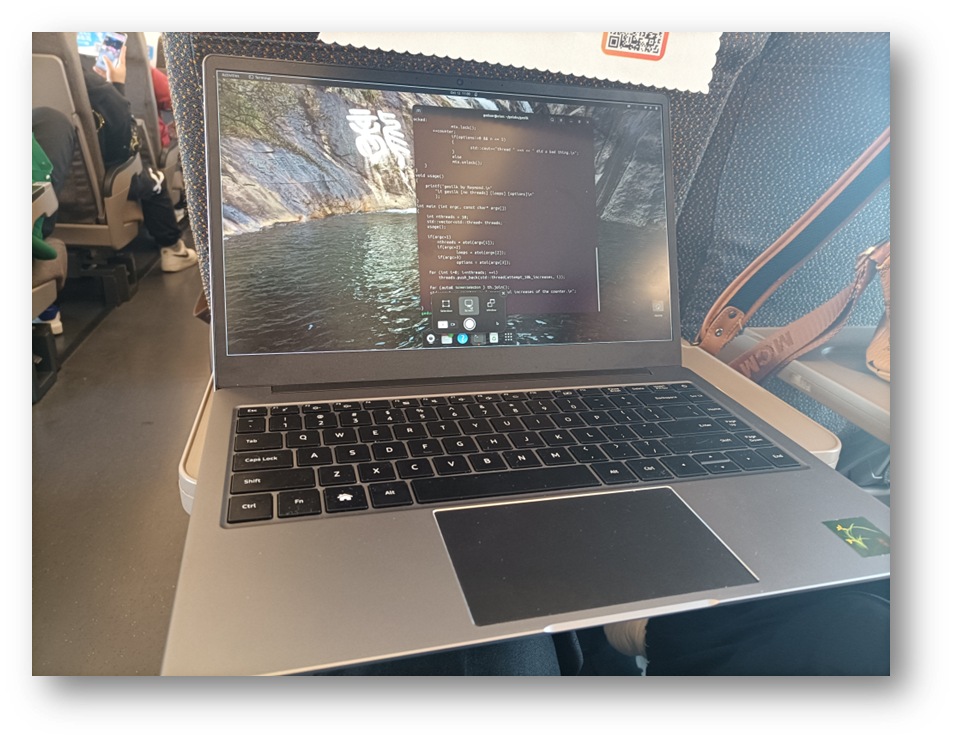
Using the frame command to switch to ge_work, then l, I could see its source code:
void ge_work(void* ptr_vdogs, int no){ int i = 0; vector<dog_t>* vdogs = (vector<dog_t>*)ptr_vdogs; cout << "thread " << no << " starts working" << endl; do { vdogs->push_back(dog_t(no*(i++), "little dog")); } while(1);}
It appears that this function is using the STL vector container to store dog_t objects.
So I wanted to know how many objects were already in the container at the time of the crash. Using the p command to observe, I saw only “noise”:

Next, I switched to use the Ulan codebook to analyze the same core file.
After opening the core file, gdb automatically downloaded the debug symbols because Ulan had already configured a symbol server based on debuginfod.
Next, using the same steps to switch to stack frame 5, I used the p command to observe the container, and this time I saw the information we wanted:
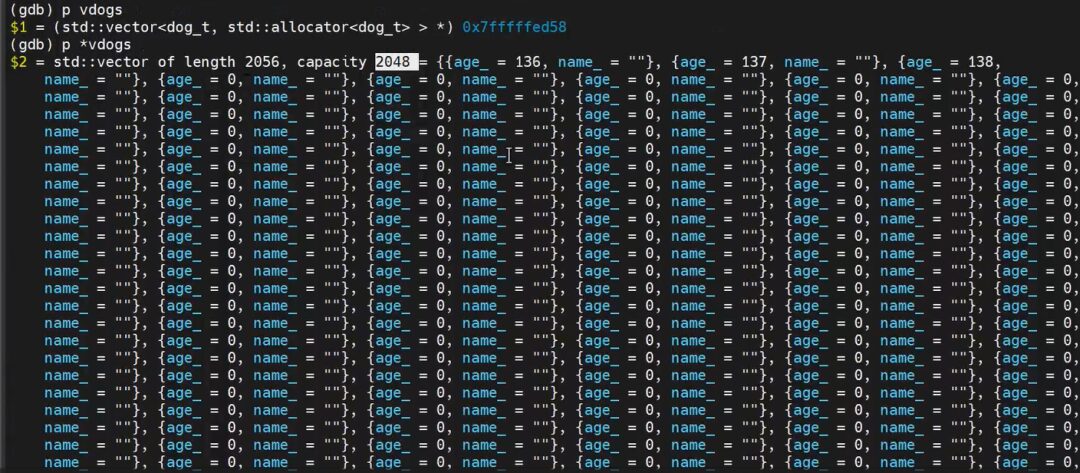
Compared to the last time, this time the information was much better, not only including a clear list of elements but also the two key attributes of the vector: length and capacity.
We were surprised to find that the length was 2056, while the capacity was 2048.
This is incorrect; length represents the actual number of elements, and capacity represents the container’s capacity. The former should be less than the latter.
However, now the former is greater than the latter, which clearly indicates a problem.
How could such a situation occur?
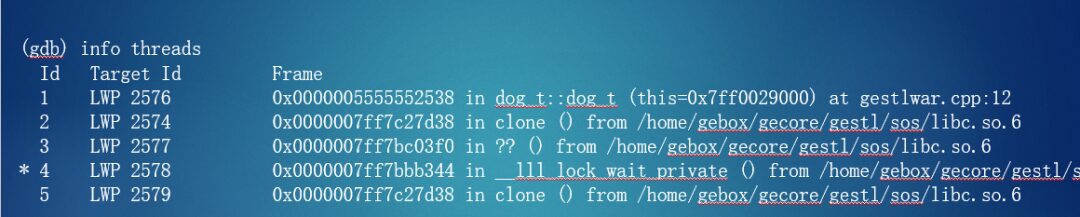
Using info threads to list all threads in the process:
Then using the thread apply all command to observe the call stack of each thread.
Browsing the results displayed by gdb, I could see that thread 4 was also operating on the STL vector object.

Switching to this thread and observing the vector object it operated on revealed that it was the same vector as thread 1.

This is clearly a coding error. Standard STL containers do not support concurrency, meaning that when used in multi-threading, the programmer must add locks for protection. This is the bug in this case.
So why was it so smoothly observed the attributes of STL objects on Ulan and quickly found the bug? The main reasons are as follows.
First, the version of gdb on Ulan is very high, specifically version 13.1. In contrast, the version in the unsuccessful virtual machine is 7.
geduer@ulan:~/gelabs/gestl$ gdb –version
GNU gdb (Ubuntu 13.1-2ubuntu2) 13.1
In fact, it was from gdb version 7.0 that the pretty-printers feature was introduced, using Python scripts to parse STL objects and display the attributes users want to see in an elegant format.
However, based on my actual tests, this feature does not work well in some versions of gdb 7. So using a higher version is more reliable.
Another reason is that Ulan automatically enabled the symbol server, allowing it to download debug symbols for libraries like libc from the internet. With these symbols, it became possible to observe multiple threads’ call stacks smoothly.
For example, without using the symbol server, the information in the thread list was only complete for thread 1, while other threads lacked current function information.
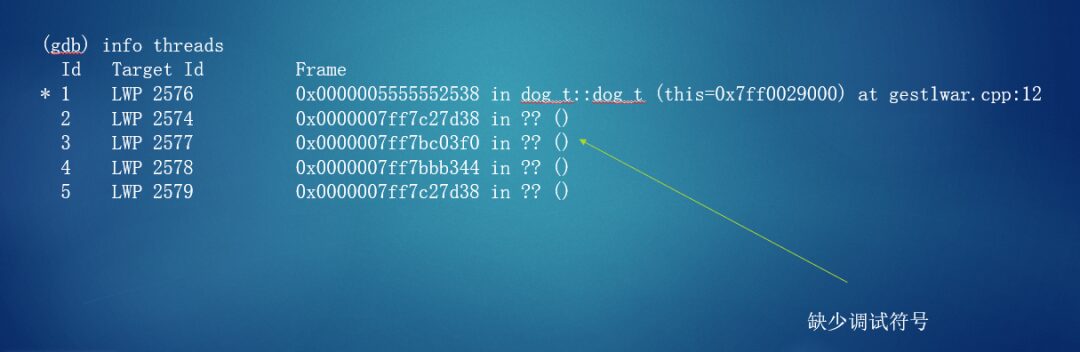
With the symbols, the information became complete.
GDB is a hard skill that software engineers need to master. In the next two months, I will be live-streaming every Saturday to explain the usage of GDB in a practical way.
Colleagues who want to learn with us can search for the “Shengge Academy” mini program in WeChat, and then search for GDB (note the capitalization) to find this course.
(Writing articles is hard work, and I kindly ask all readers to click “Looking” and feel free to share.)
*************************************************
With sincerity and dedication, we examine software through a humanistic lens and use software technology to change lives.
Scan the QR code below or search for the “Shengge Academy” mini program in WeChat to read more articles and audiobooks.

Also welcome to follow the WeChat public account of GeYou.