Visual Studio Code (VS Code) is a lightweight, cross-platform code editor that has become the preferred choice for many C++ developers due to its rich plugin ecosystem and powerful debugging capabilities. This article will introduce how to set up an efficient C++ development and debugging environment based on VS Code in a Linux (or WSL) environment, along with recommended plugins and practical configurations.
Basic Environment Preparation
-
Install VS Code Download from the official website or install using a package manager.
-
Install C++ Compiler It is recommended to use GCC or Clang. The installation of the compiler and introduction to the C++ programming environment have been covered previously, so we will not elaborate here. This article will take GCC on Ubuntu as an example:
sudo apt update sudo apt install build-essential -
Install Essential VS Code Plugins Here are some commonly recommended plugins:
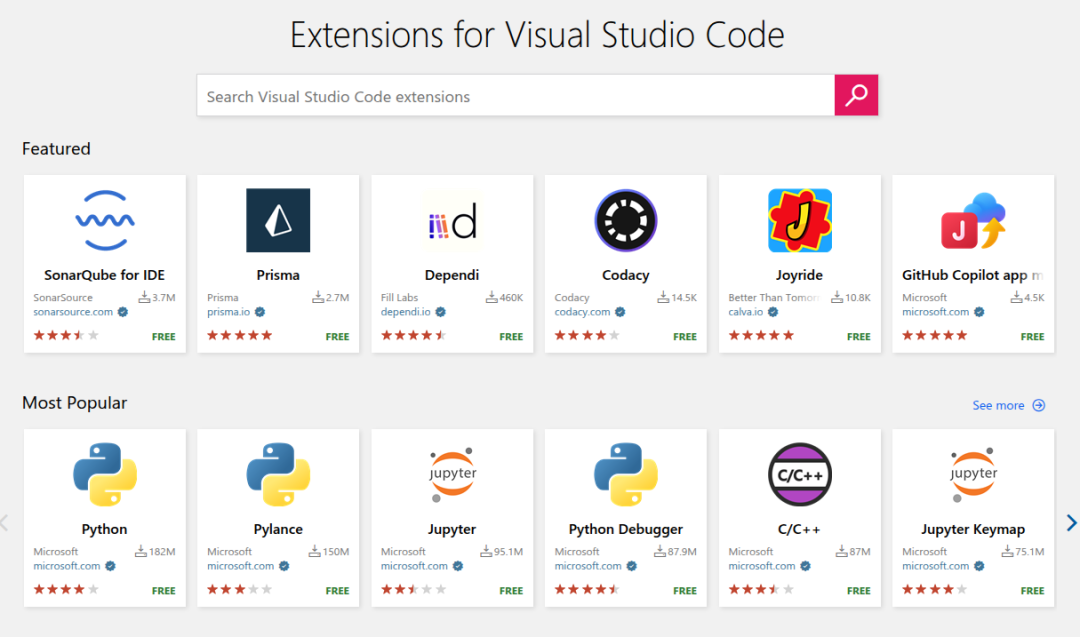
- C/C++ (ms-vscode.cpptools): Official Microsoft plugin for code completion, syntax highlighting, and debugging support.
- Better Comments (aaron-bond.better-comments): Displays comments in different colors.
- Clang-Format (xaver.clang-format): Code formatting, supports .clang-format configuration.
- indent-rainbow (oderwat.indent-rainbow): Distinguishes indentation visually through colors.
- CMake Tools (ms-vscode.cmake-tools): CMake project management and building.
- CodeLLDB (vadimcn.vscode-lldb): LLDB debugger support, suitable for macOS or Clang users.
- Better C++ Syntax (jeff-hykin.better-cpp-syntax): Enhanced syntax highlighting.
- Bracket Pair Color DLW (BracketPairColorDLW.bracket-pair-color-dlw): Highlights matching brackets.
- GitLens (eamodio.gitlens): Git integration and code history viewing.
- TODO Highlight (wayou.vscode-todo-highlight): Highlights TODO, FIXME, and other comments.
- Bookmarks (alefragnani.Bookmarks): Code bookmarks for quick navigation.
- Remote – SSH (ms-vscode-remote.remote-ssh): Remote development support.
- Copilot (GitHub.copilot): Open-source free AI assistant.
You can choose to manually install a specific plugin or use the command line for one-click installation, for example, the <span>C/C++</span> plugin:
code --install-extension ms-vscode.cpptools
Core Configuration File Explanation
User Settings (settings.json)
The settings.json file is located at<span>~/.config/Code/User/settings.json</span>. It is the user or workspace configuration file for VS Code, used to set editor behavior, plugin parameters, and development environment options. For example, you can configure indentation width, auto-formatting, C++ compiler path, IntelliSense mode, syntax highlighting, formatting style, etc. By customizing settings.json, you can make VS Code better adapt to personal or team development habits, improving development efficiency and code standardization. Path:
Common Configuration Examples:
{
    // workbench
    "workbench.editor.enablePreview": false,
    "workbench.editor.enablePreviewFromQuickOpen": false,
    "workbench.sideBar.location": "left",
    "workbench.tree.indent": 15,
    // system
    "json.maxItemsComputed": 80000,
    "terminal.integrated.fontSize": 16,
    // editor
    "editor.formatOnSave": true,
    "editor.fontSize": 19,
    "editor.renderWhitespace": "all",
    "editor.renderControlCharacters": true,
    "editor.detectIndentation": false,
    "editor.rename.enablePreview": false,
    "editor.smoothScrolling": false,
    "editor.cursorSmoothCaretAnimation": "off",
    "editor.minimap.maxColumn": 30,
    "editor.minimap.renderCharacters": false,
    "editor.suggest.insertMode": "replace",
    "editor.wordWrap": "on",
    "editor.autoIndent": "brackets",
    "[cpp]": {
        "editor.defaultFormatter": "xaver.clang-format"
    },
    "editor.quickSuggestions": {
        "other": false,
        "comments": false,
        "strings": false
    },
    "editor.parameterHints.enabled": false,
    "editor.rulers": [
        120,
        200
    ],
    "editor.lineHeight": 24,
    "editor.wordSeparators": "`~!@#$%^&*()-=+[{]}\\|;:'",.<>/?·~!¥…()—【】、;:‘’“”,。《》? ",
    // explorer
    "explorer.confirmDragAndDrop": false,
    "explorer.confirmDelete": false,
    "editor.largeFileOptimizations": false,
    // files
    "files.autoSave": "afterDelay",
    "files.trimFinalNewlines": true,
    "files.trimTrailingWhitespace": true,
    "files.insertFinalNewline": true,
    "files.autoGuessEncoding": true,
    // git
    "git.detectSubmodulesLimit": 300,
    "git.autofetch": false,
    "gitlens.codeLens.scopes": [
        "document"
    ],
    "gitlens.advanced.messages": {
        "suppressCommitHasNoPreviousCommitWarning": false,
        "suppressCommitNotFoundWarning": false,
        "suppressFileNotUnderSourceControlWarning": true,
        "suppressGitDisabledWarning": false,
        "suppressGitVersionWarning": false,
        "suppressLineUncommittedWarning": false,
        "suppressNoRepositoryWarning": false,
    },
    "gitlens.integrations.enabled": true,
    //extensions
    "extensions.ignoreRecommendations": true,
    // clang-format
    "clang-format.executable": "/usr/bin/clang-format-14",
    // todo-tree
    "todo-tree.general.tags": [
        "BUG",
        "HACK",
        "FIXME",
        "TODO",
        "XXX",
        "[ ]",
        "[x]"
    ],
    "todo-tree.regex.regex": "(//|#|<!--|;|/\*|^|^\s*(-|\d+.))\s*($TAGS)",
    "security.workspace.trust.untrustedFiles": "newWindow",
    "security.workspace.trust.banner": "never",
    "cmake.pinnedCommands": [
        "workbench.action.tasks.configureTaskRunner",
        "workbench.action.tasks.runTask"
    ],
    "explorer.confirmPasteNative": false,
}
Explanation:
- Auto-formatting, IntelliSense, specifying compiler paths, etc.
<span>clang-format.style</span>set to<span>file</span>, indicating to use the<span>.clang-format</span>file in the project root directory or specified path.- Enables features of plugins like Error Lens, Bracket Pair Colorizer, etc.
Code Snippets (cpp.json)
The cpp.json file is located at<span>~/.config/Code/User/snippets/cpp.json</span>, and it is the configuration file for C++ code snippets in VS Code. It is used to customize commonly used code templates to enhance writing efficiency. For example, by entering specific prefixes (like main, cerr, ///), you can quickly insert the main function, debug output, Doxygen comments, and other code blocks. This reduces repetitive typing and improves development speed and standardization. Each snippet can have a custom prefix, content, and description, suitable for personal or team coding styles.
Example Snippets:
{
    "main": {
        "prefix": "main",
        "body": [
            "#include <iostream>",
            "",
            "int main() {",
            "    std::cout << \"Hello, World!\" << std::endl;",
            "    return 0;",
            "}"
        ],
        "description": "C++ main function"
    },
    "Print to console": {
        "prefix": "cerr",
        "body": [
            "std::cerr << \" ${1:var} = \" << $1 << std::endl;",
        ],
        "description": "Log output to console"
    },
    "doxgen comment": {
        "prefix": "///",
        "body": [
            "///",
            "/// @brief $1",
            "/// @return $2",
            "///"
        ],
        "description": "Log output to console"
    }
}
Explanation:
- Typing
<span>main</span>auto-completes the main function template, enhancing coding efficiency. - Typing
<span>cerr</span>auto-completes the print command, enhancing coding efficiency. - Typing
<span>///</span>auto-completes Doxygen comments, enhancing coding efficiency.
Code Formatting (.clang-format)
<span>.clang-format</span> is a code formatting configuration file specifically used to define the formatting style of C++ (and other languages) code. Each project directory needs to have a <span>launch.json</span>. It can set rules for indentation, brace line breaks, alignment, spaces, comments, etc. VS Code, in conjunction with the Clang-Format plugin, will automatically format the code according to the specifications in the .clang-format file when saving or manually formatting, ensuring a consistent team code style and improving code readability and maintainability.
Core Configuration (partial excerpt), for more configurations please refer to https://github.com/sky-co/env_config/blob/main/.clang-format:
{
Language:        Cpp
IndentWidth:     4
AllowShortFunctionsOnASingleLine: All
BreakBeforeBraces: Custom
AlignTrailingComments: true
ColumnLimit:     0
Standard:        Auto
}
Explanation:
- Unifies code style, auto-formats on save, enhancing team collaboration efficiency.
Debug Configuration (launch.json)
The launch.json file is located at<span><project_path>/.vscode/launch.json</span> and is the debugging configuration file for VS Code, used to define parameters for the debugging session. It specifies the program path to debug, the type of debugger (such as gdb or lldb), the startup method, working directory, command line arguments, etc. Each project directory needs to have a <span>launch.json</span>. By configuring launch.json, you can achieve breakpoint debugging, variable viewing, step execution, and other functions to meet the debugging needs of multiple projects or files. Each debugging configuration can have a custom name for easy switching and management of different debugging scenarios.
Typical Configuration:
{
    // Use IntelliSense to learn about possible attributes.
    // Hover to view descriptions of existing attributes.
    // For more information, visit: https://go.microsoft.com/fwlink/?linkid=830387
    "version": "0.2.0",
    "configurations": [
        {
            "name": "main",
            "type": "cppdbg",
            "request": "launch",
            "program": "${workspaceRoot}/main",
            "args": [],
            "stopAtEntry": false,
            "cwd": "${workspaceRoot}",
            "environment": [],
            "externalConsole": false,
            "MIMode": "gdb",
            "setupCommands": [
                {
                    "description": "Enable pretty-printing for gdb",
                    "text": "-enable-pretty-printing",
                    "ignoreFailures": true
                },
                {
                    "environment-cd": "${workspaceRoot}",
                    "description": "location of source files",
                    "text": "set directories ${workspaceRoot}",
                    "ignoreFailures": true
                }
            ],
            "miDebuggerPath": "/usr/bin/gdb",
        },
    ]
}
Explanation:
- Supports breakpoint debugging, variable viewing, step execution, and other functions.
<span>program</span>specifies the path to the executable file, and<span>MIMode</span>selects the debugger (gdb or lldb).
Debugging Example
So far, the configuration of the debugging environment for VS Code has been completed. The remaining topics such as theme selection and icon styles are personal preferences and will not be discussed here. Based on the first C++ program mentioned in the introduction to the C++ programming environment, we will demonstrate a simple debugging process.
The code is as follows:
// hello.cpp
#include <iostream>

int main() {
    int test = 5; // For demonstration of watch functionality
    std::cout << "Hello World!" << std::endl;
}
Compile the Binary File
First, ensure that your C++ source file (like <span>hello.cpp</span>) is ready. Use the following command to compile and generate an executable file with debugging information:
g++ -g -O0 Hello.cpp -o hello
<span>-g</span>option is used to generate debugging information, making it easier for the debugger to identify source line numbers and variables.<span>-O0</span>disables optimization, ensuring that variables and flow during debugging match the source code.
Configure launch.json
Create or edit the <span>launch.json</span> file in the <span>.vscode</span> folder at the project root to configure debugging parameters.
Typical configuration is as follows:
{
    "version": "0.2.0",
    "configurations": [
        {
            "name": "Debug hello",
            "type": "cppdbg",
            "request": "launch",
            "program": "${workspaceFolder}/hello",
            "args": [],
            "stopAtEntry": false,
            "cwd": "${workspaceFolder}",
            "environment": [],
            "externalConsole": false,
            "MIMode": "gdb",
            "miDebuggerPath": "/usr/bin/gdb"
        }
    ]
}
<span>program</span>specifies the path to the executable file.<span>MIMode</span>selects the type of debugger (GDB or LLDB).- Other parameters can be adjusted according to actual needs.
Set Breakpoints and Start Debugging
-
Open
<span>hello.cpp</span>in the VS Code editor, click to the left of the line number to set a breakpoint (red dot). -
Press
<span>F5</span>or click the “Start Debugging” button in the “Run and Debug” panel on the left.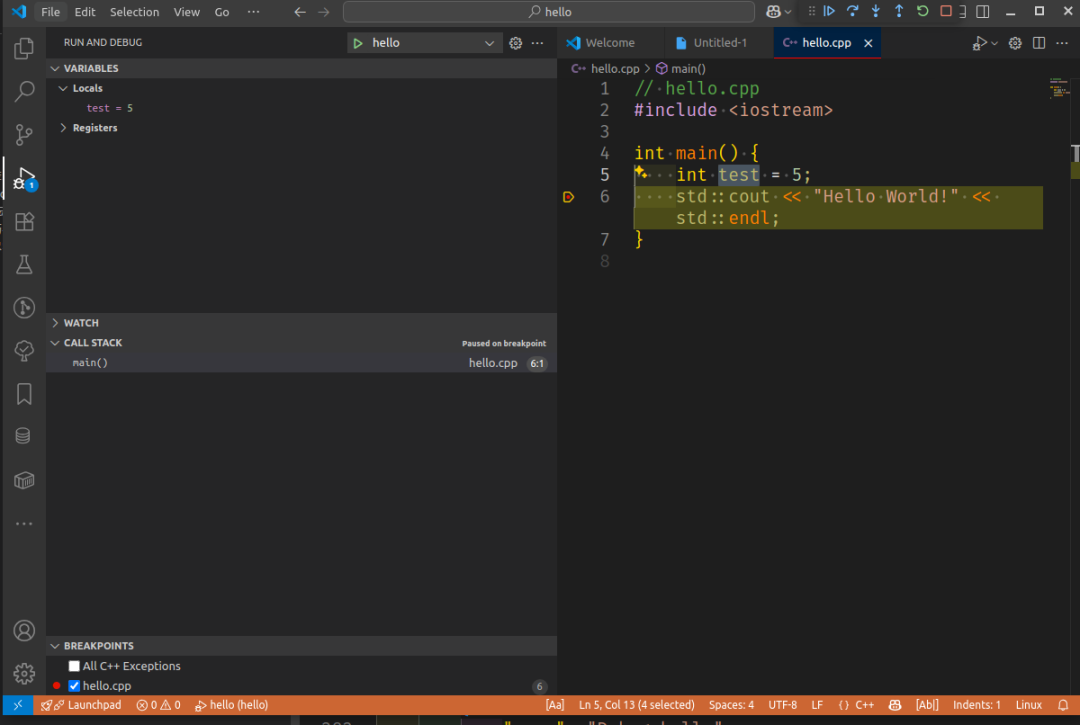
-
The program will pause at the breakpoint, allowing you to view variables, call stacks, step through (F10/F11), evaluate expressions, etc.
-
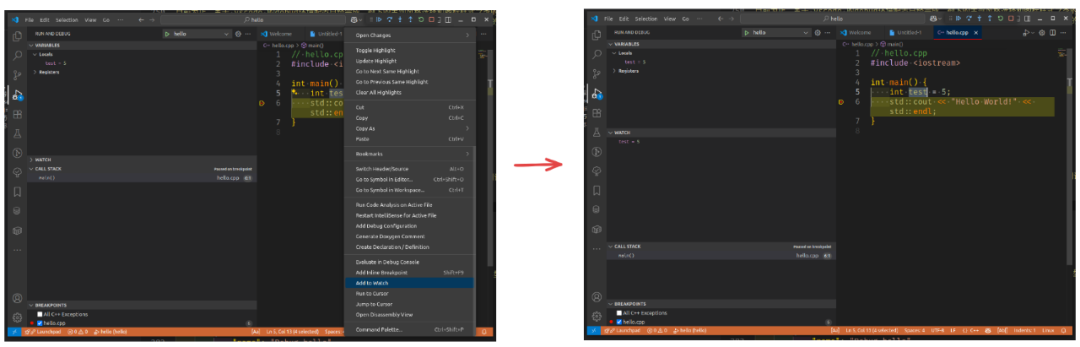
Right-click “Add Watch” to add the selected variable of interest to the watch list on the left for easy observation.
-
Use the “Debug Console” to input GDB commands or expressions to assist in troubleshooting.
Common operations during debugging:
- F5: Start/Continue
- F9: Set/Remove Breakpoint
- F10: Step Over
- F11: Step Into
- Shift+F5: Stop Debugging
Advanced Techniques and Common Issues
- Remote Debugging: You can debug on remote servers or WSL environments using the Remote-SSH/WSL plugin.
- Multi-file/Multi-project Debugging: launch.json supports multiple configurations for flexible switching of debugging targets.
- Variable Watching and Expression Evaluation: You can add watch expressions in the “Variables” panel to view variable values in real-time.
- Conditional Breakpoints: Right-click on a breakpoint to set a conditional breakpoint that only pauses when the condition is met.
- Debugging Performance Issues: Use tools like perf, valgrind, etc., to locate performance bottlenecks.
- Common Issues:
- Not adding
<span>-g</span>during compilation leads to inability to debug with breakpoints. - High optimization levels (like
<span>-O2</span>) make variables invisible. - Incorrect path or parameter configuration in launch.json prevents the debugger from starting.
Through the above steps, you can efficiently compile, debug, and troubleshoot C++ programs in VS Code.
Advanced Techniques and Common Issues
- Remote Development: With the Remote – WSL/SSH/Containers plugin, you can seamlessly develop and debug C++ projects in WSL, remote servers, or containers.
- CMake Project Management: The CMake Tools plugin supports automatic detection of CMakeLists.txt, facilitating multi-platform builds and debugging.
- Static Code Analysis: You can integrate tools like cpplint, clang-tidy, etc., to improve code quality.
- Multi-file/Multi-project Debugging: launch.json supports multiple configurations for flexible switching of debugging targets.
- Header File Auto-completion and Navigation: Include Autocomplete and C/C++ plugins support intelligent completion and navigation of header files.
Conclusion
This article systematically introduces the entire process of setting up an efficient C++ development and debugging environment using VS Code in a Linux/WSL environment, including basic software installation, recommended plugins, core configuration file explanations, code formatting, debugging configuration, and practical debugging operation demonstrations. By reasonably configuring settings.json, launch.json, and integrating plugins like Clang-Format and CMake Tools, developers can achieve features like code auto-completion, formatting, breakpoint debugging, and remote development, greatly enhancing development efficiency and code quality. I hope this article can assist C++ developers in their daily development, debugging, and project management in VS Code.
Reference Resources
- Official C++ Configuration Tutorial for VS Code
- Ubuntu Environment Configuration
- Visual Studio Code Tips and Tricks
- Enhance Your C/C++ Development
Ending with a 50% discount link
Advanced C++23 Programming
https://u.jd.com/YDbpGGG
C++20 Template Metaprogramming
https://u.jd.com/YGbSvDi