Abstract
The method of Diffusion Tensor Imaging Analysis along the Perivascular Space (DTI-ALPS) aims to evaluate the function of the glymphatic system (GS). However, few studies have confirmed its reliability and reproducibility. DTI data from 50 participants from the MarkVCID consortium were included in this study. Two pipelines developed using DSI Studio and FSL software were used for data processing and ALPS index calculation. The ALPS index was obtained by averaging the bilateral ALPS indices, and R Studio software was used to test cross-vendor, inter-rater, and test-retest reliability. The ALPS index showed good inter-scanner reproducibility (ICC=0.77-0.95, P<0.001), inter-rater reliability (ICC=0.96-1, P<0.001), and test-retest reproducibility (ICC=0.89-0.95, P<0.001), providing potential biomarkers for in vivo evaluation of GS function.
Key words: Diffusion tensor image analysis along the perivascular space (DTI-ALPS), Neurofluids, Brain, glymphatic system, MarkVCID consortium
Introduction
The glymphatic system (GS) is a recently discovered brain-wide perivascular fluid transport system in the central nervous system (CNS). This system is believed to facilitate the clearance of waste from the brain interstitial fluid (ISF) through the exchange of ISF and cerebrospinal fluid (CSF) mediated by aquaporin-4 (AQP4) water channels expressed by astrocytic end-feet. The GS serves as the “front-end” drainage pathway for the brain, connecting to downstream lymphatic networks via meningeal lymphatics, cranial nerves, and large vessels to clear waste and excess fluid from the central nervous system. Therefore, the GS is crucial for maintaining brain fluid homeostasis throughout life. Increasing evidence suggests that impaired glymphatic transport is associated with various neurological diseases, including cerebral small vessel disease (cSVD), Alzheimer’s disease (AD), hydrocephalus, diabetes, traumatic brain injury, and stroke. Furthermore, GS dysfunction is related to sleep disorders and the deposition of tau and beta-amyloid (Aβ), which are mechanisms of cognitive impairment and dementia. The application of magnetic resonance imaging (MRI) in the study of GS in vivo has recently advanced. Dynamic contrast-enhanced (DCE) MRI and T1 mapping MRI techniques allow for the visualization of glymphatic flow pathways in vivo and further simulate glymphatic flow processes, providing insights into GS function. However, these methods require intrathecal injection of contrast agents, which is not suitable for humans.
In recent years, a new method called “Diffusion Tensor Imaging Analysis along the Perivascular Space (DTI-ALPS)” has been proposed for non-invasive assessment of GS clearance function using diffusion MRI. In this method, the movement of water molecules in the direction of the perivascular space is assessed by measuring the diffusion rate. It is assumed that the perivascular space extends in the same direction as the medullary veins at the level of the lateral ventricle body, which is perpendicular to the lateral ventricle wall. This left-right direction is defined as the x-axis. In the plane of this region, adjacent projection fibers extend in the head-foot direction, and association fibers extend in the anterior-posterior direction, which are orthogonal to the direction of the perivascular space, defined as the y-axis and z-axis, respectively. When histological changes occur in the direction of the perivascular space, it affects the diffusion rates of projection and association fibers. Therefore, the ALPS index is determined by the ratio of the x-axis diffusion rate of the projection fiber region (Dxxproj) and the average x-axis diffusion rate of the association fiber region (Dxxassoc) to the y-axis diffusion rate in the projection fiber region and the average z-axis diffusion rate in both fiber regions (Dyyproj).
Currently, nearly 40 clinical studies have used the DTI-ALPS method to investigate GS function, covering a range of neurological diseases such as normal aging, cSVD, stroke, dementia, TBI, hydrocephalus, epilepsy, multiple sclerosis, sleep disorders, and tumor-associated edema. In particular, the ALPS index has been associated with conventional DCE MRI methods using intrathecal Gd contrast agents, conventional MRI biomarkers for cSVD, and clinical assessments of cognitive impairment. However, there is a lack of studies on the cross-vendor and test-retest reliability of the DTI-ALPS method. Recently, only one single-center study has assessed the reproducibility of the ALPS index. The current study aims to conduct cross-vendor, inter-rater, and test-retest validation of the DTI-ALPS method using the cohort from the MarkVCID consortium.
Materials and Methods
The MRI data used in this study were obtained as part of the MarkVCID consortium. The first phase of the MarkVCID consortium consisted of seven sites. Instrument validation included: (1) inter-scanner reproducibility (differences between different MRI scanners from the same group of individuals at different sites within a 3 to 90-day interval), (2) inter-rater reliability (differences between two raters analyzing the same MRI dataset), and (3) test-retest reproducibility (differences between two scans of the same individual and MRI scanner within a 1 to 14-day interval). The 3T MRI scanners used at the seven sites included two Siemens systems (TIM Trio and Prisma), one Philips system (Achieva), and one GE system (750W). Participants in this study ranged in age from 54 to 89 years (71±9 years, 14 males, 36 females). Participants with unstable major illnesses, significant primary psychiatric disorders, or neurological diseases commonly confounding diffusion rate analysis were excluded. Participants had Fazekas periventricular white matter (PVWM) scores of 0-3 (2.0±0.8), Fazekas deep white matter (DWM) scores of 0-3 (1.8±1.0), Clinical Dementia Rating (CDR) scores of 0-1 (0.6±1.0), and Montreal Cognitive Assessment (MoCA) scores of 10-30 (25±4).
MRI acquisitionThe diffusion tensor imaging (DTI) acquisition protocol of MarkVCID used a single shell, b=1000s/mm², 40 directions, voxel size of 2.0×2.0x2.0 mm³, and 6 b=0 s/mm². The phase encoding (PE) direction of the 40-direction dataset was chosen as “PA” and a separate shorter dataset (two b=0 scans, six b=1000 scans) had its PE direction reversed to “AP”. The reverse PE polarity data were used to estimate and correct image distortion. The imaging parameters of the MarkVCID sequence on different MRI scanners (Philips Achieva, Siemens Prisma and Trio, GE 750W) have been described in previous studies and are summarized as follows: Field of View (FOV) = 256×256 mm², matrix = 128×128, resolution=2×2 mm², slice thickness = 2mm, 80 slices, Repetition Time (TR)/Echo Time (TE) = 9014/75ms (Philips Achieva), 8600/68ms (Siemens Prisma), 9800/84ms (Siemens Trio), 14453/75 ms (GE 750W), b=0 and 1000 s/mm² with 40 directions.DTI data processing protocolGeneral DTI data processing includes: (1) correcting phase distortion of DTI images using reverse PE volume, followed by eddy current and head motion correction, (2) generating color-coded fractional anisotropy (FA) maps and diffusion maps in the x-axis (right-left; Dxx), y-axis (anterior-posterior; Dyy), and z-axis (inferior-superior; Dzz) directions, (3) transforming the reconstructed images or FA maps into template space using linear and nonlinear transformations, and applying the transformation matrix to all diffusion maps, (4) placing regions of interest (ROIs) in the projection and association fiber regions at the level of the lateral ventricle body. DTI data lacking reverse PE data or b=0 images skipped TOPUP correction. We used DSI Studio graphical user interface software version 10.15 (DSI Studio GUI; https://dsi-studio.labsolver.org/) (Fig.1) and FMRIB Software Library version 6.0 (FSL; Oxford Centre for Functional MRI of the Brain, Oxford, UK; https://fsl.fmrib.ox.ac.uk/fsl/) (Fig.2). The pipeline is described as follows.DSI Studio pipelineIn this pipeline, all processing steps are performed using the DSI Studio GUI. The 4D DTI volume DICOM files are first converted to SRC files, followed by preprocessing of the images using TOPUP/EDDY and motion programs for phase distortion, eddy current, and motion correction, and reconstruction using the Q-space Diffeomorphic reconstruction (QSDR) method, which is the MNI version of generalized Q-sampling imaging (GQI) that automatically transforms images into MNI space and spatially normalizes to ICBM152_. Subsequently, color-coded FA maps and x, y, and z axis diffusion rate maps are estimated and output. Projection and association fibers are identified on the color-coded FA maps, and spherical ROIs (diameter, 12 pixels [≈9.4mm]) are manually drawn and placed in the bilateral projection and association fiber regions at the level of the lateral ventricle body. The center coordinates of the ROIs are as follows: left projection fibers (53,47,40), left association fibers (59,47,40), right projection fibers (25,47,40), right association fibers (19,47,40). A total of 4 ROIs are placed on the color-coded FA and diffusion rate maps of each subject. The diffusion rate values of Dxx, Dyy, and Dzz for the bilateral projection and association fibers are then obtained for ALPS calculation (Fig.1).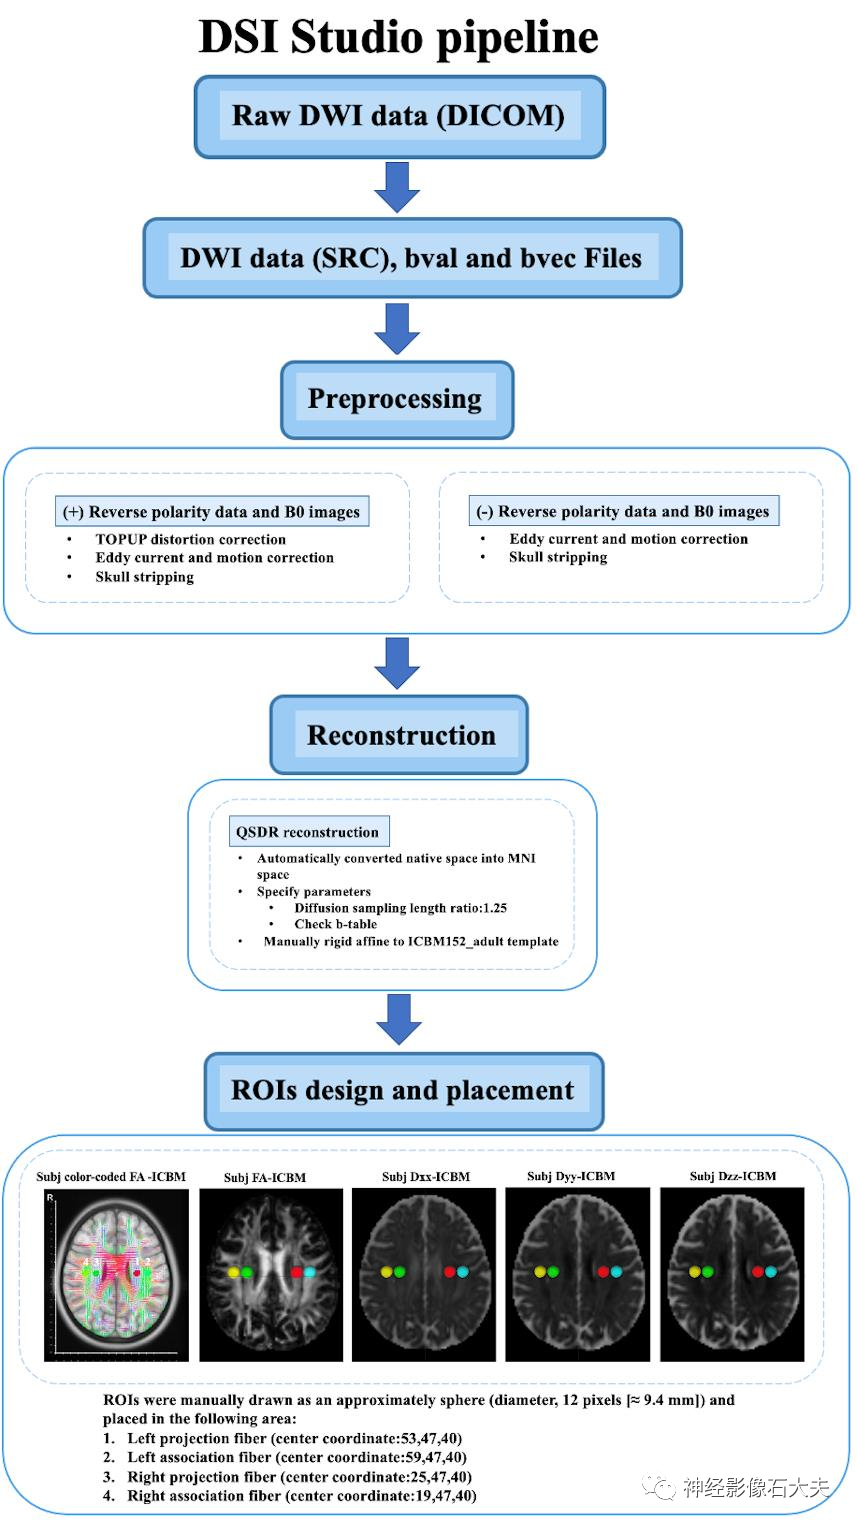
Fig. 1. The DTI data processing workflow of DSI Studio pipeline.
FSL pipelineUsing MRIcroGL GUI, the 4D DTI volume DICOM files are converted to NIFTI files. We created an internal bash script to use DTI images as input and include FSL and MRtrix3 commands to calculate the ALPS index. DTI images are denoised using the Marchenko Pastur principal component (MP-PCA) denoising algorithm and Gibbs denoising using the “dwisenoise” and “mrdegibbs” commands from MRtrix3. Distortion, eddy current, and motion corrections caused by magnetic susceptibility are completed using FSL’s “topup” and “eddy” commands. The “dtifit” command from FSL generates FA maps and x, y, and z axis diffusion rate maps. Each subject’s FA map is registered to the JHU-ICBM-FA template, and the transformation matrix is applied to all diffusion rate maps using FSL’s “flirt” command. Based on the JHU-ICBM-DTI-81 white matter labeling atlas, the projection and association fibers at the level of the lateral ventricle body are identified as the superior corona radiata (SCR) and superior longitudinal fasciculus (SLF), and ROIs are automatically defined as spheres with a diameter of 5mm in the bilateral SCR and SLF regions, applied to the diffusion maps of all subjects. The center coordinates of the ROIs are as follows: left SCR (116,110,99), left SLF (128,110,99), right SCR (64,110,99), and right SLF (51,110,99). The diffusion rate values of Dxx, Dyy, and Dzz for the bilateral SLF and SCR are automatically output for ALPS calculation (Fig.2).
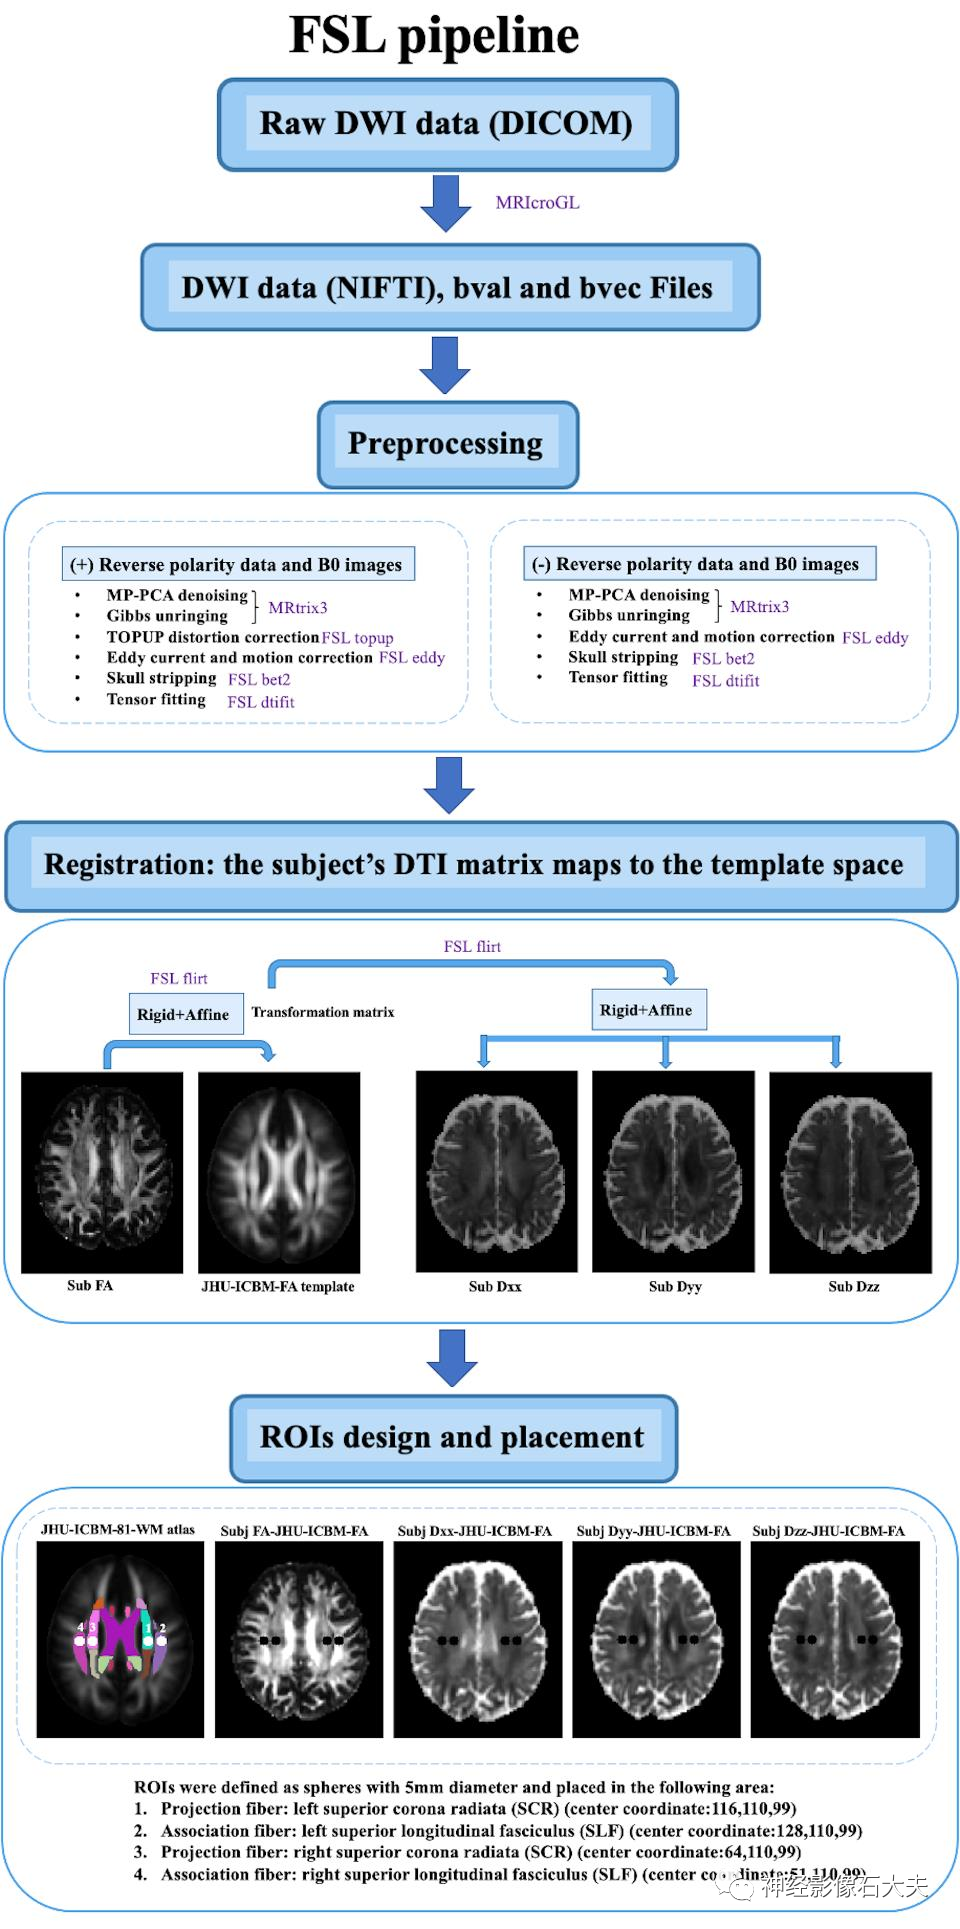
Fig. 2. The DTI data processing workflow of FSL pipeline.
ALPS index calculationThe ALPS index is defined as the average of the bilateral ALPS indices (mean ALPS index), calculated by the ratio of the x-axis diffusion rate in the projection fiber region (Dxxproj) and the average x-axis diffusion rate in the association fiber region (Dxxassoc) to the y-axis diffusion rate in the projection fiber region (Dyyproj) and the average z-axis diffusion rate in the association fiber region (Dzzassoc), as follows: The ALPS index is used for reliability and reproducibility validation in both DSI Studio and FSL pipelines.Statistical analysisInter-scanner reproducibility: The inter-scanner reproducibility of the ALPS index between the four scanners was assessed using the intraclass correlation coefficient (ICC). It utilized a two-way random effects model with a single measure and consistency form, denoted as ICCc, calculated as follows:
 where MSR = mean square for rows (i.e., participants), MSE = mean square error, k = number of raters. Pairwise ICCc between each pair of scanners was also calculated using R Studio, with significance defined as P<0.05.
Inter-rater reliability: To assess the inter-rater reliability of the ALPS index between two raters independently analyzing the same DTI dataset, we calculated the ICC using a two-way random effects model with a single measure and absolute agreement form, denoted as ICCAA, calculated as follows:
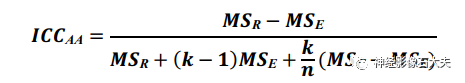 where MSc = mean square for columns (i.e., raters), n = number of subjects. ICCAA estimates the consistency between measurements without allowing systematic error. Pairwise ICCAA between raters was also calculated using R Studio, with significance defined as P<0.05.
Test-retest reproducibility: To assess the test-retest reproducibility of the ALPS index, we calculated the ICCAA between two scans of the same individual and MRI scanner within 14 days using the two-way random effects model as described above. Pairwise ICCAA between test and retest was calculated using R Studio, with significance defined as P<0.05.
To visualize the results of inter-scanner reproducibility, inter-rater reliability, and test-retest reproducibility analyses, Bland-Altman plots were created using R Studio. The terms “poor,” “moderate,” “good,” and “excellent” are defined as ICC values <0.5, between 0.5 and 0.75, between 0.75 and 0.9, and >0.9, respectively.ResultsInter-scanner reproducibility
A total of 15 participants were recruited for the inter-scanner study, with each participant scanned on four MRI scanners at the MarkVCID sites, including Philips Achieva, Siemens Trio, Siemens Prisma, and GE750W, resulting in a final sample size of 60 ALPS index measurements (4 scanners × 15 subjects). Bland-Altman plots and scatter plots illustrate the ICCc results of the ALPS index between each pair of scanners for the 15 participants, analyzed using both DSI Studio and FSL pipelines (Fig. 3, Fig. 4, Fig. 5, and Fig. 6). The pairwise ICCc values were all significant (P<0.001): Philips-GE was 0.91 (95% CI [0.74; 0.97]) (DSI Studio pipeline) and 0.84 (95% CI [0.58; 0.94]) (FSL pipeline); Philips-Siemens_Prisma was 0.95 (95% CI [0.86; 0.98]) (DSI Studio pipeline) and 0.93 (95% CI [0.80; 0.98]) (FSL pipeline); Philips-Siemens_Trio was 0.81 (95% CI [0.52; 0.93]) (DSI Studio pipeline) and 0.80 (95% CI [0.51; 0.93]) (FSL pipeline); GE-Siemens_Prisma was 0.90 (95% CI [0.74; 0.97]) (DSI Studio pipeline) and 0.84 (95% CI [0.60; 0.94]) (FSL pipeline); GE-Siemens_Trio was 0.87 (95% CI [0.65; 0.95]) (DSI Studio pipeline) and 0.77 (95% CI [0.44; 0.92]) (FSL pipeline); Siemens_Prisma-Siemens_Trio was 0.81 (95% CI [0.53; 0.93]) (DSI Studio pipeline) and 0.85 (95% CI [0.51; 0.93]) (FSL pipeline) (see Table 1).
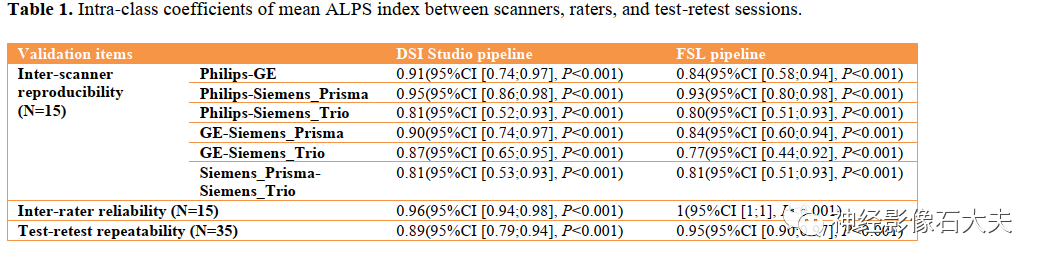
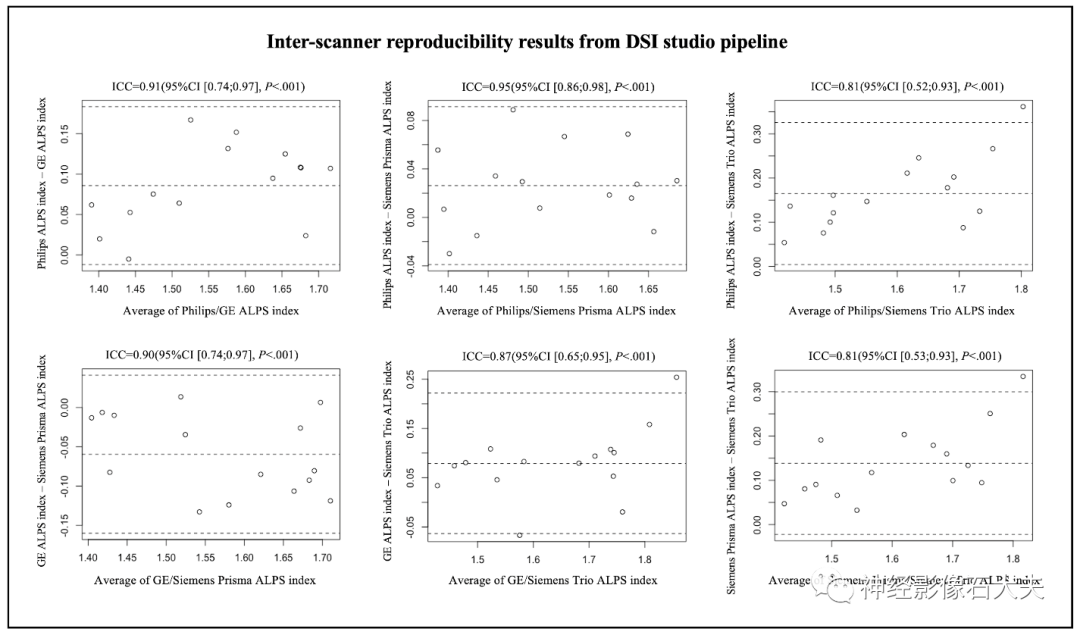 Fig.3. Bland-Altman plots of the inter-scanner reproducibility results from DSI Studio pipeline.
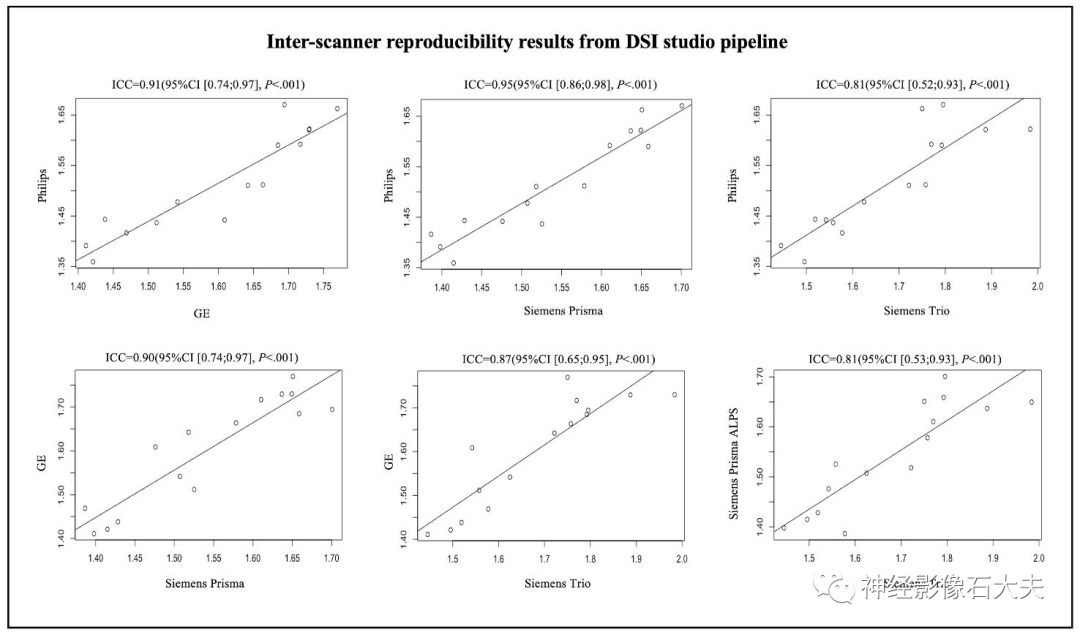
Fig.4. Scatterplots of the inter-scanner reproducibility results from DSI Studio pipeline.
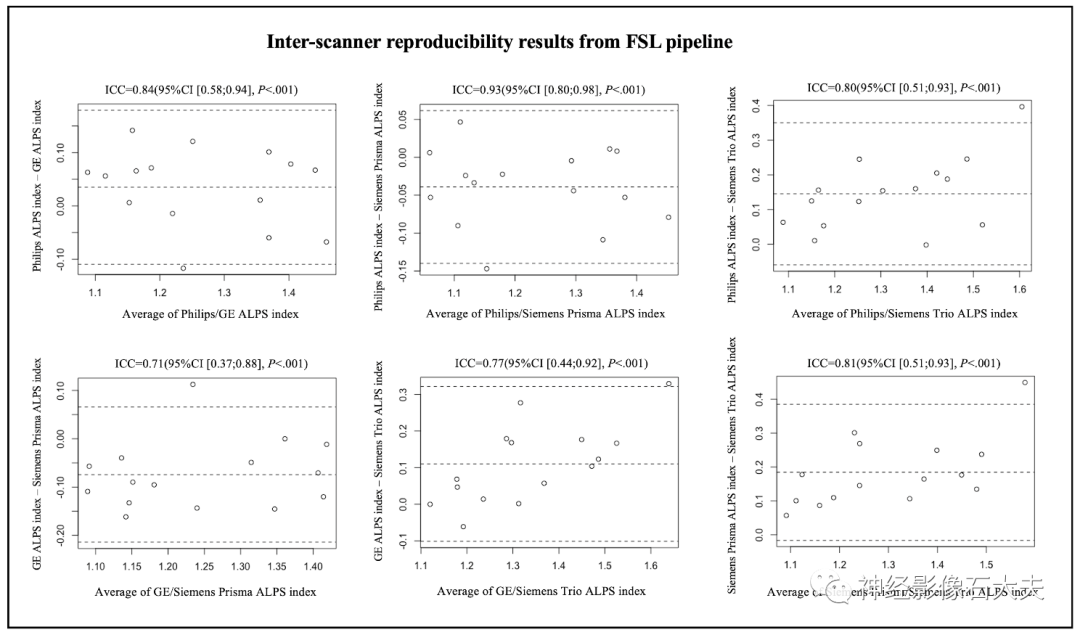
Fig.5. Bland-Altman plots of the inter-scanner reproducibility results from FSL pipeline.
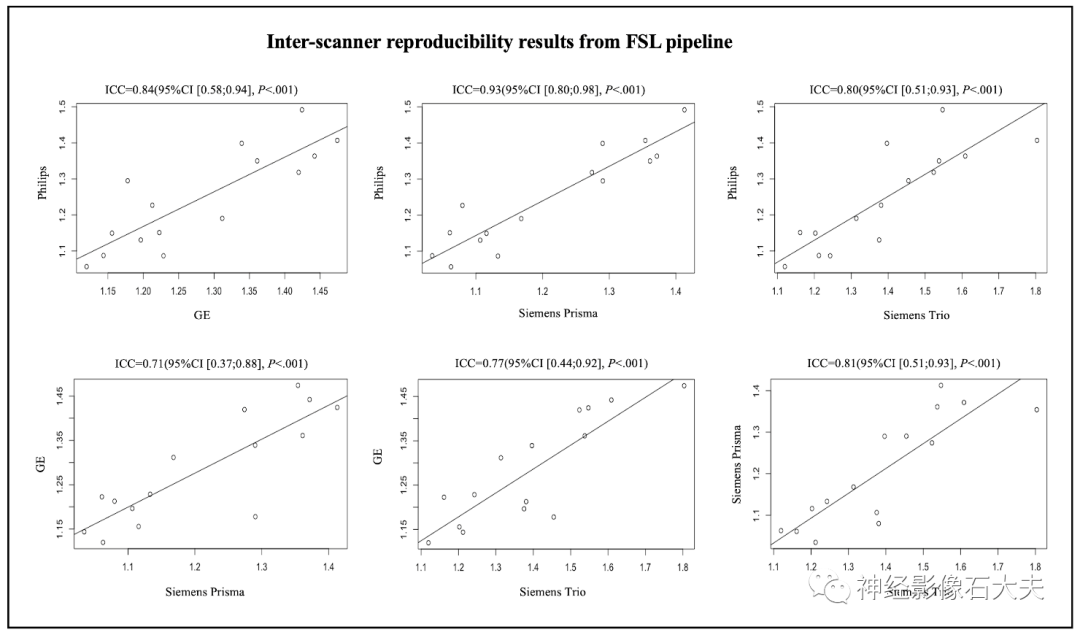 Fig.6. Scatterplots of the inter-scanner reproducibility results from FSL pipeline.Inter-rater reliability
The 15 subjects in the inter-scanner study were also used for the inter-rater reliability study. Two raters (with 10 and 7 years of experience in diffusion MRI data analysis, respectively) independently calculated the ALPS index using DSI Studio and FSL pipelines, analyzing DTI images from the 15 subjects across four MRI scanners (Philips Achieva, Siemens Trio, Siemens Prisma, and GE750W). Bland-Altman plots and scatter plots illustrate the ICCAA results of the ALPS index between the raters for the 15 participants, analyzed using both DSI Studio and FSL pipelines (Fig. 7A, Fig. 7B, Fig. 8A, and Fig. 8B). The overall pairwise ICCAA between raters was 0.96 (95% CI [0.94; 0.98]) (DSI Studio pipeline) and 1 (95% CI [1; 1]) (FSL pipeline) (P<0.001) (see Table 1).
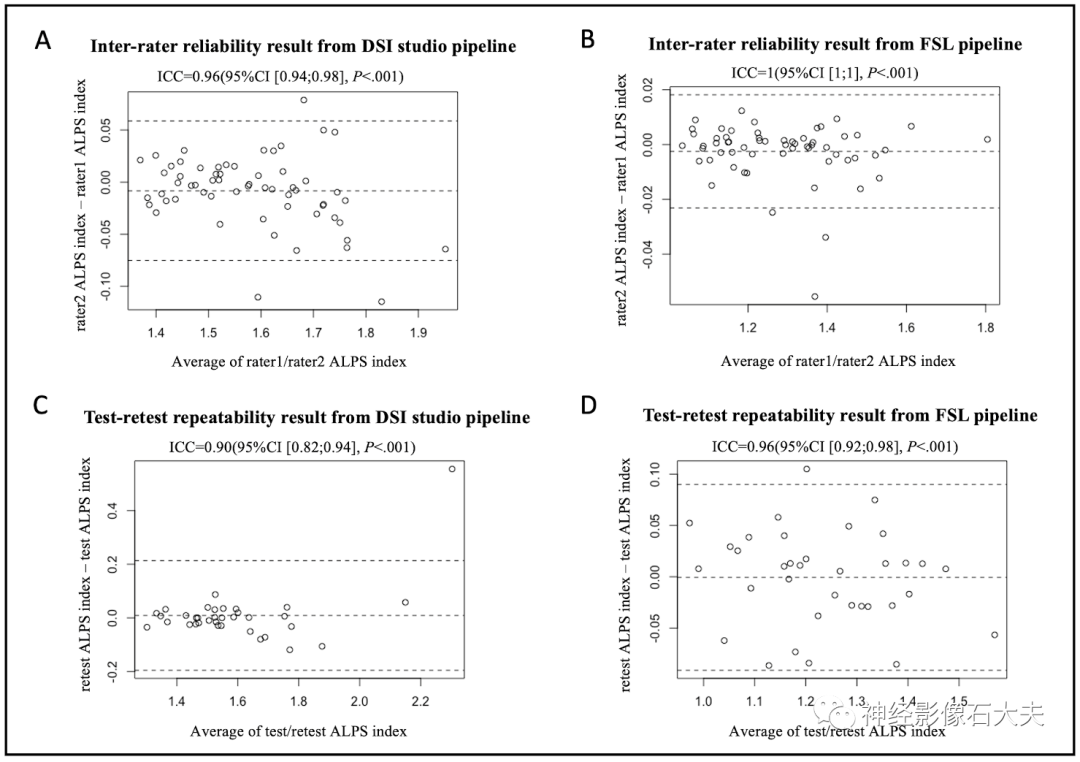
Fig.7. Bland-Altman plots of the inter-rater reliability and test-retest repeatability results. (A and B) The inter-rater reliability results from DSI Studio pipeline and FSL pipeline. (C and D) The test-retest repeatability results from DSI Studio pipeline and FSL pipeline.
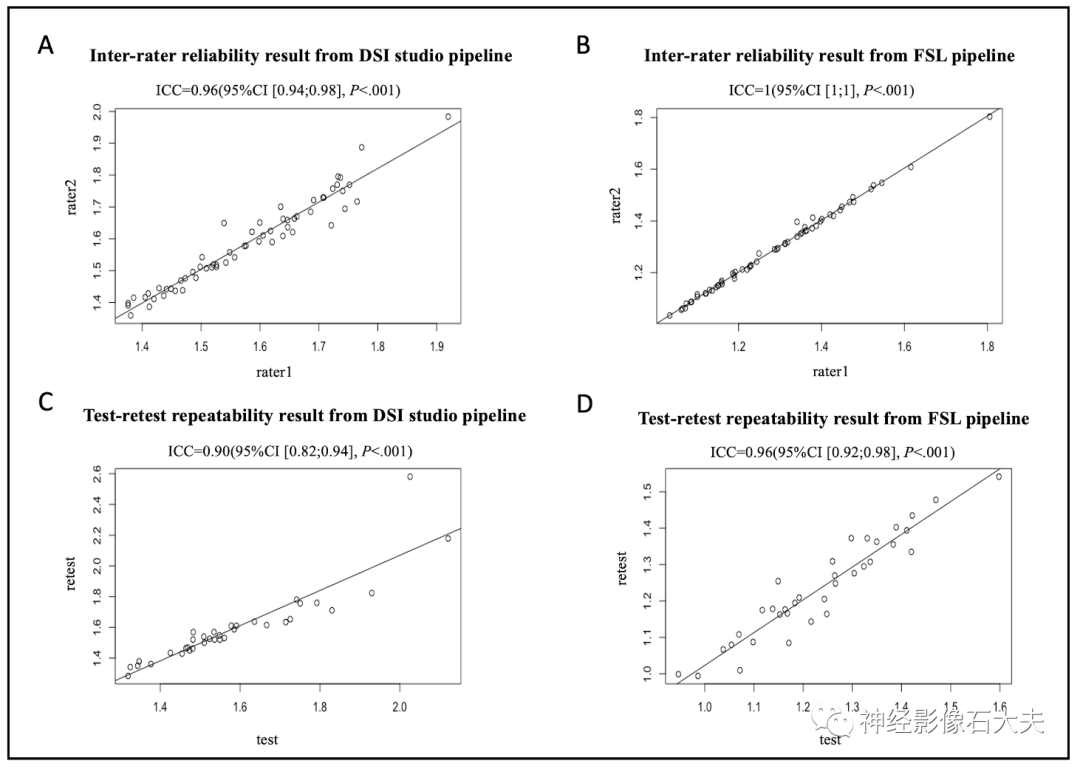 Fig.8. Scatterplots of the inter-rater reliability and test-retest repeatability results. (A and B) The inter-rater reliability results from DSI Studio pipeline and FSL pipeline. (C and D) The test-retest repeatability results from DSI Studio pipeline and FSL pipeline.Test-retest repeatability
A total of 35 participants underwent two MR scans within 14 days at seven participating sites of the MarkVCID consortium, included in the test-retest reproducibility analysis. Bland-Altman plots and scatter plots illustrate the ICCAA results of the ALPS index between test and retest for the 15 participants, analyzed using both DSI Studio and FSL pipelines (Fig. 7A, Fig. 7B, Fig. 8A, and Fig. 8B). The overall pairwise ICCAA between test and retest was 0.89 (95% CI [0.79; 0.94]) (DSI Studio pipeline) and 0.95 (95% CI [0.90; 0.97]) (FSL pipeline) (P<0.001) (see Table 1).
Discussion
To our knowledge, this is the first multicenter, cross-vendor test-retest validation study of the DTI-ALPS method. We conducted this study on the DTI dataset from the MarkVCID consortium and report the instrument validation results, including inter-scanner reproducibility, inter-rater reliability, and test-retest reproducibility using two analysis pipelines. The DTI-ALPS analysis pipeline is expected to be implemented in future multicenter clinical validation studies for assessing novel imaging biomarkers of GS clearance function in neurological diseases, particularly cSVD. In this study, we used the ALPS index for instrument validation and found that the ALPS index showed good consistency across four scanners (Philips Achieva, Siemens Trio, Siemens Prisma, and GE750W), with good inter-rater reliability and high consistency between test and retest. In previous DTI-ALPS studies, considering that the recruited subjects were right-handed and the fiber bundles were thick enough to place ROIs, the left ALPS index was typically used. The calculation of the ALPS index by averaging the bilateral ALPS indices was first proposed by Zhang et al. and applied to the study of glymphatic clearance function in cSVD patients. The authors reported that the ALPS index had good inter-observer and intra-observer reliability (ICC=0.930 and 0.937). Additionally, they found that the ALPS index was significantly correlated with the glymphatic clearance function assessed by DCE MRI with intrathecal gadolinium contrast agents and correlated with MRI biomarkers of cSVD, including the number of white matter hyperintensities (WMHs), lacunes, and microbleeds, as well as enlarged perivascular spaces (ePVS). Another study validated the correlation of the ALPS index, left ALPS index, and right ALPS index with demographic and vascular risk factors in normal aging subjects using a multivariate regression model. The authors found that the ALPS index was associated with demographic and vascular risk factors, including age, sex, hypertension, and DMV scores, compared to the left ALPS index or right ALPS index. However, in this study, no significant correlation was found between the ALPS index, left ALPS index, and right ALPS index with cSVD imaging biomarkers.
Although the DTI-ALPS method has been widely used to study glymphatic clearance rates in various pathologies, there is a lack of studies assessing the reliability and reproducibility of the DTI-ALPS method. Recently, Taoka et al. conducted a study titled “Variability of the ALPS Index in a Multi-Condition Acquisition Experiment (CHAMONIX),” a single-center study that assessed the impact of various MRI scanning parameters on ALPS calculation. Additionally, the reliability and test-retest reproducibility (repeated scans four times within one week) between two 3T MRI scanners (Vantage Centurian and Siemens Magnetom Prisma) were evaluated. The authors found that the ALPS index had similar good inter-scanner reproducibility (ICC range of 0.775-0.828) and test-retest reproducibility (ICC=0.87). They also found that variations in imaging planes, head positioning, and scanning parameters (i.e., TR/TE) significantly affected the reproducibility of the ALPS index. In our study, we noted that the inter-scanner consistency of the Siemens Trio scanner was relatively lower compared to the other three scanners (Philips Achieva, Siemens Prisma, and GE750W). There may be two reasons: 1) Some DTI data collected on the Siemens Trio scanner lacked reverse PE images and b=0 images, making TOPUP distortion correction impossible. 2) As shown in the CHAMONIX study, the TE of the Siemens Trio (TE=84ms) is longer than that of the other scanners, which may affect the reliability of DTI measurements. Our results suggest that DTI data acquisition and processing steps are also potential factors affecting ALPS calculation.
In this study, we applied two DTI data processing pipelines: DSI Studio and FSL pipeline, both commonly used in existing DTI-ALPS studies. There are some differences between the DSI Studio and FSL pipelines (see Table 2). First, DSI Studio provides a user-friendly graphical interface capable of performing TOPUP distortion, eddy current and motion correction, linear and nonlinear normalization from raw space to standard space (e.g., MNI), and reconstruction for estimating various DTI measures, while the FSL pipeline consists of an internal bash script based on FSL commands that can be executed as batch jobs for parallel processing of large datasets. Second, the FSL pipeline includes additional artifact corrections, including MP-PCA denoising and Gibbs deconvolution via MRtrix3 commands. MP-PCA reduces signal fluctuations caused by electronic or ionic motion (i.e., thermal noise). Gibbs deconvolution reduces Gibbs ringing artifacts typically observed near sharp edges and improves the accuracy of estimated DTI metrics. MP-PCA denoising and Gibbs deconvolution have been recommended as the first steps in DTI processing pipelines and have been involved in processing pipelines in previous DTI-ALPS studies. Third, in the DSI Studio pipeline, ROIs are manually drawn (diameter 12 pixels [≈9.4mm]) and placed in the bilateral projection and association fiber regions on the color-coded FA maps of individual subjects transformed to the ICBM152_ault template, while in the FSL pipeline, ROIs are defined as spheres with a diameter of 5mm and placed in the bilateral projection fibers (SCR) and association fibers (SLF) regions based on the JHU-ICBM-DTI-81 white matter labeling atlas. Fourth, DSI Studio allows users to manually correct individual subjects’ diffusion images to template space registration, which is sometimes necessary, while the results of automatic registration performed in the FSL pipeline do not apply manual correction. Although the ALPS indices calculated using the DSI Studio pipeline and FSL pipeline showed good inter-scanner reproducibility, inter-rater reliability, and test-retest reproducibility, the ALPS indices analyzed using the FSL pipeline showed better consistency between raters and test-retest, but slightly lower inter-scanner consistency compared to the DSI Studio pipeline. Further research is needed to determine which processing steps may impact the validation results.
In the original paper by Taoka et al. on the DTI-ALPS method, the authors proposed that the perivascular space extends in the same direction as the medullary veins at the level of the lateral ventricle body, and that association and projection fibers are orthogonal to the direction of the perivascular space. Subsequent studies have applied susceptibility-weighted imaging (SWI) images to identify medullary veins and transformed FA maps and diffusion rate maps into SWI space to determine the location of ROIs in association and projection fibers. This method needs to be evaluated in future validation studies. In our study, the placement of ROIs was based solely on identifying association and projection fibers according to color-coded FA maps or the JHU-ICBM-DTI-81 white matter labeling atlas, which is a major limitation of this study.
In conclusion, this study found that the ALPS index has good inter-scanner reproducibility, inter-rater reliability, and test-retest reproducibility, providing a robust potential biomarker for assessing GS clearance function in neurological diseases, particularly cSVD. Furthermore, this study provides two processing pipelines for DTI-ALPS calculation. Further validation of both ALPS processing pipelines in multicenter clinical studies is necessary.
Click “Read the original article” for more related articles. The original text and supplementary materials can be obtained by contacting the authors.
For those interested in neuroimaging, functional MRI, and machine learning-related content, you can scan the code to join the group for communication and learning.:

Welcome to follow Dr. Shi’s neuroimaging on WeChat.